Developing a Risk Assessment Model for
non-Technical Risk in Energy Sector
Sahar Mohammad AL Mashaqbeh, J. E. Munive –Hernandez
Faculty of Engineering and Informatics
University of Bradford
Bradford, BD7 1DP, UK
[email protected], [email protected]
M. Khurshid Khan
Abdul Wali Khan University, Mardan, KP, Pakistan
[email protected]
Abstract
Risk Management is one of the most relevant approaches and systematic applications of strategies,
procedures and practices management that have been introduced in literatures for identifying and
analysing risks which exist through the whole life of a product ,a process or services. Therefore, the aim
of this paper is to propose a risk assessment model that will be implemented to the energy sector,
particularly to power plants. This model combines the Analytic Hierarchy Process (AHP) technique with
a new enhanced Balance Score Card (BSC). AHP is constructed to determine the weights and the
priorities for all perspectives and risk indicators that involved in the BSC. The novelty in this paper is not
only in using the BSC for risk assessment, but also, in developing a new BSC with six perspectives,
which are sustainability perspective; economic; learning and growth; internal and operational business
process; supply chain and customer/demand perspective. Another three contributions of this paper are
firstly, including the sustainability dimension in BSC, and covering nine risk categories, which comprise
84 risk indicators that have been distributed across the six risk BSC perspectives. Secondly, assessing the
non-technical risks in power plants and finally, this research will concentrate on the strategic level instead
of the operational level where the majority of researches focus on latter but the former is far less
researched. The created model will provide an effective measurement of the risks particularly, in the
power plants sector. The results of this study demonstrate that the supply chain risks perspective is the
keystone for the decision making process. Furthermore, these risk indicators with the new structure of
BSC with six perspectives, help in achieving the organisation mission and vision in addition to affording
a robust risk assessment model. The inputs of this model are composed from a previous stage using a
modified Failure Mode and Effect Analysis (FMEA) (which has been used the Exponential Weighted
Geometric Mean (EWGM)) to understand and analyse all risks, after which, the results of the developed
FMEA which are the Risk Priority Numbers (RPN’s), have been used to build the AHP-BSC risk model.
These risks are collected with difficulty from various literature. This study will be validated in the next
stage in power plants in the Middle East.
Keywords:
Analytic Hierarchy Process (AHP), Balance Scorecard (BSC), Risk Indicators (RI), Risk Priority
Number (RPN), Exponential Weighted Geometric Mean (EWGM)) and Risk Management (RM).
I. INTRODUCTION
Risk Management is one of the most relevant approaches and systematic application of strategies, procedures and practices management that have been introduced to identifying and analysing risks which exist through the whole life of a product or a process. The risk management needs in energy sector emerge from the role of power plants which is very crucial for continuous and reliable energy supply (Chan, 2009). The energy sector faces a broad group of risks (demand, transportation, and market conditions….etc.) which can interrupt the operations and cause significant adverse effects in the energy sector either short-term or long-term performance of the energy organisation. Risks have presented at every stage, from the commission phase to the decommissioning of power plants. Thus, it is important to identify the risks in all stages: commissioning and starting; fuel supply and delivering; operating, running, maintenance and Ash disposal; and finally the decommission stage). These risks will result from a process, products, natural disasters, equipment failures, terrorist attacks, political, economic or environmental concerns (Achebe, 2011). Due to that, it is important to develop a comprehensive, coherent, methodological, structured and systematic approach to identify and assess risks. Consequently, the risk mitigation plans can be developed and implemented.
Accordingly, this paper aims to develop a risk assessment model that will be implemented to power
plants. This model combines the AHP technique with a new enhanced BSC. AHP has been used to
calculate the weights and the priorities for all risk perspectives and each risk indicators. The BSC is used
as a risk assessment tool with six perspectives not four perspectives as the traditional BSC. These
perspectives are sustainability; economic; learning and growth; internal and operational business process;
supply chain and customer/demand perspectives. This paper covering nine risk categories, which
comprise 84 risk indicators that have been, distributed across the six risk BSC perspectives. This research
will concentrate on the strategic level instead of the operational level therefore, all the selected risks are
non-technical risks that will help the top management in the decision making process.
II. BACKGROUND
According to (Smart and Creelman, 2013) ISO31000 standard defines risk as uncertainty influence on objectives with different aspects: environmental ,financial, health and safety, which can be applied to strategic, operation, process or product and project. This standard offers the principles that relate to the risk management process. Some of these principles are:
• Risk management is part of the decision-making process;
• Systematic, timely and structured methodology to risk management that provides comparable ,consistent, and reliable results;
• aligning with the organisations’ context (internal , external and risk policy); • Is a dynamic, iterative and responsive to change;
• Is a continual improvement of the organisation.
Additionally, (Smart and Creelman, 2013) indicate that the importance of this standard is in integrating risk management with strategy, and they claim that the integration between the BSC and ISO31000 has become the main topic within these two areas. Moreover, (Keow Cheng and Hon Kam, 2008) clarify that a structured risk management framework offers a systematic, logical, stringent and rigorous approach to assess and analyses the risks. Many strategic techniques are available to evaluate the performance of organisations, one of these techniques is BSC (Dag, 2010). Several years ago, the concept of BSC has been initiated by (Kaplan and Norton, 1991) and has been used as a performance measurement tool where group of measures (financial & operational) have been used to provide top managers an exhaustive view of the business quickly, where the mission and the objectives of organisations translated to measurable metrics measures in four perspectives :financial performance ;customer satisfaction ; internal processes, and learning & growth. The strategic priorities for various business processes that
create customer and shareholder satisfaction; learning and growth; design to enhance employee competencies and strategic awareness, support organisational change, innovation, and growth (Popa and Cosman, 2011).
Depending on aforementioned, applying the BSC and combining it with the AHP technique to assess non-technical risks, will help the companies to take strategic long-term decisions. (Makajić Nikolić et al., 2011) claim that there is relatively little research on how the risk assessment methods can be used for a non-technical area. Additionally, (Oblakovic, 2013) asserts that most of research focuses less on the strategic level and more on the operational risk management accordingly, there is a lack of comprehensive researches on the risk management at the strategic level. This paper depends on the results of our previous work (ALMashaqbeh et al., 2018) of a modified FMEA and taking the RPN outputs as an input for this research. The FMEA has been applied previously to identifying and analysing the risks using the EWGM. This method applying to overcome some drawbacks of the conventional FMEA. The improved method combines the exponential method and weighted geometric mean. The improved method takes the weights of the three risk factors (severity, occurrence, and detection) into account and reduces the duplications RPN's of the traditional FMEA which will provide more accurate and reasonable data than the traditional method. However, the traditional FMEA has been applied and focused only on the technical part, which is related to the operational level while in the previous research it has been used for non-technical risks at the strategic level. Furthermore, there are not any mechanisms to communicate the strategic level hence, covering all these various risk categories, makes the research more comprehensive and will help and support the organisations in the energy sector to take strategic decisions, which will increase the benefit and the revenue additionally, will make the work environment safe and healthy. The input data for the BSC and AHP model have been taken from the FMEA in our previous paper and will be used in building the AHP model, after which constructing the SD model to study the dynamic environment of non-technical risks in power plants.
Overall, the researches on risks using the BSC have focused of phenomenon from the implementation and theoretical aspects. (Kotze et al., 2015) claim that few organisations focus on implementing risk in BSC. In the same way, (Kaplan, 2010) discusses that more focus needs should be executed for developing the measurement and the risk management additionally, deploying the risk integration with the BSC.
Balanced Scorecard should include leading (performance driver) and lagging (outcome) indicators. Lag indicators epitomise the previously taken actions, while lead indicators are measures leading to archive the results in the lagging indicators (Niven, 2006). (Kaplan and Norton, 2001) discriminate between lagging and leading objectives which have been constructed for the strategic decision level of each perspective as well, the lagging indicators display if the strategic goals and objectives in each perspective have been fulfilled or not. Meanwhile, the leading indicators are very specific for the companies and show how the result should be achieved. However, the indicators integration in all perspectives can be achieved by determining the goals and objectives for the company and selecting a suitable lagging and leading indicators furthermore, they display that the lagging and leading indicators are linked and connected in the individual perspective and affected through all four perspectives of the BSC.
According to International Risk Management Standard AS/NZS ISO 31000:2009, the effectiveness of the management framework that providing the foundations and the arrangements which will be embedded across all the organisation levels will determine the success of risk management. For instance, the University of Adelaide tried to ensure if their risk management framework is effective or not. Consequently, risk management principles have been adopted in the international standard. These principles are: Create and protect value; systematically structured and timely; iterative and responsive to change; continual improvement of the organisation; dynamic; integration of all organisation process and check if it is involved of decision-making process. (The University of Adelaide, 2009). Similarly, The United States Homeland Security attempts to ensure the principle of customisation where this assures includes ensuring that the organisation’s risk management is timely, systematic and structured which helping in taking a systematic and holistic approach to decision-making process. (Department of Homeland Security, 2011). In their white paper AMRAE point out that, the risk management framework provides a structured and formalised mean for bottom-up information on risks and their prioritisation. In addition to that this framework is concerned and organised systematically (AMRAE, 2015).
Risk management is not a separate part from the organisation’s performance management therefore, it should be linked together. The BSC is considered as the most effective and popular way to this linkage where the Key Performance Indicators (KPI’s) help in measuring and monitoring the organisation’s performance, then integrating the BSC with the related Key Risk Indicators (KRI’s). In the integration of risks dimensions into the BSC; the same process that has been done for performance management can be done for the risk management (Ernst & Young, 2009). Indeed, as the BSC provides the organisations with tools for measuring and monitoring the performance,
likewise, the new BSC, with KRI’s, will allow of planning, measuring and monitoring their risk management at all the organisation levels. Consequently, the BSC helps organisations of translating their vision and strategy into clear measurable objectives. These objectives are cascaded from a top-down perspective across the organisation. The KPI’s at a higher level are translated for KPI’s at a lower level and at the top level. At a higher level, the Dashboard of BSC is set out for top management using finite number of KPI’s.
(Bearsly et al., 2006) claim that BSC is the most known strategic performance measurement tool and it occupies an enterprise-wide approach where the organisation missions and strategy are linked to the organisation performance measures which can boost and concentrate to integrate the risk management with the performance measurement. The authors in this article assert that as the BSC helps the organisations of translating vision and strategy into measurable actions all levels of management, similarly, the enhanced risk BSC with KRI’s can capture the required information for the risk management objectives through the risk measures where the risk management can be monitored for all organisation levels.
(Calandro and Lane, 2006) demonstrate that the prime strength of the BSC is the transparency level. The cascading effect of scorecard from various levels of an organisation can offer a common and a robust framework to investigate and manage the risks at these different levels. Conversely, one of the difficulties in BSC that don't allocate the important, priorities of perspectives and the performance indicators within each perspective (Veronese et al., 2012). (Kaplan, 2010) claims that all the objectives are related in cause-and-effect relationships among all perspectives (employees, processes, customers and financial performance). Furthermore, this casual linkage through the BSC guides to strategy map formulation.
Each BSC perspective influences other perspectives by cause and effect relationships. At the top level, the financial measures are dictated through the strategy. The source of revenue (organisation's customers) are the key to achieving these financial goals. The real completed and measured work is the internal business process perspective. How the organisation would manage its human is shown in the learning and growth measures (Kotze et al., 2015).
(Ittner and Larcker, 2008) display the results of a global survey that has included the risk in the BSC which is: 20% of these companies added to their BSC some risk measures,. According to the survey, more than 50% expected to implement risks in their BSC in the future. Along with, (Kotze et al., 2015) in their study have found that 7.7% have used the BSC and this percent doesn’t represent a large rate of adoption but, shows the sample of organisations which meet the study objectives. Relating to the total population; only 2.25% organisations have applied and added the risks with the BSC.
(Calandro and Lane, 2006) have suggested the first paper that has been used the risk scorecard framework, and they claim that this framework of BSC could be an effective risk measurement and management tool.Furthermore, they clarify that the risk scorecards should be separated from performance measurement scorecard. This scorecard includes the same four perspectives of the performance BSC (Customer ,financial, Internal , and Learning and Growth). In contrast, (MOELLER, 2007) describes the cubic COSO ERM framework with the three dimensions cube which includes of eight horizontal rows or risk components, four vertical columns denote to the strategic objectives and the slice for various organisation levels. COSO divides their risks categories for process risks, environmental risks, and Information for decision making risks,
Integration the BSC with one of the Multi-Criteria Decision Making process (MCDM) which is the AHP; has been developed in this study to overcome this difficulty thus, the related weights can be calculated. In this paper, AHP is adopted for allocating the weights of the identified risk indicators in each of the enchanced six perspectives of the new BSC.
A. AHP
The AHP has been adopted first time for environmental assessment by Saaty (1977) after which, has been used broadly (Yang et al., 2014). AHP is a measurement tool executed by pairwise comparisons where the priority scales have been derived depending on the experts judgments (Saaty, 2008). Furthermore, AHP is one of the most widely utilised MCDM methods and has been applied for solving different issues in various areas ( economic, social, political and management sciences) (Wang and Xia, 2009). Problem breakdown is required according to the following steps (Saaty, 2008) to produce priorities and make suitable decisions:
1. Define the problem;
2. Building the decision hierarchy by the goal of the decision at the top level, while the objectives among the intermediate levels (criteria) to the lowest level (alternatives);
3. Structuring the pairwise comparison matrices;
4. The obtained priorities from the comparisons will be used for weighing below level priorities; 5. Repeating this for each element. Then at the level below and for each element, the weighed values
are added and the overall or global priority have been obtained.
6. The weighing and adding process will continue until the final alternatives priorities at the bottom-most level are obtained.
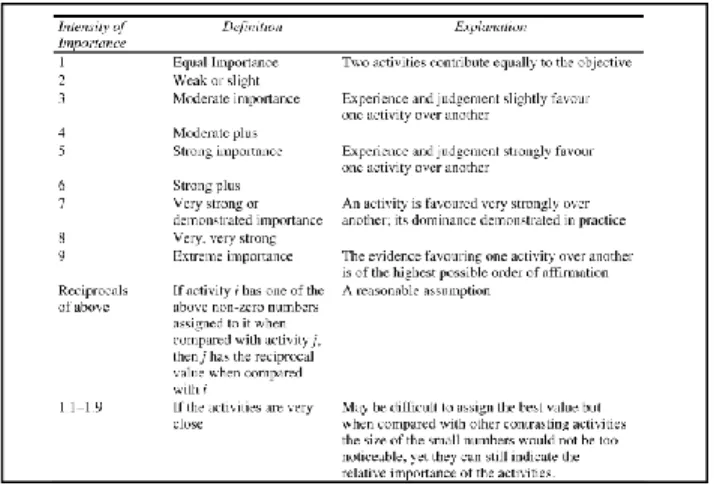
Table 1 exhibits the scale that will be used to build the comparison matrix.
Table 1: The fundamental Scale of absolute numbers (Saaty, 2008)
AHP will be applied to prioritise the risk indicators in power plants through assessing the weight for each risk indicators depending on relative importance of these indicators. According to (Ishizaka and Labib, 2011), consider the possibility to evaluate quantitative , qualitative criteria and alternatives, numerically, verbally or graphically as one of AHP strengths. Moreover, this article has represented one of the key AHP advantages which is the absence of rank reversals due to the inconsistency. In the same way, (Hartwich, 1999) illustrates another advantage, where the qualitative data is converted into quantitative data that will be used for decisions making process.
B. BSC and Sustainability
BSC can assess if the organisation is moved across the strategy and moved correctly to satisfy its objectives and strategies. Subsequently to be effective; the financial part, markets served, processes to be executed, and the most important factor, the employees who will instruct the company to success must be included, all of these aspects should be described. Hence, when the organisations measure their progression, should take into consideration all aspects together. Along with, the organisation can build their BSC and include five perspectives or only three (Niven, 2006), for example (Peter, 2000) in his article evaluates the performance of the process for five perspectives: employee ,financial, customer view, innovation and societal views.
(Niven, 2006) represents the benefits of BSC for organisations. Such benefits include increased financial returns, alignment the employee with the organisation goals and objectives, enhance collaboration.
BSC is a suitable tool for sustainability management hence, linking the social and environmental sustainability part give the chance to companies to follow up strategies execution process and performance (León-soriano et al., 2010).
The definition of sustainability includes three pillars: social, economic and environmental/ ecological systems. The economic pillar assesses the economic sustainability of system to manufacturing goods or provides services continuously while the ecological pillar refers to the environmental sustainable system that preserves a stable system. In contrast, the social dimension is associated with providing social services (health and education, gender equity, and political liability ) (Assefa and Frostell, 2007). In the literature, there are various options for developing the scorecard for integrating the environmental and the social aspects with the BSC, these options are; combine them into the four current perspectives; add a new one or more perspectives concerning social and environmental pillars. Thirdly, a special sustainability BSC can be derived (Wittstruck and Teuteberg, 2011).
In this research, the new developed BSC includes six perspectives while the sustainability part combines four categories. From an extensive review of literature in the area of risk management and risk analysis in energy sector ((Regős, 2013); (Zegordi, Rezaee Nik and Nazari, 2012); (Lidong et al., 2009) ; (Makajić Nikolić et al., 2011)); (Dae-Woong, Yoonseok and Kim, 2016); (El Mokrini et al., 2016); (Dae-Woong, Yoonseok and Kim, 2016); (Radivojević and Gajović, 2014); (Samvedi, Jain and Chan, 2013); (Zegordi, Rezaee Nik and Nazari, 2012)), 84 risk indicators that can have an impact on power plants have been identified, understood, reviewed and evaluated to determine the ranks of those factors. In this study, a new comprehensive, conceptualized risk classification framework for risk decomposition is adapted and developed using the proposed FMEA, the developed methodology would be a generic one and can be modified in some categories as per the organisation objectives, where this framework will help companies at the strategic and tactical levels decision process. The risk categories embrace nine categories, sustainability dimension includes four pillars (economic, environmental, social, and technological) and the other five categories are management risks, internal business process and operational risk, supply risks, customer/demand risks and human resources risks. The contributions in this part of research are located by the number of risks that have been covered all risk types, secondly, added a fourth pillar to the sustainability dimension. III. Methodology
In this study, the six perspectives of the new enhanced BSC have been taken as the framework for establishing the risk management model. Firstly, the RPN's of the proposed FMEA methodology has been used as the input data of AHP. Next, the BSC framework is used to study the different 84 risk indicators across six perspectives. Finally, AHP has been applied to obtain the weights of the selected risk indicators which deployed in the new BSC. Generally, the aim of this paper can be achieved by the following steps:
1. Used the results of the proposed FMEA methodology as the inputs for the AHP;
2. Constructed the new BSC framework with the six perspectives to study the selected risk indicators. 3. Calculated the weights of each risk indicators in the hierarchy.
4. Determined the key risk indicators from the AHP model. 5. Displayed the results.
IV. The BSC Framework
Several studies in the management sector have confirmed that the BSC is an appropriate and effective tool helped organisation to evaluate the performance (Zare Zardeini et al., 2014). However, as the BSC doesn't determine the weights of indicators and perspectives, many scholars attempt to overcome this drawback by integrating the BSC with MCDM (Noori, 2015). (Yaghoobi and Haddadi, 2016) develop an integrated model of BSC and AHP to explore the performance of a telecommunications company. In their study, the authors' emphasis that the BSC is an important tool to measure the business performance from the strategic implementation perspective rather than financial outcomes where that means the BSC offers a comprehensive view of how and where the organisation is going. In contrast, the AHP is applied to calculate the perspectives and indicators weights, which are crucial from the view of the top management. Very little research has been applied to the risk management although the application of the BSC in the management and business area is fine used
A few studies have presented the integration between BSC and risk management (Chabchoub, 2014). (Calandro and Lane, 2006) claim that they have developed the first framework integrates the risk in a scorecard, they design a risk scorecard depends on Kaplan and Norton's BSC. They show that the risk scorecard framework
could be an effective risk management tool, however, merging the risk scorecard and the performance BSC will reduce the effectiveness as a management technique. Moreover, risk measurement and performance measurement have executed various activities by different employees in diverse departments within the organisation.
V. The New BSC Framework and Improved FMEA Results
The contribution of this paper is to propose a new enhanced model for risk assessment framework using a BSC performance measurement tool with a new six perspectives rather than four, one of them is the sustainability. Next, develops an AHP risk model. The proposed model is carried out in two phases. Firstly, after the risk indicators have been identified by a proposed FMEA methodology, the result of the methodology will use to support the AHP inputs where the Risk Indicators (RI's) can be determined and reflected on BSC. This risk model covers non-technical risks where is very limited research in this area. This research will accent on the strategic level instead of the operational level where that the majority of research focuses on latter but the formal is far less researched.
Figure 1, illustrates the new BSC enhanced with six perspectives with one referring to the sustainability. This BSC has been established as a control and management tool for the top management of the organisation, according to the strategic goals, Mission and Vision. The KRI's have been defined by literature review and will be validated in the next stage in power plants in the Middle East. Some of the KRI's are simple to find, but others are hard to obtain because the study attempts to cover different risk categories, particularly in the energy sector. Table 2 shows a part of the final summarised results of the improved FMEA, which have been extensively explained in our prior conference paper (ALMashaqbeh et al., 2018).
Table 2: Part of FMEA Results for some Risk Indicators of Power Plants
Table 2, exhibits the results of applying the traditional FMEA and the developed FMEA using the EWGM. These risks indicators have been derived from various risks categories and have been ranked as shown in Table 2 depending on their priorities from the FMEA outputs either (traditional FMEA or the developed FMEA). Some of these risks are environmental risks, economic risks, internal and business process risks and human resources risks. As Table 2 displays, the waste handling and the supplier price risks are top-ranked risks which mean that these risks are the most important risks. But, among other risks there are differences in the ranking, these differences show that the results of the improved methodology are given more accurate, practical and reasonable results (ex. In practical, the price of electricity (which has been ranked as the second risk in the EWGM) is more important than the load forecasting risk (which has been ranked as the third risk in the traditional FMEA).
RI O WO=0.333 D WD=0.097 S WS=0.57 Traditional RPN EWGM RPN Traditional Rank EWGM Rank
Waste handling Risk 5 4 5 100 359.190 1 1
Supplier Price Risk 5 4 5 100 359.190 1 1
Price of electricity
Risk 5 3 5 75 346.980 3 2
Technical Risk 5 3 5 75 346.980 3 2
GHG emissions Risk 5 3 5 75 346.980 3 2
Lost time Injuries
Risk 5 3 5 75 346.980 3 2
Noise Impact Caused by Energy System
5 3 5 75 346.980 3 2
Bad Odors Risk 5 3 5 75 346.980 3 2
Load forecasting
Risk 4 4 5 80 314.000 2 3
Disruption Risks/
customer side 4 4 5 80 314.000 2 3
Solid waste Risk in
thermal power plants 4 4 5 80 314.000 2 3
Soil Pollution Risk 4 4 5 80 314.000 2 3
Production risk 4 4 5 64 314.000 4 3
Disruption Risks/
supply side 4 4 5 64 314.000 4 3
Asset Depreciation
Risk 4 3 5 60 303.326 5 4
Operating cost Risk 4 3 5 60 303.326 5 4
Raw material and product quality standards (fuel) Risk 4 3 5 60 303.326 5 4 Delay in schedule Risk 4 3 5 60 303.326 5 4 Employee safety Risk 4 3 5 60 303.326 5 4 Human Toxicity Risk 4 3 5 60 303.326 5 4
VI.
Results & Analysis:
Depending on literature review and some real examples of unavailable indicators. The new enhanced BSC has been developed as a hierarchical structure of the BSC risk management with six perspectives and 84 risk indicators. These indicators have been classified into nine categories through the six perspectives, which help in achieving the organisation mission and vision in addition to that, afford a robust risk management model.
Figures (2 and 3) show the comparison matrix values and the calculated values of priorities weights. The highest priority is for the supply chain perspective, which includes two types of risks: production risk and disruption risk with 24.2% of the influence. Followed by the internal and operational business process perspective with 18.4 % where the technical risk is the key risk in this perspective with 10.4%. Subsequently, the disruption risk with 9.4% and the lowest priority risk in this perspective is the “project neglect risk” with 2.5%.
Fig.2: Weights for each perspective and each risk indicators
This BSC-AHP risk model will be validated in the next stage of building the System Dynamic Model (SD), a questionnaire will be distributed to experts from different departments at power plants in the Middle East and then a comparison will be executed between the results of the questionnaire and the results of the model.
VII.
Conclusions:
The developed FMEA methodology that has been used in this research can boost effective decision-making about risks, improve power plants towards risk management, and assist the top management to have an acceptable and preferable understanding of the organisation than lower level managers do who are close more to the day-to-day (tactical plan) organisational operations. Additionally, the results of EWGM-RPN help in developing the AHP model by assigning the comparison importance across each risk indicator. Furthermore, the improved method overcomes some drawbacks in the traditional FMEA in a simple way where this will provide more accurate, practical and reasonable results.
The results of this study demonstrate that the supply chain risks perspective
(production risks, disruption risks) is the keystone for the decision-making process followed by internal
and operational business process perspective.
The developed risk scorecard framework with six perspectives could be an effective tool for risk assessment, where the BSC help in understanding all the selected risk in the appropriate perspective while the AHP provides weights for each perspective and for each risk indicator.
As a whole, these results will be changed depending on power plant and the policy of the country. For example, some of these risks particularly, the economic risks are limited (ex. the power plants transactions in U.S. Dollar have negligible exchange risk since the currency is fixed compared with the U.S. Dollar). Similarly, the generating companies have not been exposed to credit risk because the only client of the company is the National Company in that country, as it is wholly owned by the government. Moreover, the supply risk has a high RPN value comparing with other risk categories and this is because the country depends on the imported fossil fuel to generate electricity (Central Electricity Generating Company/Jordan, 2016).
ACKNOWLEDGMENT
This work is financed by Hashemite university/Jordan. Authors would like to express their appreciation for this kind support.
REFERENCES
ALMashaqbeh, S., Hernandez, J.E.E.M., Khan, M.K., 2018. Developing an FMEA Methodology to Assess Risk Indicators in Power Plants.
AMRAE, 2015. Risk Management Implementing the French RM framework.
Assefa, G.Ã., Frostell, B., 2007. Social sustainability and social acceptance in technology assessment : A case study of energy technologies 29, 63–78. https://doi.org/10.1016/j.techsoc.2006.10.007
Bearsly, M., Chen, A., Kara, N., Luna, W., 2006. Working hand in hand : Balanced Scorecards and Enterprise Risk Management. Strategy. Finance. 87, 49–55.
Calandro, J., Lane, S., 2006. An introduction to the Enterprise Risk Scorecard. Meas. Bus. Excell. 10, 31–40. https://doi.org/10.1108/13683040610685775
Central Electricity Generating Company/Jordan, 2016. CEGCO Annual Report. Amman/Jordan.
Chabchoub, S., 2014. Associating Risk Management with a Performance Measurement System : Case of Academic Libraries 344–349.
Chan, S.T., 2009. IDENTIFYING RISK FACTORS IN THE GENERATING SECTION OF THE POWER PLANTS By.
Dag, M., 2010. Expert Systems with Applications Using the fuzzy analytic network process ( ANP ) for Balanced Scorecard ( BSC ): A case study for a manufacturing firm 37, 1270–1278.
Department of Homeland Security, 2011. Risk Management Fundamentals. Ernst & Young, 2009. A new balanced scorecard.
Hartwich, F., 1999. Weighting of Agricultural Research Results: Strength and Limitations of the Analytic Hierarchy Process (AHP) 1–18.
Ishizaka, A., Labib, A., 2011. Review of the main developments in the analytic hierarchy process. Expert Syst. Appl. 38, 14336–14345. https://doi.org/10.1016/j.eswa.2011.04.143
Ittner, C.D., Larcker, D.F., 2008. Extending the Boundaries: Nonfinancial Performance Measures. Handbooks Manag. Account. Res. 3, 1235–1251. https://doi.org/10.1016/S1751-3243(07)03002-7
Kaplan, R.S., 2010. Conceptual Foundations of the Balanced Scorecard Conceptual Foundations of the Balanced Scorecard 1.
Kaplan, R.S., Norton, D.P., 2001. Transforming the balanced scorecard from performance measurement to strategic management.
Kaplan, R.S., Norton, D.P., 1991. The Balanced Scorecard – Measures that Drive Performance The Balanced Scorecard — Measures. Harward Bus. Reivew 1–11.
Keow Cheng, S., Hon Kam, B., 2008. A conceptual framework for analysing risk in supply networks. J. Enterp. Inf. Manag. 21, 345–360. https://doi.org/10.1108/17410390810888642
Kotze, P.N., Vermaak, F.N.S., Kirsten, E., 2015. Including risk in the balanced scorecard : Adoption rate and implementation methods of Johannesburg Stock Exchange listed organisations. South. African Bus. Rev. Spec. Ed. Account. Res. 99–117.
León-soriano, R., Muñoz-torres, M.J., Chalmeta-rosaleñ, R., 2010. Methodology for sustainability strategic planning and management. Ind. Manag. Data Syst. 110, 249–268. https://doi.org/10.1108/02635571011020331
Makajić Nikolić, D., Jednak, S., Benković, S., Poznanić, V., 2011. Project finance risk evaluation of the Electric power industry of Serbia. Energy Policy 39, 6168–6177. https://doi.org/10.1016/j.enpol.2011.07.017 Niven, P.R., 2006. Second Edition, Second Edi. ed. John Wiley & Sons, Inc., Hoboken, New Jersey.
Noori, B., 2015. Prioritizing strategic business units in the face of innovation performance : Combining fuzzy AHP and BSC. Int. J. Bus. Manag. 3, 36–56. https://doi.org/10.20472/BM.2015.3.1.003
Oblakovic, G., 2013. Risk Management at the Strategic and Operational Levels of Swiss Banks : Current Status and Lessons Learned from the Subprime Crisis.
Peter, K., 2000. Process performance measurement system : A tool to support process-based organizations. Total Qual. Manag. 11, 67–85.
Popa, V., Cosman, V., 2011. Performance Management of Supply Chain Using Balanced Scorecard in Nonprofit Organizations. Supply Chain Manag. J. 2, 1–13.
Saaty, T.L., 2008. Decision making with the analytic hierarchy process. Int. J. Serv. Sci. 1, 83. https://doi.org/10.1504/IJSSCI.2008.017590
Smart, A., Creelman, J., 2013. Risk-Based Performance Management - Integrating Strategy and Risk Management, Statewide Agricultural Land Use Baseline 2015.
The University of Adelaide, 2009. Risk Management Handbook. Ann. Phys. (N. Y). 54, 258.
Veronese, A., Carneiro, J., Ferreira, J., Kimura, H., 2012. Multidimensional assessment of organizational performance : Integrating BSC and AHP ☆. J. Bus. Res. 65, 1790–1799.
https://doi.org/10.1016/j.jbusres.2011.10.039
Wang, Y., Xia, Q., 2009. A Fuzzy AHP and BSC Approach for Evaluating Performance of A Software Company Based on Knowledge Management. Knowl. Manag. 2242–2245.
Wittstruck, D., Teuteberg, F., 2011. Development and Simulation of a Balanced Scorecard for Sustainable Supply Chain Management – A System Dynamics Approach. Wirtschaftinsformatik Proc. 2011 Pape 86.
Yaghoobi, T., Haddadi, F., 2016. Organizational performance measurement by a framework integrating BSC and AHP. Int. J. Product. Perform. Manag. 65, 959–976. https://doi.org/10.1108/IJPPM-01-2015-0001
Yang, Q., Xie, Y., Li, W., Jiang, Z., Li, H., Qin, X., 2014. Assessing soil erosion risk in karst area using fuzzy modeling and method of the analytical hierarchy process. Environ. Earth Sci. 71, 287–292.
https://doi.org/10.1007/s12665-013-2432-x
Zare Zardeini, H., Ahmad, Y., Seyyed, M., 2014. Evaluating and ranking performance by combination model of balanced scorecard and ariadne uncertain estimate. Asian Soc. Sci. 10, 70–83.
https://doi.org/10.5539/ass.v10n2p70
Biographies
Sahar Mohammad AL Mashaqbeh currently a PhD student within the School of Engineering, University of Bradford with research interests in risk and supply chain management, I have a BSc. In
Mechatronics Engineering and an MSc. In Industrial Engineering from the Hashemite university/ Jordan. She has worked as a planning and a quality Engineer at CEGCO/Jordan for 10 years.
J. E. Munive-Hernandez is a Lecturer in Advanced Manufacturing Engineering at the Faculty of Engineering and Informatics, University of Bradford. He received his Ph.D in Total Technology from the University of Manchester Institute of Science and Technology in 2003. His major research interests include the analysis, development and implementation of knowledge management initiatives to support strategic management decisions in the context of manufacturing organizations, their supply chains and other operational functions, including SMEs.
Mohammed Khurshid Khan is currently a Vice Chancellor, of Abdul Wali Khan University Mardan. He has worked as a Professor of Manufacturing Systems Engineering at the University of Bradford. Professor Khan received his BEng, PhD and MBA degrees from the University of Bradford, United Kingdom in 1983, 1987 and 1997, respectively. His PhD area of research was experimental and theoretical study of air turbulence and heat transfer in Nuclear AGR boilers. His research interests are in the area of Artificial Intelligence (AI)/Knowledge-Based Systems and their applications to Manufacturing & Quality Systems, Strategy, Planning, Control, Scheduling, and Supply Chain Management. He has published over 100 journal/conference papers, and has supervised over 15 PhD/6 MPhil in these areas. He has also had research collaboration with local (NTR Weatherby, Flexitallic), national (Ford, BAE Systems) and international (Proton, Profen, Perodua) manufacturing organizations.