Parametric Analysis of BFOA
for Minimization Problems Using a Benchmark Function
(Análisis paramétrico de BFOA para problemas de minimización
utilizando una función de evaluación)
Dannyll Michellc Zambrano1, Darío Vélez1, Yohanna Daza1, José Manuel Palomares2 Abstract
This paper presents the social foraging behavior of Escherichia coli (E. Coli) bacteria based on Bacteria Foraging Opti-mization algorithms (BFOA) to find optiOpti-mization and distributed control values. The search strategy for E. coli is very complex to express and the dynamics of the simulated chemotaxis stage in BFOA is analyzed with the help of a simple mathematical model. The methodology starts from a detailed analysis of the parameters of bacterial swimming and tumbling (C) and the probability of elimination and dispersion (Ped), then an adaptive variant of BFOA is proposed, in which the size of the chemotherapeutic step is adjusted according to the current suitability of a virtual bacterium. To evaluate the performance of the algorithm in obtaining optimal values, the resolution was applied to one of the bench-mark functions, in this case the Ackley minimization function; then, a comparative analysis of the BFOA was performed. The simulation results have shown the validity of the optimal values (minimum or maximum) obtained on a specific function for real world problems, with a function belonging to the benchmark group of optimization functions.
Keywords
Metaheurístics; Bacterial Foraging Optimization Algorithm; Chemotaxis; optimization algorithm; benchmark function
Resumen
Este trabajo estudia el comportamiento de búsqueda de alimento social de la bacteria Escherichia Coli (E. Coli), para ello se basa en algoritmos de Optimización de Bacteria Foraging (BFOA) con el fin de encontrar valores de optimiza-ción y control distribuido. La estrategia de búsqueda de E. Coli es muy compleja de expresar y la dinámica de la etapa de quimiotaxis simulada en BFOA se analiza con la ayuda de un simple modelo matemático. La metodología parte de un análisis detallado de los parámetros de natación y tumbling bacteriano (C) y de la probabilidad de eliminación y dispersión (Ped), para luego proponer una variante adaptativa de la BFOA, en la que se ajusta el tamaño del paso quimioterapéutico en función de la idoneidad actual de una bacteria virtual. Para evaluar el rendimiento del algorit-mo en la obtención de valores óptialgorit-mos, se aplicó la resolución a una de las funciones de referencia, en este caso la función de minimización de Ackley; a continuación se realizó un análisis comparativo del BFOA. Los resultados de la simulación han mostrado la validez de los valores óptimos (mínimos o máximos) obtenidos en una función específica para problemas del mundo real, con una función perteneciente al grupo de referencia de funciones de optimización.
Palabras clave
Metaheurística; Algoritmo de optimización de forrajeo bacteriano; Quimiotaxis; algoritmo de optimización; función de evaluación.
1. Introduction
Several decades ago, research on optimization was attracting more and more attention. There are different methods and algorithms that can be grouped into deterministic and stochastic (Floudas, 2000; Spall, 2003). Deterministic algorithms depend on the mathematical nature of the problem. The weaknesses of this technique are that depends on the gradient, is likely to
stagnate in optimal locations, and inefficiency in large-scale search spaces. Stochastic tech-niques are considered more user-friendly because they do not depend on the mathematical properties of a given function and are thus more appropriate for finding the optimal overall so-lutions for any type of function. As real-world optimization problems become increasingly com-plex, the use of stochastic methods becomes inevitable.
Genetic Algorithms (GAs) are adaptive methods that can be used to solve optimization search problems. They are based on the genetic process of living organisms. Genetic algorithms use heuristics for problem solving, which drastically limits the number of data to be used (Na-jarro, López, Racines, & Puris, 2017) (Rivero Peña, Novoa Hernández, & Fernández Ochoa, 2015). Algorithms with heuristic meta-heuristics are used to achieve optimal values in various areas of knowledge; in Viera Carcache, Vinces Llaguno, Guerrero Goyes, & Marcillo Vera (2017) the heu-ristic meta-heuheu-ristic Optimization based on Ant Cologne (ACO) is used for a mathematical model in applications in mobile phone systems.
Nature’s ecosystems have always been a source of mechanisms for the inspiration and design of artificial computer systems for the solution of problems of considerable complexity in engineering and computer science. In the field of optimization, researchers have been ins-pired by biological processes to develop stochastic techniques that imitate the structures or behavior of certain creatures. As an example, genetic algorithms (GA), originally developed by Holland, 1975, represent an exact abstraction of Darwin’s model of evolution and biological genetics; ACO (ant colony optimization), proposed by Dorigo, Maniezzo, & Colorni (1996) and Dorigo, Di Caro, & Gambardella (1999), is based on the behavior of forage ant colonies; PSO (particle swarm optimization), proposed by Eberchart & Kennedy (1995) and Chen, Zhu, Hu, & He (2010), welcomes ideas inspired by the behavior of flocks of birds and schools of fish. These algorithms have been developed to improve performance on classical heuristics or gradient-based methods, especially those functions that are undifferentiated, multimodal, and discrete. Today, these paradigms have been used in a wide range of areas.
In this paper, the biology and physics behind the chemotactic behavior (cell displacement induced by a substance) of the E. coli bacterium is explained; then the algorithmic optimization model of the foraging behavior of the E. coli is introduced; at the end a practical case study is shown where the algorithm can execute the optimization for a minimization problem given a benchmark function.
The Bacterial Foraging Optimization (BFO) algorithm (Muller, Marchetto, Airaghi, & Ko, 2002) is a new kind of global stochastic search technique biologically inspired by the clustering and displacement behavior of the E. coli bacteria, which was introduced by Passino (2002), as well as similar ones based on collective swarms such as PSO and ACO, which have proven their effectiveness in this type of optimization. So far BFO has been successfully applied to several engineering problems, such as optimum control (Passino, 2002), harmonic estimation (Kim & Cho, 2005), reduction of transmission losses (Mishra, 2005), and automatic learning (Tripathy, Mishra, Lai, & Zhan, 2006).
In the same way that other algorithms mimic the behavior of animals in hunting, foraging, the strategy of searching for and grouping a swarm of E. coli bacteria in function optimization is the central idea of this relatively new algorithm.
2. Related Works
Researchers have developed dozens of optimization algorithms. Among these algorithms, some have gained significant acceptance in the research community. Such popular algorithms are taken into account in observations for experimental studies, one of which is the BFOA which is among the most popular metaheuristics under the swarm intelligence category (Salleh M.N.M. et al., 2018) analyzes the metaheuristics based on swarms within the intelligent social beha-viors that occur in nature, focusing on the mechanisms of social interaction that maintain the balance between exploration and exploitation in an interval of iterations.
Heuristic algorithms reduce the effort, time, and errors of conventional methods, such as the trial-and-error method and the experience of the design method. In Elsisi (2019) and Zhou, Yang, & Wang (2019) the performance of a proposed algorithm is compared with other well-known algorithms through several Benchmark functions where it is stated that if the best solu-tion with respect to the random initial is far from the optimal solusolu-tion, the heuristic algorithm may take several iterations to reach the optimal solution.
In Guang-Yu & Wei-Bo (2017) the BFOA was compared using reference functions. The re-sults obtained by the experiments indicate that the performance of the BFOA is among the six best algorithms in terms of the ability to converge to optimal or near-optimal solutions by applying the Ackley function, which is a multimodal function with many local optimals, and re-presents the most difficult class of problems for many optimization algorithms.
In Yıldız & Altun (2015) a comparative study of BFOA using numerical reference points is performed. Hybrid BFOA methods are proposed, improving the performance of the original algo-rithm. The Chemotaxis differential evolution optimization algorithm (CDEOA), which is based on two strategies, one of them makes the bacteria stronger and more exploitative, achieving that either of the two variants integrated into BFOA can improve performance in complex situations in fitness environments.
Within data mining in Mahapatra & Banerjee (2015) an object-oriented implementation of the Bacteria Foraging System (BFS) using BFOA is described, for the solution of data grouping problems. In data grouping, data is divided into significant groups called clusters without any prior knowledge and is an important technique in several fields, which has been compared to several optimization algorithms such as the PSO.
In Feng, He, Yang, & Juan (2016) a variant to BFO is proposed using a new auto adaptable chemotaxis mechanism based on evolution strategies called ES-ABFO, based on the fact that each bacterium is looking for nutrient-rich areas; in fact, the chemotaxis process is an evolutio-nary progress, with this we look for the algorithm to maintain a better balance between a local search and a global search. Experiments are carried out to verify the reference functions and compare them with BFOA, PSO and other algorithms.
There are studies that improve the BFOA, in Wang, Zhao, Tian, & Pan (2018) and (Zhang, Chen, Luo, & Xu, 2018) variants are proposed in the original BFOA evaluating performance with well-known numerical reference functions, being of great importance to promote research and improve the applications of the BFO algorithm.
3. BFO Algorithm
Bacteria grouping is an evolutionary algorithm which calculates the cost of the function after each iteration as the execution of the program progresses towards better fitness (optimal cost function).
3.1. Basic description of the BFO algorithm
The parameters to be optimized represent the coordinates (position in the plane) of the bac-teria. The parameters are discrete within the desirable range, each set of these values repre-senting a point in the coordinate space. Then a bacteria is positioned (created) at each point. As the iterations progress, the bacteria move to new positions (new coordinate values) and at each position the cost is calculated, and according to these values, the next movements of the bacteria are decided by the current gradient calculation, together with defined parameters. The aim of this is to bring the bacteria to the highest fitness position (optimal value).
The search and development strategy of the E.Coli bacteria is determined by four pro-cesses. These are chemotaxis, swarming, reproduction, and, elimination and dispersion. Che-motaxis is performed through swimming and tumbling (Floudas, 2000) (Biswas, Dasgupta, Das, & Abraham, 2007). When the bacterium finds a favorable environment (rich in nutrients and free from harmfulness) it continues to move in the same direction (swimming). The decrease in the cost function represents a favorable environment, while the increase in cost represents an unfavorable environment. When you encounter an unfavorable environment, the bacteria turn (tumbling) in other words, they change their direction. In swarming, bacteria move from their respective sites into cell groups.
3.2. Chemotaxis and Clustering
Chemotaxis simulates the movement of an E. coli by means of swimming and tumbling, the movements that allow it to carry out the scourges of the bacteria, cause it to advance or turn. Biologically this bacterium can move in two ways, it can swim and advance in the same direc-tion for a period or it can turn in another direcdirec-tion, and alternate between these two modes of operation during its lifetime. Let’s suppose that Ɵi(j,k,l) represents the i-th bacterium in its j-th chemothalamic step, k-th reproductive step and l-th elimination-dispersion step. C(i) is the measure of progress (step) in a random direction specified by the tumble. In this way the che-motherapeutic movement can be represented in a computational way by Eq. (1).
(1) Where ∆ represents a random address vector whose elements belong to the range [-1, 1]. If the i-th bacteria finds a favorable medium, which represents less value in the cost function at a point in the coordinate space, then it is still swimming in the same direction it had in the previous chemotherapeutic step j-th. Otherwise, ∆ (i) is assigned a new value which is a random number within the range [-1, 1].
An interesting group behavior observed in some species of bacteria including E. coli is swarming, in which through an intricate and stable set of temporal-space patterns (swarms), these are grouped together. A group of E. coli join to form a traveling ring which moves along the
nutrient gradient, attracted by a chemo-effect of the nutrient substance. When stimulated by a high level of succinate (an enzyme component of cells), bacteria release an attractive asparta-te, which helps them to form in groups and thus move in concentric swarms with a high density. Communication in these E. coli swarms can be represented by function, Eq. 2. representing the swarming of E. coli bacteria.
(2)
Where is the value of the target function, S is the population of bacteria, p is the number of variables to optimize, which is present in each bacterium and is a point in the p-dimensional search domain; , , , are coefficients that must be set appropriately (Floudas, 2000; Passino, 2002).
3.3 Reproduction
The health status (fitness) of each bacterium is calculated after each complete chemothera-peutic process. It is generally the sum of costs function , where Nc is the total number of a complete chemotherapeutic process. Healthy bacterial locations represent the best set of optimization parameters. Then, to speed up and refine the search, more bacteria are required to be placed in the best locations that are achieved in the optimization domain, which is done in the reproduction process. Half of the healthiest bacteria survive (those with the lowest cost value of function), while the other half die. Each surviving bacteria divides in two and is placed in the same location. In this way the population of bacteria remains constant.
3.4 Disposal and Dispersion Event
The chemotherapeutic process performs a local search while reproduction accelerates the convergence of search parameters.
Although chemotaxis and reproduction may not be enough to reach the global minimum, because the bacteria may become stagnant in a local minimum, assuming that this is the best position in the surrounding area. To prevent this stagnation from happening, the elimination and dispersal event is applied. Those bacteria with a probability of elimination and dispersion are eli-minated from the current location and randomly relocated in order to generate a global search, the population of bacteria remains constant.
4. Basic BFO Algorithm
Exposed the mathematical considerations of the simulation of the chemotherapeutic process, and the other processes that a bacterium E. coli performs when looking for food, the basic pseudocode of the BFO algorithm is exposed:
Parameters:
[Step 1] Initialize parameters p, S, Nc, Ns, Nre, Ned, Ped, C(i)(i=1, 2...S), Ɵi.
Algorithm:
[Step 2] Control loop elimination - dispersion: l=l+1
[Step 3] Playback control loop: k=k+1
[Step 4] Chemotaxis control loop: j=j+1
[a] For i = 1, 2,...S take a chemotherapeutic step for the bacteria i as follows: [b] Calculate the fitness of the function, J(i, j, k, l).
Let J(i,j,k,l) = J(i,j,k,l) + Jcc(Ɵi(j,k,l),P(j,k,l)) (as an example, add the cell-to-cell
attractiveness-repellent profile to simulate group behavior) Where, Jcc is defined as (2).
[c] Let Jlast = J(i,j,k,l) save this value as to find a better cost in an upcoming execution. [d] Flip (tumble): generate a random vector with each element ∆m (i), m = 1, 2,...,p, a random number between[-1.1].
[e] Move: Do
Ɵi (j+1,k,l) = Ɵi(j,k,l) + C(i)
This result adds up a C(i) size step towards the direction in which the bacteria i turns. [f] Calculate J(i, j+1,k,l) and compute
J(i,j+1,k,l)=J(i,j,k,l)+Jcc(Ɵi(j+1,k,l),P(j+1,k,l))
[g] Swimming (swim)
i) Set m=0 (counter for swimming distance) ii) As long as m < Ns(if not too low).
Set m=m+1.
If J(i,j+1,k,l) < Jlast (if it is better), do Jlast=J(i,j+1,k,l) and obtain
Ɵi(j+1,k,l)= Ɵi(j,1,k,l)+C(i)
And use Ɵi(j+1,j,k) to calculate the new J(i,j+1,k,l) as in the step [f].
Otherwise, do m=Ns. This is the end of the loop while (ii).
[h] Go to the next bacteria (i+1) if i ≠ S (e.g. go to[b] to process the next bacteria).
[Step 5] If j < Nc, go to[Step 4]. In this case, the chemotaxis continues as long as the bac-teria is still alive.
[Step 6] Reproduction:
[a] For k and l, and for each i=1,2,...,S, Let the
Be it the health of the bacteria i (a measure of how many nutrients they possess during their lifeti-me and how satisfying it is to avoid harmful substances). Sort the paralifeti-meters of bacteria and C(i)
chemotaxis in ascending Jhealth order (higher cost means lower health).
[b] The Sr bacteria with the highest Jhealth value die and the remaining bacteria in Sr with the best values are divided (this process is executed by the copies being made and placed in the same po-sitions as their parents).
[Step 7] If k < Nre, go to [Step 3]. In this case, the specific number of playback steps has not been reached, so we start with the next generation of the chemotherapeutic loop.
[Step 8] Elimination - Dispersion: i=1,2,...,S with probability Ped, eliminate and disperse each bacterium (this keeps the number of bacteria in the population constant). To do this, if a bacterium is killed, it simply spreads a new one in a random location over the optimization do-main. If l<Ned, then go to [Step 2]; otherwise terminate.
5. BFOA Analysis
The removal and dispersal operator is an essential link in BFOA.
5.1 BFOA Elimination and Dispersion interval analysisWith the probability of Ped, each bacterium is eliminated and dispersed in order to maintain a cons-tant number in the population. If one bacterium is killed, another is randomly placed in another location within the optimization domain. The elimination and dispersion help those bacteria that are trapped in a local optimum to escape. A higher probability of migration can help a bacterium to escape from a local optimum, but it also brings a problem called “leakage” that affects the speed of convergence and accuracy of the algorithm, and such a situation is not desirable.
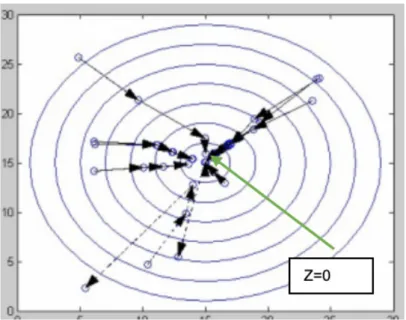
Figure 1. Trajectory of the bacteria within the search scenario
For example, BFO is applied to solve a simple nonlinear function: z = (x-15)2+(y-15)2, where
x∈ [0,30], y ∈ [0,30]. Assuming a population of 10 bacteria, the number of generations is 4, the chemotherapeutic operator is executed 10 times in each generation, and the probability of elimination and dispersion is 20%, the individual trajectories of the bacteria are shown in Fig. 1. This function has an optimal solution in z = 0, where x=15 and y=15.
The origin shows the position of each bacterium, and the vectors show the change in the position of each bacterium, after a generation of optimization run. As shown in the figure, most bacteria are moving to the optimal position. Also, some bacteria marked with segmented lines
near or above the optimum value suddenly move considerably away from the optimal value due to the removal and dispersal operation on the bacteria.
How can this be avoided? In the individual process of a bacterium, if the bacteria selected to apply the elimination and dispersal is at or near the overall optimum point, leakage will occur. Therefore, to prevent this from happening, such bacteria must be prevented from being selec-ted. In addition, the removal and dispersal operator must be improved.
Additionally, individuals are sorted according to their current fitness level, the operator selects the individuals according to the Ped probability of the fitness values that are positioned behind the position according to the selection method used; while those in front will not be selected, because the individuals in front are in the overall optimal solution or very close to it. In this way, the individual’s escape can be effectively prevented. As generations increase, indi-viduals move closer to the optimal position. The proportion of removal and dispersion intervals should be reduced appropriately. Let Q be the percentage of removal and dispersion of the bac-teria, and its initial value 1. The generation is the counter value of the chemotherapeutic gene-ration, and its initial value is 0. A removal and dispersal cycle is performed every 10 generations of the algorithm, and the goal of removal and dispersal should be reduced every 20 generations. This means that if MOD 10 = 0 generation, then the removal and dispersion can be executed. Be it ged = generation DIV 20, Q = 1 – (2*ged*L), where L is the percentage of the initial value of the bacteria not involved in removal and dispersal. As generations increase, ged also increases, and the percentage of elimination and dispersion decreases. As a result, we can say that the occurrence of the escape phenomenon can be avoided, and thus the speed of convergence can be improved considerably.
5.2 Chemotaxic interval analysis in BFOA
Chemotaxis is one of the most important actions at BFOA. During chemotaxis, bacteria are continuously swimming in search of the optimal solution to the problem. In the initial posi-tion, a bacterium turns over (tumbles) to take a random direction and then measures the feed concentration (measures the cost), then swims a fixed distance and then measures the con-centration there again. This turning and swimming action constitutes a chemotacic interval, if the food concentration (higher fitness) is higher in the next location, the bacteria will advance in that direction again, otherwise if the concentration is reduced, the bacteria will then turn (tumble) to look for another direction to go (swimming). This process is carried out repeatedly, until maximum intervals are reached, which is limited by the lifetime of the bacteria.
In chemotaxis, the size of the interval is an important parameter, when the bacterium determines swimming in one direction (Biswas, Dasgupta, Das, & Abraham, 2007) (Yao & Liu, 1998). How is the interval size determined? in conventional BFOA, a fixed interval size was se-lected based on experience. However, such consideration usually slows down the convergence speed of the algorithm. Thus, there should be better parameter values.
The selection of the interval size parameter is critical, through the algorithm design pro-cess. If the value is too small, the search will remain stagnant at a local optimum. On the other hand, if the value is too high, the search will lose the overall optimum.
6. Results
6.1 Proposal of the benchmark function, procedures and evaluation method.
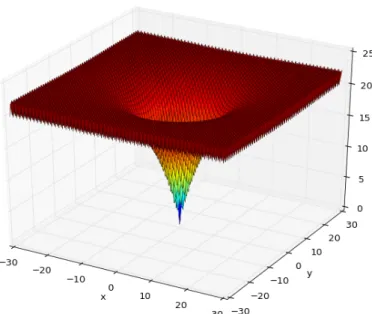
For the BFOA analysis, the resolution was applied to one of the benchmark functions, the Ackley minimization function, Fig. 2,
which has a global optimum, where xi=0 (i=1, 2,..., n), and the optimum value is and the range , is characterized by having many local optimals around the optimum point, and the possibility of maintaining a plateau state in the search for the global minimum.
Figure 2.- Ackley function
Resources.- Using a laptop computer (Pentium(R) dual-core processor at 2.30GHz, 4GB RAM memory) with Windows 7 operating system, the BFOA algorithm was implemented in the Python programming language, based on the basic algorithm proposed by the author of BFOA to evaluate the performance, three runs of the algorithm were applied for each change and/or modification of the parameters of BFOA, for each cycle were run 50 iterations of it. The best of each iteration is selected, and at the end the best overall, according to the literature proposed by the author of BFOA who proposes that the standard parameters are S=50, D=2, Nc=2, Ns=12, C=0.2, and Ped=1.15 as recommended in Kim & Cho (2005) and Yao & Liu (1998). After applying the author’s default parameters, modifications were made to C and Ped, (varying them and checking their effect on the algorithm’s behavior on the benchmark function). Once the cycles of iterations of the BFOA algorithm were executed, the values obtained were evaluated, mini-mum and maximini-mum values obtained, mean of minimini-mum values of each cycle, range, standard deviation, deviation among the three selected.
6.2 Analysis of results
Four tests were performed according to the changes in the parameters indicated in the analysis proposal. For each change in parameters, three iterations were performed: the minimum value of the three iterations was averaged, the standard mean of the minimum values in each itera-tion, the dispersion, and the standard deviation were calculated.
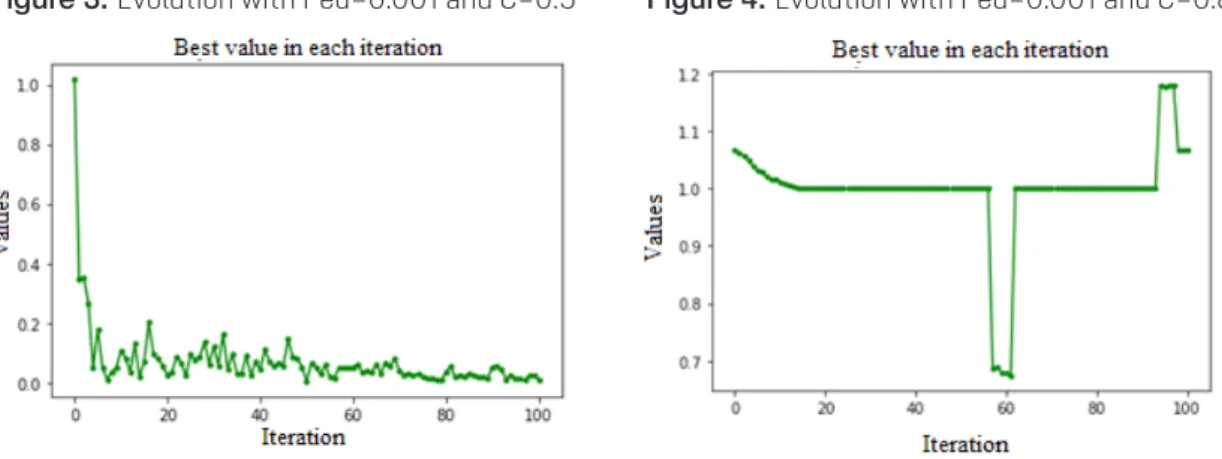
Figure 3. Evolution with Ped=0.001 and C=0.5 Figure 4. Evolution with Ped=0.001 and C=0.8
Ped =0.001, C=0.5, Fig. 3, stagnation was observed at local minima, as well as a cons-tant oscillation of considerable amplitude, varying from minima to maxima quite frequently. Ped=0.001, C=0.8, Fig. 4, shows excessive variation between minimum and maximum values, is unreliable, and several runs are necessary to determine an average value for these values.
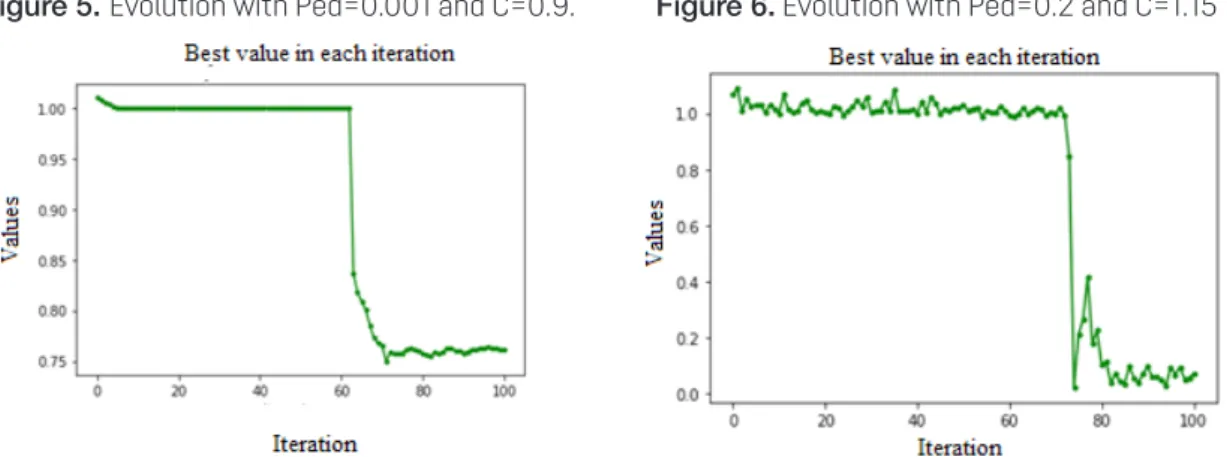
Ped=0.001, C=0.9, Fig. 5, an improvement in convergence towards an acceptable mini-mum was observed, from iteration number 30. Considerably acceptable, however, sometimes there is stagnation in the form of plateau, and after several more iterations, fall to an acceptable overall minimum, and return to maximum values.
Ped=0.001, C=0.95, convergence is established, although plateau is still found between iterations twenty and forty, it is observed that more than one hundred consecutive iterations are needed to continue converging towards an acceptable global minimum.
Ped=0.001, C=1, plateau was observed from iteration ten to 80, in another execution pla-teau was observed in almost all iterations, sometimes reaching acceptable overall minimums but rising back to maximum values, convergence was also observed from iteration five and re-mains at minimum values below between 0 y 0.2.
Ped=0.1, C=1.10, Stagnation is observed from the initial iteration to the sixty, then it con-verges towards the global minimum 0, and it remained oscillating between 0 y 0.1.
Ped=0.001, C=1.10, showed stagnation from iteration twenty to seventy, and then conver-ged towards global minimum before iteration one hundred.
Ped=0.2, C=1.15, Fig. 6, this configuration of the parameters is recommended by K. M. Pas-sino, a constant oscillation is observed, converging towards global minimum after the seventy or eighty iterations, it reaches minimum value zero before the hundredth iteration.
Figure 5. Evolution with Ped=0.001 and C=0.9. Figure 6. Evolution with Ped=0.2 and C=1.15
Ped=0.01, C=1.3, Figure 7, configuration proposed by the authors of this document, based on the observations and behaviour of the algorithm in previous configurations; immediate con-vergence was observed before iteration ten, and it was maintained at local minimums until an acceptable overall optimum minimum was reached.
Figure 7. Evolution with Ped=0.01 and C=1.3
7. Comparison of parameters C (turn size) and Ped (probability of elimination and dispersion)
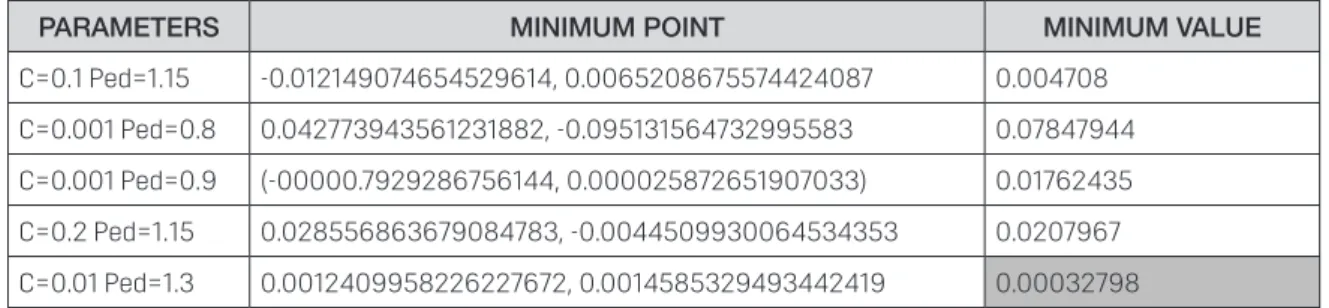
The minimum value obtained for simulated environments is presented in Table 1, which compa-red with (Guang-Yu & Wei-Bo, 2017), (Yıldız & Altun, 2015) (Sharma & Kau, 2015), show that as long as C values are kept below 0.01, the algorithm is less susceptible to stagnation at a local minimum, it is observed that a value of 0.001 is adequate to accelerate the convergence of the algorithm. As for the values for the Ped parameter, it was observed that the values between 2 and 1 help the algorithm to escape from local minimums and stagnations, it was possible to ap-preciate peaks for both directions that reflect that when the algorithm stagnates, the parame-ter manages to take it out easily, although on rare occasions it could be appreciated that being in a global minimum, it can jump towards global maximums, so this value must be established objectively, because when there is no improvement in the solution this parameter makes it jump
towards a random value according to the combination of parameters introduced, this parameter makes it jump towards a random value according to the combination of parameters introduced. With the values of Ped=0.01, C=1.3, an immediate convergence is achieved before iteration ten.
Table 1. Minimum value obtained in simulated environments
PARAMETERS MINIMUM POINT MINIMUM VALUE
C=0.1 Ped=1.15 -0.012149074654529614, 0.0065208675574424087 0.004708 C=0.001 Ped=0.8 0.042773943561231882, -0.095131564732995583 0.07847944 C=0.001 Ped=0.9 (-00000.7929286756144, 0.000025872651907033) 0.01762435 C=0.2 Ped=1.15 0.028556863679084783, -0.0044509930064534353 0.0207967 C=0.01 Ped=1.3 0.0012409958226227672, 0.0014585329493442419 0.00032798
8. Conclusions and future work
In the present work we have experimented with the BFOA (bacteria foraging optimization) algorithm, which is inspired by the behavior of E. coli bacteria, working in a group representing in a basic way how swarm intelligence behaves for the solution of optimization problems, in which optimal values are sought (minimum or maximum) on a specific function determined for real world problems, although it is true, the tests and measurements performed in this document were performed as tests and with a function that belongs to the benchmark group of optimi-zation functions used to measure the effectiveness and development of an optimioptimi-zation algo-rithm, it is correct to apply this algorithm in the search for solutions to real-life problems, the important thing is to establish the objective function, and configure the parameters so that it is necessary to establish to what extent the algorithm can search for a desired solution.
With the analysis of the results of the tests carried out, the authors conclude that the pa-rameters C and Ped play fundamental roles in the behaviour of the agents and the way in which they develop in order to search for local and global optimums. According to what has been ob-served, it is determined that C should be set at values lower than zero in order to have a favou-rable performance when it is stagnating in optimal locations, since it is the one that determines where and how much space it should turn in another direction and thus be able to escape from a local optimum. In the same way, the Ped parameter, which refers to the probability of execu-ting the elimination and dispersion of a bacterium (search agent) when it is stagnant in a local optimum, or does not improve in values compared to its other search partners, this parameter is determined to be set between one and two, according to the need it has in the function to be optimized, this parameter is the one that together with the turning parameter, removes agents that are stagnant in optimal locations, or in plateau situation, removes them from the current position and takes them to new random positions according to the positions of the others, is ba-sic and useful to escape from a very pronounced local optimum, behaves similar to the cooling and heating technique of the simulated annealing algorithm.
With the above it is concluded that the BFO algorithm can compete in effectiveness at the same level as PSO, BFO is recent and there is much to investigate and improve on this al-gorithm, it is possible to approach research and tests on mathematical analysis and how the parameters are related and how they can predict behavior according to the values that can be
configured. At the same time present improvements in the algorithm, variants, and even be able to combine it with other collective intelligence algorithms.
Future studies could consider the application of this algorithm in real case studies, in the optimization of quality of service (QoS) in Manet (Mobile ad hoc network) type networks through routing protocols and consider parameters such as packet delay and minimum power consump-tion within the search algorithm configuraconsump-tion for the best possible route; in addiconsump-tion, the packet relay algorithm could be optimized in Adhoc networks based on collective intelligence (swarm intelligence), thus improving network performance and having low power consumption nodes.
References
Chen, H., Zhu, Y., Hu, K., & He, X. (2010). Hierarchical swarm model: a new approach to optimization.
Dis-crete Dynamics in Nature and Society, 30.
Dorigo, M., Di Caro, G., & Gambardella, L. (1999). Ant algorithms for discrete optimization. Artificial Life, 137–172.
Salleh, M., Hussain, K., Cheng, S., Shi, Y., Muhammad, A., Ullah, G., & Naseem, R. (2018). Exploration and Ex-ploitation Measurement in Swarm-Based Metaheuristic Algorithms: An Empirical Analysis.
Re-cent Advances on Soft Computing and Data Mining, pp 24-32 |.
doi:https://doi.org/10.1007/978-3-319-72550-5_3
Yao, X., & Liu, Y. (1998). Scaling up evolutionary programming algorithms. roceedings of the 7th Annual
Conference on Evolutionary Programming, 103–112.
Biswas, A., Dasgupta, S., Das, S., & Abraham, A. (2007). ynergy of PSO and bacterial foraging optimization— a comparative study on numerical benchmarks. Proceedings of the 2nd International Sympium
on Hybrid Artificial Intelligence Systems (HAIS): Advances Soft Computing, 255–263.
Dorigo, M., Maniezzo, V., & Colorni, A. (1996). Ant system: Optimization by a colony of cooperating agents.
IEEE Transactions on Systems, 29-41.
Eberchart, R., & Kennedy, j. (1995). A new optimizer using particle swarm theory. Proceeding of the 6th
International Symposium on Micromachine and Human Science, 39-43.
Elsisi, M. (2019). Future search algorithm for optimization. Evol. Intel., 12: 21. doi:https://doi.org/10.1007/ s12065-018-0172-2
Feng, X., He, Y., Yang, H., & Juan, Y. (2016). Self-adaptive bacterial foraging optimization algorithm based on evolution strategies. Revista Tecnica de la Facultad de Ingenieria Universidad del Zulia, pp. 350-358. doi:10.21311/001.39.8.43
Floudas, C. (2000). Deterministic Global Optimization Theory, Methods and Applications. Boston: Springer US. Guang-Yu, Z., & Wei-Bo, Z. (2017). Optimal foraging algorithm for global optimization. Applied Soft
Compu-ting Journal, Pages 294-313. doi:http://dx.doi.org/10.1016/j.asoc.2016.11.047
Holland, J. (1975). Adaptation in Natural and Artificial Systems. Michigan: University of Michigan Press. Kim, D., & Cho, J. (2005). Adaptive tuning of PID controller for multivariable system using bacterial
fora-ging based optimization. Proceedings of the 3rd International Atlantic Web Intelligence
Confe-rence on Advances in Web Intelligence, 231-235.
Mahapatra, G., & Banerjee, S. (2015). An object-oriented implementation of bacteria foraging system for data clustering application. International Conference and Workshop on Computing and
Com-munication (IEMCON), pp. 1-7. doi:doi: 10.1109/IEMCON.2015.7344430
Mishra, S. (2005). A hybrid least square-fuzzy bacterial foraging strategy for harmonic estimation. IEEE
Transactions on Evolutionary Computation, 61-73.
Muller, S., Marchetto, J., Airaghi, S., & Ko, P. (2002). Optimization based on bacterial chemotaxis. IEEE
Najarro, R., López, R., Racines, R., & Puris, A. (2017). An Hybrid Genetic Algorithm to Optimization of Flow Shop Scheduling Problems under Real Environments Constraints. Enfoque UTE, 8(5), pp. 14 - 25. doi:https://doi.org/https://doi.org/10.29019/enfoqueute.v8n5.176
Passino, K. M. (2002). Biomimicry of bacterial foraging for distributed optimization and control. IEEE
Con-trol Systems Magazine, 52–67.
Rivero Peña, Y., Novoa Hernández, P., & Fernández Ochoa, Y. (2015). Evolutionary multi-objective optimiza-tion for software development teams building: a way of obtaining quality in the final product.
En-foque UTE, 6(1), pp. 35 - 44. doi:https://doi.org/https://doi.org/10.29019/enfoqueute.v6n1.53
Sharma, A., & Kau, M. (2015). Comparative Analysis of Particle Swarm Optimization and Particle Swarm Optimization with Aging Leader and Challengers towards Benchmark Functions. International
Journal of Computer Applications, 48-53.
Spall, J. C. (2003). Introduction to Stochastic Search and Optimization: Estimation, Simulation, and
Con-trol. New Jersey: Wiley-Interscience.
Tripathy, M., Mishra, S., Lai, L., & Zhan, Q. (2006). Transmission loss reduction based on FACTS and bac-teria foraging algorithm. Proceedings of the 9th International Conference on Parallel Problem
Solving from Nature, 222-231.
Viera Carcache, O., Vinces Llaguno, L., Guerrero Goyes, K., & Marcillo Vera, F. (2017). Applying Ant Colony Optimization to the Problem of Cell Planning in Mobile Telephone System Radio Network.
Enfo-que UTE, 8(2), pp. 56 - 65. doi:https://doi.org/https://doi.org/10.29019/enfoqueute.v8n2.156
Wang, L., Zhao, W., Tian, Y., & Pan, G. (2018). A bare bones bacterial foraging optimization algorithm.
Cog-nitive Systems Research, 52, pp. 301-311. doi:10.1016/j.cogsys.2018.07.022
Yıldız, Y., & Altun, O. (2015). Hybrid achievement oriented computational chemotaxis in bacterial foraging optimization: a comparative study on numerical benchmark. Soft Computing, pp 3647–3663. doi:https://doi.org/10.1007/s00500-015-1687-4
Zhang, Q., Chen, H., Luo, J., & Xu, Y. (2018). Chaos enhanced bacterial foraging optimization for global op-timization. IEEE Access, 6, pp. 64905-64919.
Zhou, C., Yang, Y., & Wang, Y. (2019). DV-Hop localization algorithm based on bacterial foraging optimi-zation for wireless multimedia sensor networks. Multimedia Tools and Applications, pp 4299– 4309. doi:https://doi.org/10.1007/s11042-018-5674-5