User Performance Differences between Graphics Tablet and
Mouse in Graphic Applications: Focus on Controllability and
Accuracy
Hyun-suh Kim
1, Howard Kim
2, Inhwan Yoon
3, Chul-Ho Jung
4and Yong Hwan
Lee
11
Department of Photography, Chung-Ang University, Seoul, Republic of Korea
[email protected]
2
Department of Human ICT Convergence, Sungkyunkwan University, Suwon,
Republic of Korea
[email protected]
3Department of Management of Technology, Sungkyunkwan University, Suwon,
Republic of Korea
4
Department of Business Administration, Mokwon University, Daejeon, Republic
of Korea
Abstract
The performance differences between a graphics tablet and a mouse in graphical applications were comparatively analyzed. To measure the performance, an approach to quantify the controllability and accuracy was taken. The experiment was conducted on 20 volunteers, and the improvement of the skill proficiency of the test subjects was measured during 32 weeks. The benchmark test for the measurement was to remove a target image area from the background using the ‘path’ function in Adobe Photoshop within a set time limit. Keeping consistent the allocated amount of time to become proficient with a device, the results confirmed that, compared to the mouse, the graphics tablet showed a 40% improvement in control performance for operations with complex curves. Notably, for simple operations such as straight lines, no significant differences were observed. These results are expected to provide suggestions on the efficiency and suitability of input devices for professional graphical operations.
Keywords: Computer input device, graphics tablet, digitizer, mouse, visual graphic application, digital image control, user usability
1. Introduction
From an interaction perspective of humans and computers, keyboards and mice have a limiting effect on the free input (autonomy) of the user. On the other hand, touch-based input devices such as graphics tablets touch screens, and touch pads guess the movements of user‟s hands and approximately represent them through a computer. A graphics tablet detects the pen pressure and displays a natural fluid pen stroke. [1] When such graphics tablets are used for operations on visual arts related to graphic applications, they can have positive effects on t he intuitive operations of the user.
After the first Stylator type and RAND type tablet devices were released in the 1950‟s, in 1975, United States inventor G. Samuel Hurst filed a patent for resistive touchscreens [2]. Afterwards, there has been a plethora of research on related computing input technologies such as touch-pad interaction, stylus pen pressure technologies, handwriting recognition, etc. Ramos [3] reported that the pen pressure could contribute to the improvement of the user expression and eff iciency. Hinckley
and Wigdor [4] and Sellen and Harper [5] claimed that stylus input devices enabled direct expression of handwriting or sketching. However, for actual professional graphical operations, there is currently a lack of research on the performa nce differences between a mouse and a graphics tablet in relation to the control ability and accuracy on the results of the graphical operations. Consequently, this research attempts a positive comparative analysis of the performance of a mouse and a graphics tablet. To this end, a longitudinal experimental method was conducted on 20 test subjects for a total of 32 weeks, and the controllability and accuracy for each input device were examined in detail for a graphical operation based on the selection of an edge area of a digital image. The results of this research are expected to provide academic insight and practical contribution for graphical operations by comparing the efficiency of the operation results based on the input device.
2. Literature Review
When using a graphics tablet, the use of a pen (typically called “stylus” or “light pen”) is necessary. A study related to the efficiency and user interaction of user input devices can be broadly approached from two perspectives.
2.1. Pen Computing
Pen computing refers to the use of a stylus or a light pen instead of a keyboard or mouse to control a computer and give input signals. In additional to computers, pen computing can be used with devices such as personal digital assistants (PDAs), smartphones, tablet PCs, etc. Pen computing works in combination with handwriting recognition functions or touchscreens [6-7].
Subrahmonia [8] stated that pen computing (1) had an advantage in the production of multimodal contents, (2) could be implemented as a tool for n ew meeting methods, (3) was useful for programs necessitating the protection of personal information, and (4) was a technology that could be used with languages based on hieroglyphic characters, such as Chinese and Japanese. Santosh [9] took Nepalese characters that were input online and offline using handwriting recognition, and comparatively analyzed them against the shape, size, character stroke sequence, unit language number, etc. of the language original characters to check the corresponding similarities. Annett [10] researched why, despite the fact that pen pressure functions and styli have been introduced for a long time, graphics tablets have not been able to become a mainstream input device. Annett also conducted exploratory research on the limitati ons of the stylus functions (time delay, unintended touch recognition, etc.) and how these limitations could be overcome. Shaowen [11] studied how closely the strokes of a brush could be reproduced by a graphics tablet. He proposed the stylus as a digital input device for fields of art such as the reproduction of the form of brush strokes used in traditional Chinese ink-and-wash painting.
In addition, for the past 45 years, many academic researchers (Accot and Zhai, 2002; Baecker, 1969; Baecker, 1974; Gross and Do, 1996; Guimbretière, Stone, and Winograd, 2001; Kurtenbach and Buxton, 1993; Pederson, McCall, Moran, and Halasz, 1993; Schilit, Golovchinsky, and Price, 1998; Sutherland, 1963; Sutherland, 1966) [3] conducted research on the performance of pen computing and graphics tablets and their efficiency and utility.
2.2. Pen Pressure User Interaction
Considerable research on the differences in pen pressure user interactions has been conducted. Ramos [3] investigated how the pen pressure function was utiliz ed in a graphical user interface. For example, when using a widget that supports the
pen pressure function, the manipulation speed of the program, failure rate, subjective satisfaction, etc. depending on the type of widget was analyzed. Mizobuchi [12] researched whether the visual feedback on the display monitor could influence the pen pressure user interaction, and Yizhong [13] studied whether there was a difference in the abilities to comprehend and apply pen pressure functions that depended on the user preferences or characteristics. Zhou [14] also conducted research examining the correlation between the pen pressure and the slant angle pressure. As such, there has been plenty of research in the field of computer input devices and on graphics tablets; however, the main limitation resides in the fact that most of this research is based on the basic usability of touch -based input devices. To address this shortcoming and approach the research from a more practical point of view, in the present work, the measurements of the efficiency of a graphics tablet and a mouse are based on the execution abilities of graphic applications.
3. Experiment Design
In this experiment, to measure the user performance of a graphics tablet and a mouse, the research was conducted employing a quantitative evaluation. The test comprised a four month period of repetitive operations, where the test subject participated in one-week-interval experiments for the same amount of time under identical test environments. The total experiment took eight months to collect the data from two separately conducted four-month-interval experiments, and the research experiment structure of Liu and Xiangshi [14] was referenced.
3.1. Hardware and Sample Images
The specifications of the hardware used in the experiment were as follows. (1) Graphics tablet: Wacom Intuos Pro PTH 651 with a resolution of 5080 lpi, wireless capacitive pen with a pen tip diameter of about 1.76 mm with 2048 level pen pressure detection and 60 level slant recognition; (2) applicat ion: Adobe Photoshop CC 2014; (3) computer: MacBook Pro Retina; (4) OS: MAC OS X 10.10 Yosemite; (5) display: EIZO ColorEdge CG276w, aspect ratio 16:9, resolution 2560 × 1440 WQHD 1 pixel = 0.233 mm. The samples used for the experiments were high -resolution 4096 × 2160 pixel images taken with a professional grade digital camera. The experiment images were categorized into three simple images of different shapes (round, rectangular, etc.), and three complex shaped images, which showed animals and plants. For the sake of an objective evaluation, all images had a simple white background.
3.2. Participants
Thetest subjects were 20 (10 males and 10 females) photography majors between the ages of 20 and 30 years old. They were all right-handed and proficient in graphical operations with average eyesight. Aside from two test subjects, all test subjects used a mouse in daily operations, and they either had limited or no experience working with graphics tablets.
3.3. Performance Quantification Method
In this experiment, the test subjects were required to alternate between using two devices (a graphics tablet and a mouse). After instructing them to select a specified image area from the background as accurately as possible within a limited period of time, the quality of the operation was analyzed. The tool for the experiment was the „path‟ tool of the representative graphic application Adobe Photoshop, which allows exact selection of the boundary area of an image. The path tool is widely used in
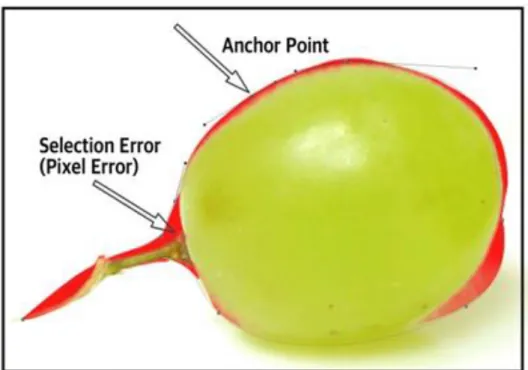
Adobe Photoshop, Adobe Illustration, and other Adobe applications. The path is an information value that records the location in a vector form, and it is used when accurately selecting specific areas in a photo image. The calculation for the area was recorded in pixel units by dividing each image into nine squares and recording the differences in pixel units for each of the nine boxes. Additionally, the number of anchor points created by the test subject for the operations was recorded (Figure 1).
Figure 1. Anchor Point and Selection Error Area
3.4. Experiment Design
A period of 60 min was allocated for the completion of the operations for each device (5 min per simple image × 3 images, 15 min per complex image × 3 images). A rest period of 30 min was given between operations with a new device. The devices were alternated within each session of the experiment. Once the time limit was reached, regardless of the completion status of the task, the next image was displayed. If the operation was completed before the time limit was reached, the time of completion was recorded. The results of the operation were saved and collected in PSD Photoshop file format
3.5. Quantification of Accuracy and Controllability
Based on the PSD file results collected through the experiment, a measurement of the accuracy and controllability was conducted. The difference in the number of pixels between the set B, which was the desired target area, and set A, which was the target area selected by the test subject, was counted to calculate the pixel error rate. (Figure 2) The pixel error rate was used as a measurement yardstick for the evaluation of the accuracy. When a similar rate was reached, the controllability was comparatively analyzed based on the difference in the number of anchor points.
Figure 2. The Pixel Error Rate Calculation Diagram (A: Selected Area, B: Target Area)
4. Results
The test experiment results of the 32 sessions were quantitatively analyzed, and the results were derived, as shown below, for the differences in accuracy and controllability between the mouse and the graphics tablet. Within the experiment results, based on the operation time, it was possible to estimate the performance improvement and efficiency of the user.
4.1. Accuracy
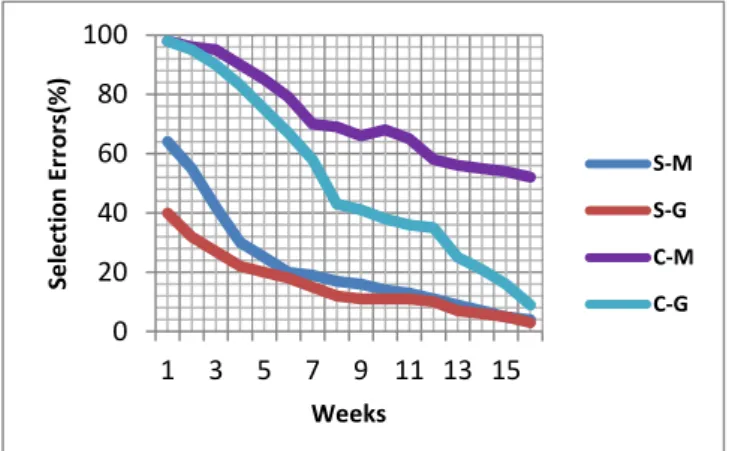
The experiment results of the simple image operations confirmed that there was little difference in accuracy between the two input devices, as the mouse and the graphics tablet recorded similar rates of selection error. Especially for images with mostly straight lines, there was almost no difference between the devices in the accuracy of the target area selection. In the case of complex images with mostly curved lines, the selection error significantly decreased when the test subjects used a graphics tablet, compared to the error recorded when they utilized a mouse. Especially, as the number of weeks into the experiment accumulated, the amount of decrease in selection error increased. After the eighth week of the experiment, the accuracy of the graphics tablet was analyzed, and exhibited an increase of approximately 40% compared to that at the beginning of the experiment (Figure 3).
0 20 40 60 80 100 1 3 5 7 9 11 13 15 Se le cti o n E rr o rs( % ) Weeks S-M S-G C-M C-G
Figure 3. Accuracy Test Chart (S: Simple Image, C: Complicated Image, M: Mouse, G: Graphics Tablet)
4.2. Controllability
In the assessment of the controllability, in the case of operations on simple images, the number of anchor points when using a graphics tablet, compared to that observed when using a mouse, exhibited a half decrease with respect to its value at the beginning of the experiment. However, as the operation experience increased as the experiment progressed, no significant change in the number of anchor points used was noticed. On the other hand, in the case of operations on complex images, the results showed that the number of anchor points significantly decreased as the experience of the test subject increased. This finding demonstrates that the graphics tablet had a higher level of controllability than the mouse for operations with complex images; besides, it was found that the controllability increased with the experience (Figure 4). 0 20 40 60 80 100 1 3 5 7 9 11 13 15 N u mb e r o f A n ch o r Po in ts( % ) Weeks S-M S-G C-M S-G
Figure 4. Controllability Test Chart (S: Simple Image, C: Complicated Image, M: Mouse, G: Graphics Tablet)
4.3. Efficiency
Additional experiments focusing on efficiency confirmed that, in the case of both operations on simple and complex images, the operation time decreased with the increase of the test subject experience. However, in the case of the mouse, even for repeated operations with complex images, once a certai n level of experience was reached, the operation time no longer decreased and remained constant.
5. Conclusion
In this work, the performance differences between two distinct types of computer input devices, i.e., graphics tablets and mice, were analyzed from a controllability and accuracy perspective based on quantitative measurements. To conduct this analysis, the experiment was based on the pixel error rate of the path and the number of anchor points used. Through the data analysis, it was confirmed that, from both a controllability and accuracy perspective, the graphics tablet showed overall higher performance than the mouse. Furthermore, the completion time of the test subjects using a graphics tablet decreased on average by 25% during the course of the experiment. However, in the case of operations with simple images comprising mostly straight lines, the performance of the mouse was not significantly inferior to the performance of the graphics tablet. A considerable amount of previous research is limited to the simple performance evaluation of the input devices, such as their operations on simple shapes, characters, etc. Therefore, the attempt to quantitatively evaluate complex images that require accuracy, as in this experiment, contributes significantly to the development of touch-based input devices. In follow-up research, it is expected that an evaluation of the usability in more high-level graphic application operations, for example the adjustment of brush opacity, flow, etc. will be realized using three-dimensional lighting and shading, and color combination operations.
References
[1] T. T. H. Chen, “A design space for whole-hand flat surface interaction”, Diss. University of British Columbia, (2005).
[2] W. C. Colwell and G. S. Hurst, “Discriminating Contact Sensor”, U.S. Patent 3,911,215 A, October 7,
(1975).
[3] G. A. Ramos, “Pressure-sensitive pen interaction”, Diss. University of Toronto, (2008).
[4] K. Hinckley, D. Wigdor, “Input Technologies and Techniques. In J. Jacko (Ed.), The Human computer interaction Handbook: Fundamentals, Evolving Technologies and Emerging Applications”, Third Edition. CRC Press, (2012), pp. 99-132.
[5] A. Sellen and R. H. R. Harper, “The Myth of the Paperless Office”, MIT Press Cambridge, (2003). [6] “Pen-based computer.” The Columbia Encyclopedia, 6th ed, Encyclopedia.com,
http://www.encyclopedia.com 25 May. 2015, (2014).
[7] K. Hinckley, K. Yatani, M. Pahud, N. Coddington, J. Rodenhouse, A.Wilson, H. Benko and B. Buxton, “Pen + touch = new tools” Proceedings of the 23nd annual ACM symposium on User interface software and technology. ACM, (2010).
[8] J. Subrahmonia and T. Zimmerman, “Pen computing: Challenges and applications”, Pattern Recognition, 2000. Proceedings. 15th International Conference on, IEEE, vol. 2, (2000).
[9] K. C. Santosh and N. Cholwich, “A comprehensive survey on on-line handwriting recognition technology and its real application to the Nepalese natural handwriting”, Kathmandu University Journal of Science, Engineering, and Technology, vol. 5.I, (2009), pp. 31-55.
[10] M. K. Annett, “The Fundamental Issues of Pen-Based interaction with tablet Devices”, Diss. University of Alberta, (2014).
[11] L. Shaowen, “Research on Application of computer Technology in Design and Simulation in Traditional Works of Art”, Advances in Information Sciences & Service Sciences, vol. 5, no. 7, (2013). [12] S. Mizobuchi, S. Terasaki, T. K. Jaskari, J. Nousiainen, M. Ryynanen and M. Silfverberg, “Making an
impression: force-Controlled pen input for handheld devices”, CHI'05 extended abstracts on Human factors in computing systems. ACM, (2005).
[13] X. I. N. Yizhong and R. E. N. Xiangshi, “An investigation of adaptive pen pressure discretization method based on personal pen pressure use profile”, IEICE TRANSACTIONS on Information and Systems, vol. 93, no. 5, (2010), pp. 1205–1213.
[14] X. Zhou, R. Xiangshi and H. Yue, “An empirical comparison of pen pressure and pen tilt input techniques”, Parallel and Distributed Processing with Applications, 2008. ISPA'08. International Symposium on. IEEE, (2008).
[15] C. Liu and R. Xiangshi “Making Pen-Based Operation More Seamless and Continuous”, Human-computer interaction–INTERACT 2009, Springer, Berlin Heidelberg, (2009), pp. 261-273.
[16] H. S. Kim, H. Kim, I. Yoon, C. Jung and Y. Lee, “Comparing Accuracy and Control for Graphics Software using a Digitizer and a Mouse”, Advanced Science and Technology Letters vol. 87, (2015), pp.16-19.
Authors
Hyun-suh Kim, received the MPS degree in Department of
Digital Photography from School of Visual Arts, New York, U.S.A, in 2012. Currently, she is a PhD candidate in Department of Photography at Chung-Ang University, Korea. Her research interest is theperformance of graphics hardware and software application, digital color management, interactions between digital displays and digital photography. She teaches subject in digital photography post production in undergraduate program of Chung-Ang University. She works at Color Technology Laboratory as a senior researcher.
Howard Kim, is an Adjunct Professor in the Department of
Human ICT Convergence at Sungkyunkwan University and the Department of Colorist at YongIn Songdam College, Republic of Korea. He is a Chief at Color Technology Laboratory. He received the BBA and MBA in Department of Business Administration from Sungkyunkwan University. He is a PhD candidate in Department of Management of Technology at Sungkyunkwan University. He teaches subjects in digital color management, digital imaging and perceptual computing. He has more than thirteen years of experience in digital color management industry as a regional representative of multinational corporation.
Inhwan Yoon, is a Lecturer in the Department of Business
Administration at Mokwon University, Korea. He is a PhD candidate in Department of Management of Technology at Sungkyunkwan University, Korea. He teaches subjects in statistics, research methods and organizational theory. He has more than ten years of experience in business planning and development at an engineering company. His research interests are business model innovation, innovation management and organizational performance measurement.
Chul-Ho Jung, is a Professor in the Department of Business
Administration at Mokwon University. He received his PhD in Business Administration at Chungnam National University, Korea. He has published numerous and different articles, including Behaviour & Information Technology, Communications in Computer and Information Science, International Journal of Contents, Journal of Information Technology Applications & Management and so on. His current research interests include entrepreneurship, service operations management, information strategy planning, and performance evaluation and post-adoption model of IT/IS.
Yong Hwan Lee, is Professor of Photography at Chung-Ang
University in Seoul, South Korea‟s most prominent school for photography. His studies included BA and MA degrees in Photography from Chung-Ang University, an MA in Video from the Graduate School of Mass Communication also at Chung-Ang University and an MA in Multi-media and Visual Communication from Ohio University. Lee exhibits widely throughout Korea and abroad and is a key player in the South Korean photography community.