UC San Diego
UC San Diego Electronic Theses and Dissertations
TitleSingle Cell Analysis of Chromatin Accessibility Permalink https://escholarship.org/uc/item/4926j7s2 Author FANG, RONGXIN Publication Date 2019 Peer reviewed|Thesis/dissertation
eScholarship.org Powered by the California Digital Library University of California
UNIVERSITY OF CALIFORNIA SAN DIEGO
Single Cell Analysis of Chromatin Accessibility
A dissertation submitted in partial satisfaction of the requirements for the degree Doctor of Philosophy
in
Bioinformatics and Systems Biology
by
Rongxin Fang
Committee in charge:
Professor Bing Ren, Chair
Professor Vineet Bafna, Co-Chair Professor Joseph R. Ecker
Professor Christopher K. Glass Professor Eran A. Mukamel Professor Kun Zhang
Copyright
Rongxin Fang, 2019
iii
The Dissertation of Rongxin Fang is approved, and it is acceptable in quality and form for publication on microfilm and electronically:
______________________________________________________________ ______________________________________________________________ ______________________________________________________________ ______________________________________________________________ ______________________________________________________________ Co-Chair ______________________________________________________________ Chair
University of California San Diego 2019
iv
DEDICATION
I would like to dedicate this thesis to my family, especially my mom and dad who
supported my scientific endeavors unconditionally throughout my life. And to my girlfriend
v
TABLE OF CONTENTS
SIGNATURE PAGE……….… iii
DEDICATION ... iv
TABLE OF CONTENTS ... v
LIST OF FIGURES ... viii
ACKNOWLEDGMENTS ... xiii
VITA ... xvi
ABSTRACT OF THE DISSERTATION ... xviii
INTRODUCTION ... 1
References ... 7
CHAPTER 1: SINGLE-NUCLEUS ANALYSIS OF ACCESSBILE CHROMATIN IN DEVELOPING MOUSE FOREBRAIN ... 12
1.1 Abstract ... 12 1.2 Introduction ... 13 1.3 Results ... 14 1.4 Discussion ... 25 1.5 Acknowledgments ... 27 1.6 Author Contributions ... 27 1.7 Figures ... 29 1.8 Supplementary Methods ... 34 1.9 Supplementary Figures ... 48 1.11 References ... 66
CHAPTER 2: COMPREHENSIVE ANALYSIS OF SINGLE CELL ATAC-SEQ DATA .. 74
2.1 Abstract ... 74
vi 2.3 Results ... 79 2.4 Discussion ... 93 2.5 Acknowledgments ... 96 2.6 Author Contributions ... 96 2.7 Figures ... 97 2.8 Supplementary Methods ... 105 2.9 Supplementary Figures ... 134 2.10 References ... 174
CHAPTER 3: MAPPING OF LONG-RANGE CHROMATIN INTERACTIONS BY PROXIMITY LIGATION-BASED CHIP-SEQ ... 178
3.1 Abstract ... 178 3.2 Introduction ... 179 3.3 Results ... 180 3.4 Acknowledgments ... 184 3.5 Author Contributions ... 184 3.6 Figures ... 185 3.7 Supplementary Methods ... 187 3.8 Supplementary Figures ... 191 3.9 References ... 195
CHAPTER 4: A TILING-DELETION BASED GENETIC SCREEN FOR CIS-REGULATORY ELEMENT IDENTIFICATION IN MAMMALIAM CELLS ... 197
4.1 Abstract ... 197 4.2 Introduction ... 198 4.3 Results ... 200 4.4 Discussion ... 209 4.5 Acknowledgements ... 211 4.6 Author Contributions ... 211 4.7 Figures ... 212
vii
4.8 Supplementary Methods ... 217 4.9 Supplementary Figures ... 229 4.10 References ... 246
viii
LIST OF FIGURES
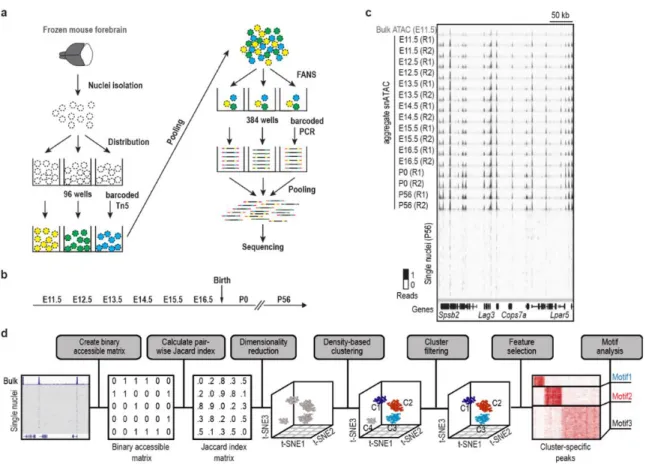
Figure 1.1. Overview of the experimental and computational procedures of snATAC-seq ... 29
Figure 1.2. Deconvolution of cell types in the p56 mouse forebrain and identification of potential master regulators of each cell type ... 30
Figure 1.3. SnATAC-seq analysis reveals the timing of neurogenesis and gliogenesis during embryonic forebrain development ... 32
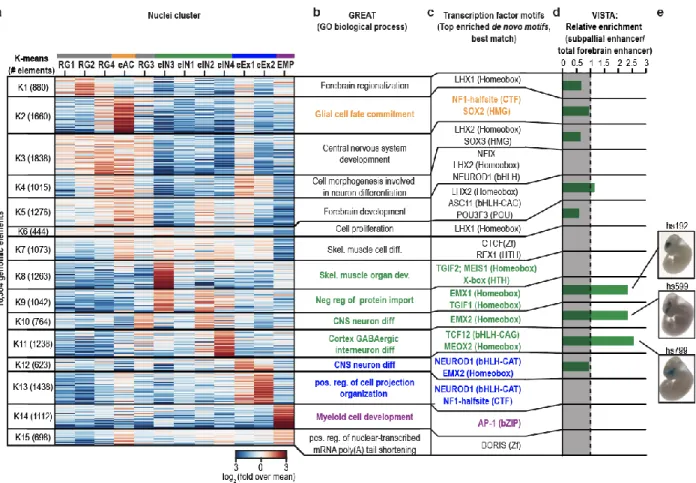
Figure 1.4. SnATAC-seq analysis uncovers cis regulatory elements and transcriptional regulators of lineage specification in the developing forebrain ... 33
Figure S1.1. SnATAC-seq protocol optimization ... 48
Figure S1.2. Isolation of single nuclei after tagmentation ... 50
Figure S1.3. Overview of snATAC-seq sequencing data and quality filtering for single nuclei ... 51
Figure S1.4. SnATAC-seq data sets are robust and reproducible ... 53
Figure S1.5. Clustering strategies, quality control of clusters and clustering result for individual experiments in adult forebrain ... 55
Figure S1.6. Ranking of gene loci (TSS ± 10kb) compared to other clusters in adult forebrain ... 57
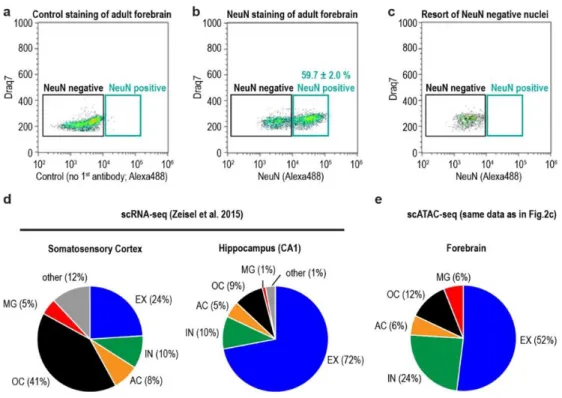
Figure S1.7: Flow cytometric analysis of adult mouse forebrain and comparison to single cell RNA-seq data from different brain regions ... 58
Figure S1.8. Sub-classification of excitatory neurons into hippocampal and cortical neuron types... 59
Figure S1.9. Cell-type specificity and coverage of the cis elements ... 60
Figure S1.10. Distinct chromatin accessibility profiles of two GABAergic neuron clusters ... 61
ix
Figure S1.11. Comparison of chromatin accessibility and differentially methylated regions
in neuronal subtypes ... 62
Figure S1.12. Dynamics of chromatin accessibility within distinct cell groups ... 63
Figure S1.13. Distal genomic element clusters are associated with distinct anatomical locations in the developing forebrain ... 65
Figure 2.1. Schematic overview of SnapATAC analysis workflow... 97
Figure 2.2. SnapATAC links distal regulatory elements to putative target genes ... 98
Figure 2.3. SnapATAC constructs cellular trajectories for the developing mouse brain ... 100
Figure 2.4. SnapATAC outperforms current methods in accuracy, sensitivity, scalability and stability of identifying cell types in complex tissues... 101
Figure 2.5. A high-resolution cis-regulatory atlas of mouse secondary motor cortex (MOs) ... 102
Figure 2.6. SnapATAC enables supervised annotation of new scATAC-seq dataset using reference cell atlas ... 104
Figure S2.1. Overview of SnapTools workflow ... 134
Figure S2.2. SnapATAC removes putative doublets using Scrublet ... 135
Figure S2.3. Choosing the optimal bin size ... 136
Figure S2.4. SnapATAC is robust to sequencing depth... 138
Figure S2.5. SnapATAC is robust to other biases... 139
Figure S2.6. Nyström sampling improves the scalability without sacrificing the performance ... 140
Figure S2.7. SnapATAC delineates cellular heterogeneity in published large-scale scATAC-seq datasets ... 142
Figure S2.8. SnapATAC predicts gene and enhancer pairing by integrating scATAC-seq and scRNA-seq... 144
x
Figure S2.9. SnapATAC constructs cellular trajectories for the developing mouse brain
... 145
Figure S2.10. Evaluation of clustering accuracy of SnapATAC relative to alternative methods on simulated datasets ... 146
Figure S2.11. Evaluation of clustering accuracy on published single cell ATAC-seq datasets ... 148
Figure S2.12. Gene accessibility score of canonical marker genes projected onto t-SNE embedding of mouse secondary motor cortex (MOs-M1) snATAC-seq dataset to guide the cluster annotation ... 149
Figure S2.13. Evaluation of clustering sensitivity on in-house mouse secondary motor cortex dataset ... 151
Figure S2.14. Gene accessibility score of canonical marker genes projected onto t-SNE embedding for a 10X scATAC-seq dataset of the mouse brain to guide the cluster annotation ... 152
Figure S2.15. Evaluation of clustering sensitivity on a 10X scATAC-seq dataset from the Mouse Brain ... 154
Figure S2.16. Gene accessibility score of canonical marker genes projected onto the t-SNE embedding from 5K PBMC 10X dataset to guide the annotation of the clusters. 155 Figure S2.17. Evaluation of clustering sensitivity on a 5K PBMC 10X dataset ... 156
Figure S2.18. Off-peak reads can be used to distinguish different cell types ... 157
Figure S2.19. Off-peak reads reflect higher-order chromatin structure ... 158
Figure S2.20. SnapATAC is robust to technical variation ... 159
Figure S2.21. SnapATAC eliminates batch effect using Harmony ... 160
Figure S2.22. Single nucleus ATAC-seq datasets are reproducible between biological replicates ... 161
Figure S2.23. Barcode selection of MOs ... 163
xi
Figure S2.25. MOs clustering result is reproducible between biological replicates ... 165
Figure S2.26. Gene accessibility score of canonical marker genes projected onto MOs t-SNE embedding to guide the cluster annotation ... 166
Figure S2.27. Iterative clustering identifies 17 GABAergic neuronal subtypes ... 167
Figure S2.28. Gene accessibility score of marker genes projected onto t-SNE embedding from GABAergic neurons to guide the cluster annotation ... 168
Figure S2.29. SnapATAC uncovers novel candidate cis-regulatory elements in rare cell types... 170 Figure S2.30. Joint diffusion maps embedding for query (Mouse Brain 10X) and reference dataset (MOs snATAC) ... 171
Figure S2.31. SnapATAC is robust for supervised annotation of datasets containing cell types missing in the reference atlas... 172
Figure S2.32. Iterative clustering does not substantially improve the clustering sensitivity ... 173
Figure 3.1. PLAC-seq reveals chromatin interactions in mammalian cells at high sensitivity and accuracy ... 185
Figure S3.1. Development and validation of PLAC-seq ... 191
Figure S3.2. Comparison of chromatin interactions detected by 4C-seq, PLAC-seq, and ChIA-PET at three genomic loci ... 193
Figure 4.1. CREST-seq experimental design and application to the POU5F1 locus in hESC ... 212
Figure 4.2. CREs tend to be associated with canonical active chromatin markers of cis-regulatory elements and dense TF clusters ... 214
Figure 4.3. The core promoter regions of MSH5, NEU1, and PRRC2A are required for optimal POU5F1 expression in hESC ... 215
Figure 4.4. Analysis of chromatin interactions between the enhancer-like promoters and POU5F1 promoter in hESC ... 216
xii
Figure S4.1. Design of sgRNA pairs ... 229
Figure S4.2 CREST-seq library construction and quality control ... 230
Figure S4.3. Quality control of CREST-seq data from replicates ... 231
Figure S4.4. CREST-seq identifies the promoter and known enhancers of POU5F1 . 232
Figure S4.5. Chromatin features enriched on CREs ... 233
Figure S4.6. Genotype information for the mutant clones with genomic deletion on selected CREs ... 234
Figure S4.7. Genotype information for core promoter mutant clones... 236 Figure S4.8. Characterization and quantification of eGFP levels in multiple core promoter deletion mutant clones ... 238
Figure S4.9. Quantification of POU5F1, MSH5, NEU1 and PRRC2A expression in various samples ... 240
Figure S4.10. The reduced eGFP expression in bi-allelic or P1 allelic specific mutants is not due to DSB induced transcription repression ... 241
Figure S4.11. Promoter-CREs are associated with active gene expression ... 242
Figure S4.12. List of features that distinguish POU5F1 regulatory promoters from other non-POU5F1-regulatory promoters ... 243
Figure S4.13. Analysis of Cis- and Trans-regulatory elements with dual sgRNA tiling deletion screen ... 244
xiii
ACKNOWLEDGMENTS
First, I am deeply thankful to my PhD advisor, Prof. Bing Ren, for his support and
guidance during my Ph.D. Bing has not only welcomed me to the lab but also taught me
how to be a rigorous, creative and ambitious scientist. Second, I would like to express my
sincere gratitude to my committee members Prof. Joseph R. Ecker, Prof. Vineet Bafna,
Prof. Kun Zhang, Prof. Christopher K. Glass and Prof. Eran A. Mukamel for their insightful
advice for my projects and continuous support for my career development. Next, I would
also like to thank all the members of the Ren lab, from whom I always have unlimited
support. Last but not the least, I would like to thank my family for unconditional support
throughout my life.
The Introduction is, in part, based on the material currently being prepared for submission as “Comprehensive Analysis of Single Cell ATAC-seq Data”. Rongxin Fang,
Sebastian Preissl, Yang Li, Xiaomeng Hou, Jacinta Lucero, Xinxin Wang, Amir Motamedi,
Andrew K. Shiau, Kai Zhang, Fangming Xie, Eran A. Mukamel, Yanxiao Zhang, M.
Margarita Behrens, Joseph Ecker, and Bing Ren. The Introduction is also, in part, based
on material as it appears as "Single-nucleus analysis of accessible chromatin in
developing mouse forebrain reveals cell-type-specific transcriptional regulation" in Nature
Neurosciences, 2018. Sebastian Preissl, Rongxin Fang, Hui Huang, Yuan Zhao, Ramya
Raviram, David U Gorkin, Yanxiao Zhang, Brandon C Sos, Veena Afzal, Diane E Dickel,
Samantha Kuan, Axel Visel, Len A Pennacchio, Kun Zhang, Bing Ren. The Introduction
is also, in part, based on the material as it may appear in Cell Research, 2017. “Mapping
xiv
Fang, Miao Yu, Guoqiang Li, Sora Chee, Tristin Liu, Anthony D Schmitt and Bing Ren.
The Introduction is also, in part, based on the material as it may appear in Nature
Methods, 2016. “A tiling-deletion-based genetic screen for cis-regulatory element
identification in mammalian cells”. Yarui Diao, Rongxin Fang, Bin Li, Zhipeng Meng,
Juntao Yu, Yunjiang Qiu, Kimberly C Lin, Hui Huang, Tristin Liu, Ryan J Marina, Inkyung
Jung, Yin Shen, Kun-Liang Guan and Bing Ren. The dissertation author was the primary
investigator and author of these papers.
Chapter 1, in full, is a reformatted reprint of the material as it appears
“Single-nucleus analysis of accessible chromatin in developing mouse forebrain reveals cell-type-specific transcriptional regulation” in Nature Neuroscience, 2018. Sebastian Preissl,
Rongxin Fang, Hui Huang, Yuan Zhao, Ramya Raviram, David U Gorkin, Yanxiao Zhang,
Brandon C Sos, Veena Afzal, Diane E Dickel, Samantha Kuan, Axel Visel, Len A
Pennacchio, Kun Zhang, Bing Ren. The dissertation author was a co-primary investigator
and author of this paper.
Chapter 2, in full, is currently being prepared for submission of the material as “Comprehensive Analysis of Single Cell ATAC-seq Data”. Rongxin Fang, Sebastian
Preissl, Yang Li, Xiaomeng Hou, Jacinta Lucero, Xinxin Wang, Amir Motamedi, Andrew
K. Shiau, Kai Zhang, Fangming Xie, Eran A. Mukamel, Yanxiao Zhang, M. Margarita
Behrens, Joseph Ecker, and Bing Ren. The dissertation author was the primary
xv
Chapter 3, in full, is a reformatted reprint of the material as it appears as "Mapping
of long-range chromatin interactions by proximity ligation-assisted ChIP-seq" in Cell
Research, 2016. Rongxin Fang, Miao Yu, Guoqiang Li, Sora Chee, Tristin Liu, Anthony
D Schmitt & Bing Ren. The dissertation author was the primary investigator and author of
this paper.
Chapter 4, in full, is a reformatted reprint of the material as it appears as " A
tiling-deletion-based genetic screen for cis-regulatory element identification in mammalian
cells" in Nature Methods, 2017. Yarui Diao, Rongxin Fang, Bin Li, Zhipeng Meng, Juntao
Yu, Yunjiang Qiu, Kimberly C Lin, Hui Huang, Tristin Liu, Ryan J Marina, Inkyung Jung,
Yin Shen, Kun-Liang Guan & Bing Ren. The dissertation author was the primary
xvi
VITA
2012 Bachelor of Engineering, Yantai University
2013 Research Assistant, Chinese Academy of Sciences
2014 Research Assistant, Duke University
2019 Doctor of Philosophy, University of California, San Diego
PUBLICATIONS
Rongxin Fang, Sebastian Preissl, Xiaomeng Hou, Jacinta Lucero, Xinxin Wang, Amir Motamedi, Andrew K. Shiau, Eran A. Mukamel, Yanxiao Zhang, M. Margarita Behrens, Joseph Ecker, Bing Ren. “Comprehensive Analysis of Single Cell ATAC-seq Data” (in preparation).
Sebastian Preissl*, Rongxin Fang*, Hui Huang, Yuan Zhao, Ramya Raviram, David U. Gorkin, Yanxiao Zhang, Brandon C. Sos, Veena Afzal, Diane E. Dickel, Samantha Kuan, Axel Visel, Len A. Pennacchio, Kun Zhang & Bing Ren. “Single-nucleus analysis of accessible chromatin in developing mouse forebrain reveals cell-type-specific transcriptional regulation”. Nature Neurosciences. 21(3):432-439 (2018).
Yarui Diao*, Rongxin Fang*, Bin LI*, Zhipeng Meng, Juntao Yu, Yunjiang Qiu, Kimberly C Lin, Hui Huang, Tristin Liu, Ryan J Marina, Inkyung Jung, Yin Shen, Kun-Liang Guan & Bing Ren. “A tiling-deletion-based genetic screen for cis-regulatory element identification in mammalian cells”. Nature Methods. 14(6):629-635 (2017).
Rongxin Fang*, Miao Yu*, Guoqiang Li, Sora Chee, Tristin Liu, Anthony D Schmitt & Bing Ren. “Mapping of long-range chromatin interactions by proximity ligation-assisted ChIP-seq”. Cell Research. 26(12):1345-1348 (2016).
Rongxin Fang*, Chengqi Wang*, Geir Skogerbo and Zhihua Zhang. “Functional diversity
of CTCF is encoded in binding motifs”. BMC Genomics. 28;16:649 (2015).
Guoqiang Li*, Yaping Liu*, Yanxiao Zhang, Naoki Kubo, Miao Yu, Rongxin Fang, Manolis Kellis, Bing Ren. “Simultaneous profiling of DNA methylation and chromatin architecture in mixed populations and in single cells”. Nature Methods (2019).
Yanxiao Zhang*, Ting Li*, Sebastian Preissl*, Jonathan Grinstein, Elie Farah, Eugin Destici, Ah Young Lee, Sora Chee, Yunjiang Qiu, Kaiyue Ma, Zhen Ye, Quan Zhu, Hui Huang, Rong Hu, Rongxin Fang, Leqian Yu, Juan Carlos Belmonte, Jun Wu, Sylvia Evans, Neil Chi, Bing Ren. “Transcriptionally active HERV-H retrotransposons demarcate
xvii
topologically associating domains in human pluripotent stem cells”. Nature Genetics. 51(9):1380-1388 (2019).
Ivan Juric*, Miao Yu*, Armen Abnousi*, Ramya Raviram, Rongxin Fang, Yuan Zhao, Yanxiao Zhang, Yuchen Yang, Yun Li, Bing Ren, Ming Hu. “MAPS: model-based analysis of long-range chromatin interactions from PLAC-seq and HiChIP experiments”. PLOS Computational Biology. 15;15(4):e1006982 (2019).
Qingfei Jiang, Jane Isquith, Maria Anna Zipeto, Raymond H Diep, Jessica Pham, Nathan Delos Santos, Eduardo Reynoso, Julisia Chau, Heather Leu, Elisa Lazzari, Etienne Melese, Wenxue Ma, Rongxin Fang, Sheldon Morris, Bing Ren, Gabriel Pineda, Frida Holm, Catriona Jamieson. “Hyper-Editing of Cell-Cycle Regulatory and Tumor Suppressor RNA Promotes Malignant Progenitor Propagation”. Cancer Cell. 35(1):81-94.e7 (2018).
Verena M Link*, Sascha H Duttke*, Hyun B Chun*, Inge R Holtman, Emma Westin, Marten A Hoeksema, Yohei Abe, Dylan Skola, Casey E Romanoski, Jenhan Tao, Gregory J Fonseca, Ty D Troutman, Nathanael J Spann, Tobias Strid, Mashito Sakai, Miao Yu, Rong Hu, Rongxin Fang, Dirk Metzler, Bing Ren, Christopher K Glass. “Analysis of Genetically Diverse Macrophages Reveals Local and Domain-wide Mechanisms that Control Transcription Factor Binding and Function”. Cell. 173(7):1796-1809.e17 (2018).
Yupeng He, Manoj Hariharan, David U Gorkin, Diane E Dickel, Chongyuan Luo, Rosa G Castanon, Joseph R Nery, Ah Young Lee, Brian A Williams, Diane Trout, Henry Amrhein,
Rongxin Fang, Huaming Chen, Bin Li, Axel Visel, Len A Pennacchio, Bing Ren, Joseph R Ecker. “Spatiotemporal DNA methylome dynamics of the developing mammalian fetus”.
BioRxiv (2019).
Joshua Chiou*, Chun Zeng*, Zhang Cheng, Jee Yun Han, Michael Schlichting, Serina Huang, Jinzhao Wang, Yinghui Sui, Allison Deogaygay, Mei-Lin Okino, Yunjiang Qiu, Ying Sun, Parul Kudtarkar, Rongxin Fang, Sebastian Preissl, Maike Sander, David Gorkin, Kyle J Gaulton. “Single cell chromatin accessibility reveals pancreatic islet cell type- and state-specific regulatory programs of diabetes risk”. BioRxiv (2019).
xviii
ABSTRACT OF THE DISSERTATION
Single Cell Analysis of Chromatin Accessibility
by
Rongxin Fang
Doctor of Philosophy in Bioinformatics and Systems Biology
University of California San Diego, 2019
Professor Bing Ren, Chair Professor Vineet Bafna, Co-Chair
The identity of each cell in the human body is established and maintained through
distinct gene expression program, which is regulated in part by the chromatin
xix
largely upon bulk measurements in populations of cells. Recent advances in the
sequencing techniques have allowed for the identification of open chromatin regions in
single cells. During my Ph.D., I have developed and used single cell sequencing
techniques to study the diverse gene regulatory programs underlie the different cell types
in mammalian complex tissues. In chapter 1, colleague and I developed Single Nucleus
Assay of Transpose Accessible Chromatin using Sequencing (snATAC-seq), a
combinatorial barcoding-assisted single-cell assay for probing accessible chromatin in
single cells. We then used snATAC-seq to generate an epigenomic atlas of early
developing mouse brain. The high-level noise of each single cell chromatin accessibility
profile and the large volume of the datasets pose unique computational challenges. In
chapter 2, I developed a comprehensive bioinformatics software package called
SnapATAC for analyzing large-scale single cell ATAC-seq dataset. SnapATAC resolves
the heterogeneity in complex tissues and maps the trajectories of cellular states. As a
demonstration of its utility, SnapATAC was applied to 55,592 single-nucleus ATAC-seq
profiles from the mouse secondary motor cortex. To further determine the target genes
of the distal regulatory elements identified using snATAC-seq in different cell types, in
chapter 3, colleague and I developed PLAC-seq, a cost-efficient method that identifies
the long-range chromatin interaction at kilobase resolution. PLAC-seq improves the
efficiency of detecting chromatin conformation by over 10-fold and reduces the input
requirement by nearly 100-fold compared to the prior techniques. Finally, to probe the in
vivo function of the regulatory sequences, I present a high-throughput CRISPR screening
method (CREST-seq) for the unbiased discovery and functional assessment of enhancer
xx
human embryonic stem cells and discovered that sequences previously annotated as
promoters of functionally unrelated genes can regulate the expression of POU5F1 from
a long distance. We anticipate that these studies will help us understand the gene
regulatory programs across diverse biological systems ranging from human disease to
1
INTRODUCTION
Nearly two decades have passed since the human genome was first completely
sequenced1,2, yet the function of its roughly 3 billion nucleotides is still largely unknown.
Decoding the human genome, especially the non-protein coding portion that harbors most
of the sequence variants underlying the common human diseases, requires the
knowledge of the promoters, enhancers, insulators and other regulatory elements3.
Therefore, comprehensive mapping of the cis-regulatory sequences across diverse
tissues and cell types in the human body is critical to understand the role of gene
regulation in cell function and in human disease.
Since the cis-regulatory sequences are often marked by hypersensitivity to
nucleases or transposases when they are active or poised to act, approaches to detect
DNA accessibility, such as ATAC-seq (Assay for Transposase-Accessible Chromatin
using sequencing)4 and DNase-seq (DNase I hypersensitive sites sequencing)5 have
been widely used to map the candidate cis-regulatory sequences. However, conventional
assays that use bulk tissue samples as input cannot resolve cell type specific usage of
cis elements and lacks the resolution to study the temporal dynamics. To overcome this
challenge, several single cell sequencing techniques have been developed to profile the
chromatin accessibility in single cells. For instance, one approach relies on isolation of
cell using microfluidic devices (Fluidigm, C1)6. Another type of approach involves
combinatorial indexing to simultaneously analyze tens of thousands of cells7. However,
to make these single cell analyses more widely applicable, it is necessary to optimize
2
In Chapter 1, colleague and I show that it is possible to isolate single nuclei from
frozen tissues and assay chromatin accessibility in these nuclei in a massively parallel
manner. We further apply this technique on the mouse forebrain through eight
developmental stages, creating the first single cell epigenomic atlas of developing mouse
brain.
Despite the recent advances in single cell ATAC-seq techniques, the exceeding
sparsity of signals in each individual profile due to low detection efficiency (5-15% of
peaks detected per cell)7 and the growing volumes of the datasets present a unique
computational challenge. To address this challenge, a number of unsupervised
algorithms have been developed. For instance, one approach, chromVAR8, groups
similar cells together by dissecting the variability of transcription factor (TF) motif
occurrence in the open chromatin regions in each cell. Another type of approach employs
the natural language processing techniques such as Latent Semantic Analysis (LSA)9
and Latent Dirichlet Allocation (LDA)10 to group cells together based on the similarity of
chromatin accessibility. A third approach analyzes the variability of chromatin accessibility
in cells based on the k-mer composition of the sequencing reads from each cell11,12. A
fourth approach, Cicero13, infers cell-to-cell similarities based on the gene activity scores
predicted from their putative regulatory elements in each cell.
However, several limitations still apply to these methods. First, the current analysis
3
analysis (PCA) or singular value decomposition (SVD) on a cell matrix of hundreds of
thousands of dimensions, scaling the analysis to millions of cells remains very challenging
or nearly impossible. Second, the unsupervised identification of cell types or states in
complex tissues using scATAC-seq dataset does not match the power of scRNA-seq14.
One possibility is that the current methods rely on the use of pre-defined accessibility
peaks based on the aggregate signals that potentially introduces bias to the cell type
identification.
In Chapter 2, I will introduce a software package called Single Nucleus Analysis
Pipeline for ATAC-seq (SnapATAC). Unlike previous methods, SnapATAC does not
require population-level peak annotation prior to clustering. Instead, it resolves cellular
heterogeneity by directly comparing the genome-wide accessibility profiles between cells
with the use of the diffusion maps algorithm15,16, which is highly robust to noise and
perturbation. Furthermore, with the use of a sampling technique, Nyström method17,17,18,
SnapATAC improves the computational efficiency and enables the analysis of
scATAC-seq from a million cells on regular hardware. Additionally, SnapATAC provides a
collection of frequently used features, including integration of scATAC-seq and
scRNA-seq dataset, prediction of enhancer-promoter interaction, discovery of key transcription
factors, identification of differentially accessible elements, construction of trajectories
during cellular differentiation, correction of batch effect and classification of new dataset
based on existing cell atlas. Through extensive benchmarking using both simulated and
empirical datasets from diverse tissues and species, we show that SnapATAC
4
reproducibility for cell type identification from complex tissues. Furthermore, we
demonstrate the utility of SnapATAC by building a high-resolution single cell atlas of the
mouse secondary motor cortex. This atlas comprises of ~370,000 candidate cis
-regulatory elements in 31 distinct cell types, including rare neuronal cell types that
account for less than 0.1% of the total population analyzed. Through motif enrichment
analysis, we further infer potential key transcriptional regulators that control cell type
specific gene expression programs in the mouse brain.
Formation of long-range chromatin loops is a crucial step in transcriptional
activation of target genes by distal enhancers19. Mapping such structural features can
help define target genes for enhancers and annotate non-coding sequence variants linked
to human diseases19–21. Study of the higher-order chromatin organization has been
facilitated by the development of chromosome conformation capture (3C)-based
technologies22,23. Among the commonly used high-throughput 3C approaches are Hi-C24
and chromatin interaction analysis by paired-end tag sequencing (ChIA-PET)25. Global
analysis of long-range chromatin interactions using Hi-C has been achieved at kilobase
resolution but requires billions of sequencing reads26. High-resolution analysis of
long-range chromatin interactions at selected genomic regions can be attained cost-effectively
through ChIA-PET25,27. However, ChIA-PET requires hundreds of million cells as starting
materials, limiting its application to biological problems with limited materials.
In chapter 3, college and I developed Proximity Ligation-Assisted ChIP-seq
5
of the assay. Unlike ChIA-PET, PLAC-seq conducts proximity ligation in nuclei prior to
chromatin shearing and immunoprecipitation. As a result, we demonstrated that,
compared to ChIA-PET, PLAC-seq greatly improves the efficiency of detecting the
long-range chromatin conformation reads and significantly lowers the input materials.
Despite that millions of candidate cis-regulatory sequences have been annotated
in the human genome on the basis of biochemical signatures such as histone
modification, transcription factor (TF) binding, and chromatin accessibility3,28–32, only a
handful of these candidate elements have been functionally validated in the native genomic context. High-throughput CRISPR–Cas9-mediated mutagenesis by single guide
RNAs (sgRNAs) has been used to functionally characterize cis-regulatory elements in
mammalian cells33–37. However, current approaches are limited because (1) not all sequences are suitable for CRISPR–Cas9-mediated genome editing, owing to the lack of
protospacer-adjacent motifs (PAMs), which are required for targeting and DNA cutting by CRISPR–Cas938–40; (2) CRISPR–Cas9-mediated genome editing with individual sgRNAs
tends to cause point mutations or short insertions or deletions, thus necessitating the use
of an unrealistically large number of sgRNAs to interrogate the human genome; and (3)
it has been challenging to distinguish cis- and trans-regulatory elements.
In chapter 4, colleagues and I developed CREST-seq that allows the efficient
discovery and functional characterization of the regulatory elements through the
introduction of massively parallel kilobase-long deletions in the genome. We provide
-6
regulatory elements in human embryonic stem cells (hESCs). We report the discovery of
45 regulatory sequences of POU5F1, and a surprisingly large number of enhancer-like
promoters. Our results highlight a commonality that promoter of one gene can behave
7
References
1. International Human Genome Sequencing Consortium. Initial sequencing and analysis of the human genome. Nature 409, 860–921 (2001).
2. Venter, J. C., Adams, M. D., Myers, E. W., Li, P. W., Mural, R. J., Sutton, G. G., Smith, H. O., Yandell, M., Evans, C. A., Holt, R. A., Gocayne, J. D., Amanatides, P., Ballew, R. M., Huson, D. H., Wortman, J. R., Zhang, Q., Kodira, C. D., Zheng, X. H., Chen, L., Skupski, M., Subramanian, G., Thomas, P. D., Zhang, J., Gabor Miklos, G. L., Nelson, C., Broder, S., Clark, A. G., Nadeau, J., McKusick, V. A., Zinder, N., Levine, A. J., Roberts, R. J., Simon, M., Slayman, C., Hunkapiller, M., Bolanos, R., Delcher, A., Dew, I., Fasulo, D., Flanigan, M., Florea, L., Halpern, A., Hannenhalli, S., Kravitz, S., Levy, S., Mobarry, C., Reinert, K., Remington, K., Abu-Threideh, J., Beasley, E., Biddick, K., Bonazzi, V., Brandon, R., Cargill, M., Chandramouliswaran, I., Charlab, R., Chaturvedi, K., Deng, Z., Francesco, V. D., Dunn, P., Eilbeck, K., Evangelista, C., Gabrielian, A. E., Gan, W., Ge, W., Gong, F., Gu, Z., Guan, P., Heiman, T. J., Higgins, M. E., Ji, R.-R., Ke, Z., Ketchum, K. A., Lai, Z., Lei, Y., Li, Z., Li, J., Liang, Y., Lin, X., Lu, F., Merkulov, G. V., Milshina, N., Moore, H. M., Naik, A. K., Narayan, V. A., Neelam, B., Nusskern, D., Rusch, D. B., Salzberg, S., Shao, W., Shue, B., Sun, J., Wang, Z. Y., Wang, A., Wang, X., Wang, J., Wei, M.-H., Wides, R., Xiao, C., Yan, C., Yao, A., Ye, J., Zhan, M., Zhang, W., Zhang, H., Zhao, Q., Zheng, L., Zhong, F., Zhong, W., Zhu, S. C., Zhao, S., Gilbert, D., Baumhueter, S., Spier, G., Carter, C., Cravchik, A., Woodage, T., Ali, F., An, H., Awe, A., Baldwin, D., Baden, H., Barnstead, M., Barrow, I., Beeson, K., Busam, D., Carver, A., Center, A., Cheng, M. L., Curry, L., Danaher, S., Davenport, L., Desilets, R., Dietz, S., Dodson, K., Doup, L., Ferriera, S., Garg, N., Gluecksmann, A., Hart, B., Haynes, J., Haynes, C., Heiner, C., Hladun, S., Hostin, D., Houck, J., Howland, T., Ibegwam, C., Johnson, J., Kalush, F., Kline, L., Koduru, S., Love, A., Mann, F., May, D., McCawley, S., McIntosh, T., McMullen, I., Moy, M., Moy, L., Murphy, B., Nelson, K., Pfannkoch, C., Pratts, E., Puri, V., Qureshi, H., Reardon, M., Rodriguez, R., Rogers, Y.-H., Romblad, D., Ruhfel, B., Scott, R., Sitter, C., Smallwood, M., Stewart, E., Strong, R., Suh, E., Thomas, R., Tint, N. N., Tse, S., Vech, C., Wang, G., Wetter, J., Williams, S., Williams, M., Windsor, S., Winn-Deen, E., Wolfe, K., Zaveri, J., Zaveri, K., Abril, J. F., Guigó, R., Campbell, M. J., Sjolander, K. V., Karlak, B., Kejariwal, A., Mi, H., Lazareva, B., Hatton, T., Narechania, A., Diemer, K., Muruganujan, A., Guo, N., Sato, S., Bafna, V., Istrail, S., Lippert, R., Schwartz, R., Walenz, B., Yooseph, S., Allen, D., Basu, A., Baxendale, J., Blick, L., Caminha, M., Carnes-Stine, J., Caulk, P., Chiang, Y.-H., Coyne, M., Dahlke, C., Mays, A. D., Dombroski, M., Donnelly, M., Ely, D., Esparham, S., Fosler, C., Gire, H., Glanowski, S., Glasser, K., Glodek, A., Gorokhov, M., Graham, K., Gropman, B., Harris, M., Heil, J., Henderson, S., Hoover, J., Jennings, D., Jordan, C., Jordan, J., Kasha, J., Kagan, L., Kraft, C., Levitsky, A., Lewis, M., Liu, X., Lopez, J., Ma, D., Majoros, W., McDaniel, J., Murphy, S., Newman, M., Nguyen, T., Nguyen, N., Nodell, M., Pan, S., Peck, J., Peterson, M., Rowe, W., Sanders, R., Scott, J., Simpson, M., Smith, T., Sprague, A., Stockwell, T., Turner, R., Venter, E., Wang, M., Wen, M., Wu, D., Wu, M., Xia, A., Zandieh, A. & Zhu, X. The Sequence of the Human Genome. Science 291, 1304–1351 (2001).
8
3. The ENCODE Project Consortium. An integrated encyclopedia of DNA elements in the human genome. Nature 489, 57–74 (2012).
4. Buenrostro, J. D., Giresi, P. G., Zaba, L. C., Chang, H. Y. & Greenleaf, W. J. Transposition of native chromatin for fast and sensitive epigenomic profiling of open chromatin, DNA-binding proteins and nucleosome position. Nature Methods 10, 1213–1218 (2013).
5. Boyle, A. P., Davis, S., Shulha, H. P., Meltzer, P., Margulies, E. H., Weng, Z., Furey, T. S. & Crawford, G. E. High-Resolution Mapping and Characterization of Open Chromatin across the Genome. Cell 132, 311–322 (2008).
6. Buenrostro, J. D., Wu, B., Litzenburger, U. M., Ruff, D., Gonzales, M. L., Snyder, M. P., Chang, H. Y. & Greenleaf, W. J. Single-cell chromatin accessibility reveals principles of regulatory variation. Nature 523, 486–490 (2015).
7. Cusanovich, D. A., Daza, R., Adey, A., Pliner, H. A., Christiansen, L., Gunderson, K. L., Steemers, F. J., Trapnell, C. & Shendure, J. Multiplex single-cell profiling of chromatin accessibility by combinatorial cellular indexing. Science 348, 910–914 (2015).
8. Schep, A. N., Wu, B., Buenrostro, J. D. & Greenleaf, W. J. chromVAR: inferring transcription-factor-associated accessibility from single-cell epigenomic data. Nature Methods 14, 975–978 (2017).
9. Cusanovich, D. A., Hill, A. J., Aghamirzaie, D., Daza, R. M., Pliner, H. A., Berletch, J. B., Filippova, G. N., Huang, X., Christiansen, L., DeWitt, W. S., Lee, C., Regalado, S. G., Read, D. F., Steemers, F. J., Disteche, C. M., Trapnell, C. & Shendure, J. A Single-Cell Atlas of In Vivo Mammalian Chromatin Accessibility. Cell 174, 1309-1324.e18 (2018).
10. Bravo González-Blas, C., Minnoye, L., Papasokrati, D., Aibar, S., Hulselmans, G., Christiaens, V., Davie, K., Wouters, J. & Aerts, S. cisTopic: cis-regulatory topic modeling on single-cell ATAC-seq data. Nature Methods 16, 397–400 (2019).
11. de Boer, C. G. & Regev, A. BROCKMAN: deciphering variance in epigenomic regulators by k-mer factorization. BMC Bioinformatics 19, (2018).
12. Lareau, C. A., Duarte, F. M., Chew, J. G., Kartha, V. K., Burkett, Z. D., Kohlway, A. S., Pokholok, D., Aryee, M. J., Steemers, F. J., Lebofsky, R. & Buenrostro, J. D. Droplet-based combinatorial indexing for massive-scale single-cell chromatin accessibility. Nature Biotechnology (2019). doi:10.1038/s41587-019-0147-6
13. Pliner, H. A., Packer, J. S., McFaline-Figueroa, J. L., Cusanovich, D. A., Daza, R. M., Aghamirzaie, D., Srivatsan, S., Qiu, X., Jackson, D., Minkina, A., Adey, A. C., Steemers, F. J., Shendure, J. & Trapnell, C. Cicero Predicts cis-Regulatory DNA Interactions from Single-Cell Chromatin Accessibility Data. Molecular Cell 71, 858-871.e8 (2018).
9
14. Stuart, T., Butler, A., Hoffman, P., Hafemeister, C., Papalexi, E., Mauck, W. M., Hao, Y., Stoeckius, M., Smibert, P. & Satija, R. Comprehensive Integration of Single-Cell Data. Cell 177, 1888-1902.e21 (2019).
15. Coifman, R. R. & Lafon, S. Diffusion maps. Applied and Computational Harmonic Analysis 21, 5–30 (2006).
16. Coifman, R. R., Lafon, S., Lee, A. B., Maggioni, M., Nadler, B., Warner, F. & Zucker, S. W. Geometric diffusions as a tool for harmonic analysis and structure definition of data: Diffusion maps. Proceedings of the National Academy of Sciences 102, 7426– 7431 (2005).
17. Kumar, S., Mohri, M. & Talwalkar, A. Ensemble Nystrom Method. 9
18. Li, M., Kwok, J. T. & Lu, B.-L. Making Large-Scale Nyström Approximation Possible. 12
19. Gorkin, D. U., Leung, D. & Ren, B. The 3D Genome in Transcriptional Regulation and Pluripotency. Cell Stem Cell 14, 762–775 (2014).
20. de Laat, W. & Duboule, D. Topology of mammalian developmental enhancers and their regulatory landscapes. Nature 502, 499–506 (2013).
21. Sexton, T. & Cavalli, G. The Role of Chromosome Domains in Shaping the Functional Genome. Cell 160, 1049–1059 (2015).
22. Dekker, J., Marti-Renom, M. A. & Mirny, L. A. Exploring the three-dimensional organization of genomes: interpreting chromatin interaction data. Nature Reviews Genetics 14, 390–403 (2013).
23. Denker, A. & de Laat, W. The second decade of 3C technologies: detailed insights into nuclear organization. Genes & Development 30, 1357–1382 (2016).
24. Lieberman-Aiden, E., Berkum, N. L. van, Williams, L., Imakaev, M., Ragoczy, T., Telling, A., Amit, I., Lajoie, B. R., Sabo, P. J., Dorschner, M. O., Sandstrom, R., Bernstein, B., Bender, M. A., Groudine, M., Gnirke, A., Stamatoyannopoulos, J., Mirny, L. A., Lander, E. S. & Dekker, J. Comprehensive Mapping of Long-Range Interactions Reveals Folding Principles of the Human Genome. Science 326, 289– 293 (2009).
25. Fullwood, M. J., Liu, M. H., Pan, Y. F., Liu, J., Xu, H., Mohamed, Y. B., Orlov, Y. L., Velkov, S., Ho, A., Mei, P. H., Chew, E. G. Y., Huang, P. Y. H., Welboren, W.-J., Han, Y., Ooi, H. S., Ariyaratne, P. N., Vega, V. B., Luo, Y., Tan, P. Y., Choy, P. Y., Wansa, K. D. S. A., Zhao, B., Lim, K. S., Leow, S. C., Yow, J. S., Joseph, R., Li, H., Desai, K. V., Thomsen, J. S., Lee, Y. K., Karuturi, R. K. M., Herve, T., Bourque, G., Stunnenberg, H. G., Ruan, X., Cacheux-Rataboul, V., Sung, W.-K., Liu, E. T., Wei, C.-L., Cheung, E. & Ruan, Y. An oestrogen-receptor-α-bound human chromatin interactome. Nature 462, 58–64 (2009).
10
Robinson, J. T., Sanborn, A. L., Machol, I., Omer, A. D., Lander, E. S. & Aiden, E. L. A 3D Map of the Human Genome at Kilobase Resolution Reveals Principles of Chromatin Looping. Cell 159, 1665–1680 (2014).
27. Tang, Z., Luo, O. J., Li, X., Zheng, M., Zhu, J. J., Szalaj, P., Trzaskoma, P., Magalska, A., Wlodarczyk, J., Ruszczycki, B., Michalski, P., Piecuch, E., Wang, P., Wang, D., Tian, S. Z., Penrad-Mobayed, M., Sachs, L. M., Ruan, X., Wei, C.-L., Liu, E. T., Wilczynski, G. M., Plewczynski, D., Li, G. & Ruan, Y. CTCF-Mediated Human 3D Genome Architecture Reveals Chromatin Topology for Transcription. Cell 163, 1611– 1627 (2015).
28. Gerstein, M. B., Kundaje, A., Hariharan, M., Landt, S. G., Yan, K.-K., Cheng, C., Mu, X. J., Khurana, E., Rozowsky, J., Alexander, R., Min, R., Alves, P., Abyzov, A., Addleman, N., Bhardwaj, N., Boyle, A. P., Cayting, P., Charos, A., Chen, D. Z., Cheng, Y., Clarke, D., Eastman, C., Euskirchen, G., Frietze, S., Fu, Y., Gertz, J., Grubert, F., Harmanci, A., Jain, P., Kasowski, M., Lacroute, P., Leng, J., Lian, J., Monahan, H., O’Geen, H., Ouyang, Z., Partridge, E. C., Patacsil, D., Pauli, F., Raha, D., Ramirez, L., Reddy, T. E., Reed, B., Shi, M., Slifer, T., Wang, J., Wu, L., Yang, X., Yip, K. Y., Zilberman-Schapira, G., Batzoglou, S., Sidow, A., Farnham, P. J., Myers, R. M., Weissman, S. M. & Snyder, M. Architecture of the human regulatory network derived from ENCODE data. Nature 489, 91–100 (2012).
29. Shen, Y., Yue, F., McCleary, D. F., Ye, Z., Edsall, L., Kuan, S., Wagner, U., Dixon, J., Lee, L., Lobanenkov, V. V. & Ren, B. A map of the cis-regulatory sequences in the mouse genome. Nature 488, 116–120 (2012).
30. Xie, W., Schultz, M. D., Lister, R., Hou, Z., Rajagopal, N., Ray, P., Whitaker, J. W., Tian, S., Hawkins, R. D., Leung, D., Yang, H., Wang, T., Lee, A. Y., Swanson, S. A., Zhang, J., Zhu, Y., Kim, A., Nery, J. R., Urich, M. A., Kuan, S., Yen, C., Klugman, S., Yu, P., Suknuntha, K., Propson, N. E., Chen, H., Edsall, L. E., Wagner, U., Li, Y., Ye, Z., Kulkarni, A., Xuan, Z., Chung, W.-Y., Chi, N. C., Antosiewicz-Bourget, J. E., Slukvin, I., Stewart, R., Zhang, M. Q., Wang, W., Thomson, J. A., Ecker, J. R. & Ren, B. Epigenomic Analysis of Multilineage Differentiation of Human Embryonic Stem Cells. Cell 153, 1134–1148 (2013).
31. Roadmap Epigenomics Consortium, Kundaje, A., Meuleman, W., Ernst, J., Bilenky, M., Yen, A., Heravi-Moussavi, A., Kheradpour, P., Zhang, Z., Wang, J., Ziller, M. J., Amin, V., Whitaker, J. W., Schultz, M. D., Ward, L. D., Sarkar, A., Quon, G., Sandstrom, R. S., Eaton, M. L., Wu, Y.-C., Pfenning, A. R., Wang, X., Claussnitzer, M., Liu, Y., Coarfa, C., Harris, R. A., Shoresh, N., Epstein, C. B., Gjoneska, E., Leung, D., Xie, W., Hawkins, R. D., Lister, R., Hong, C., Gascard, P., Mungall, A. J., Moore, R., Chuah, E., Tam, A., Canfield, T. K., Hansen, R. S., Kaul, R., Sabo, P. J., Bansal, M. S., Carles, A., Dixon, J. R., Farh, K.-H., Feizi, S., Karlic, R., Kim, A.-R., Kulkarni, A., Li, D., Lowdon, R., Elliott, G., Mercer, T. R., Neph, S. J., Onuchic, V., Polak, P., Rajagopal, N., Ray, P., Sallari, R. C., Siebenthall, K. T., Sinnott-Armstrong, N. A., Stevens, M., Thurman, R. E., Wu, J., Zhang, B., Zhou, X., Beaudet, A. E., Boyer, L. A., De Jager, P. L., Farnham, P. J., Fisher, S. J., Haussler, D., Jones, S. J. M., Li, W., Marra, M. A., McManus, M. T., Sunyaev, S., Thomson, J. A., Tlsty, T. D., Tsai,
11
L.-H., Wang, W., Waterland, R. A., Zhang, M. Q., Chadwick, L. H., Bernstein, B. E., Costello, J. F., Ecker, J. R., Hirst, M., Meissner, A., Milosavljevic, A., Ren, B., Stamatoyannopoulos, J. A., Wang, T. & Kellis, M. Integrative analysis of 111 reference human epigenomes. Nature 518, 317–330 (2015).
32. Ernst, J., Kheradpour, P., Mikkelsen, T. S., Shoresh, N., Ward, L. D., Epstein, C. B., Zhang, X., Wang, L., Issner, R., Coyne, M., Ku, M., Durham, T., Kellis, M. & Bernstein, B. E. Mapping and analysis of chromatin state dynamics in nine human cell types. Nature 473, 43–49 (2011).
33. Canver, M. C., Smith, E. C., Sher, F., Pinello, L., Sanjana, N. E., Shalem, O., Chen, D. D., Schupp, P. G., Vinjamur, D. S., Garcia, S. P., Luc, S., Kurita, R., Nakamura, Y., Fujiwara, Y., Maeda, T., Yuan, G.-C., Zhang, F., Orkin, S. H. & Bauer, D. E. BCL11A enhancer dissection by Cas9-mediated in situ saturating mutagenesis. Nature 527, 192–197 (2015).
34. Korkmaz, G., Lopes, R., Ugalde, A. P., Nevedomskaya, E., Han, R., Myacheva, K., Zwart, W., Elkon, R. & Agami, R. Functional genetic screens for enhancer elements in the human genome using CRISPR-Cas9. Nature Biotechnology 34, 192–198 (2016).
35. Rajagopal, N., Srinivasan, S., Kooshesh, K., Guo, Y., Edwards, M. D., Banerjee, B., Syed, T., Emons, B. J. M., Gifford, D. K. & Sherwood, R. I. High-throughput mapping of regulatory DNA. Nature Biotechnology 34, 167–174 (2016).
36. Diao, Y., Li, B., Meng, Z., Jung, I., Lee, A. Y., Dixon, J., Maliskova, L., Guan, K., Shen, Y. & Ren, B. A new class of temporarily phenotypic enhancers identified by CRISPR/Cas9-mediated genetic screening. Genome Research 26, 397–405 (2016). 37. Sanjana, N. E., Wright, J., Zheng, K., Shalem, O., Fontanillas, P., Joung, J., Cheng, C., Regev, A. & Zhang, F. High-resolution interrogation of functional elements in the noncoding genome. Science 353, 1545–1549 (2016).
38. Jinek, M., Chylinski, K., Fonfara, I., Hauer, M., Doudna, J. A. & Charpentier, E. A Programmable Dual-RNA-Guided DNA Endonuclease in Adaptive Bacterial Immunity. Science 337, 816–821 (2012).
39. Short motif sequences determine the targets of the prokaryotic CRISPR defence system. Microbiology 155, 733–740 (2009).
40. Sternberg, S. H., Redding, S., Jinek, M., Greene, E. C. & Doudna, J. A. DNA interrogation by the CRISPR RNA-guided endonuclease Cas9. Nature 507, 62–67 (2014).
12
CHAPTER 1: SINGLE-NUCLEUS ANALYSIS OF ACCESSBILE CHROMATIN IN DEVELOPING MOUSE FOREBRAIN
1.1 Abstract
Analysis of chromatin accessibility can reveal the transcriptional regulatory
sequences, but heterogeneity of primary tissues poses a significant challenge in mapping
the precise chromatin landscape in specific cell types. Here, we report single nucleus
ATAC-seq (snATAC-seq), a combinatorial barcoding-assisted single cell assay for
transposase-accessible chromatin that is optimized for use on flash-frozen primary tissue
samples. We apply this technique on the mouse forebrain through eight developmental
stages. Through analysis of more than 15,000 nuclei, we identify 20 distinct cell
populations corresponding to major neuronal and non-neuronal cell-types. We further
define cell-type specific transcriptional regulatory sequences, infer potential master
transcriptional regulators, and delineate developmental changes in forebrain cellular
composition. Our results provide insight into the molecular and cellular dynamics that
underlie forebrain development in the mouse and establish technical and analytical
13
1.2 Introduction
Transcriptional regulatory elements in the genome (cis regulatory elements) play
fundamental roles in development and disease1,2. Analysis of chromatin accessibility in
primary tissues using assays such as DNase-seq3,4 and ATAC-seq5,6 has identified
millions of candidate cis elements in the human and mouse genomes2,7. However, we still
lack precise information about the cis regulatory elements in specific cell types, because
previous experiments performed on heterogeneous tissue samples yield an ensemble
average signal from multiple constituent cell types. In some cases, specific cell types can
be isolated from heterogeneous tissues using protein markers6,8–10, but a more general
strategy is needed to enable the study of cell type specific gene regulation on a larger
scale.
In theory, single cell-based chromatin accessibility studies can be used for
unbiased identification of subpopulations in a heterogeneous biological sample, and for
identification of the regulatory elements active in each subpopulation. Indeed, proof of
principle has been reported using cultured mammalian cells and cryopreserved blood
cell-types11–13. However, to make these approaches more widely applicable, it is necessary
to optimize them for primary tissues. One major difficulty in working with primary tissues
is that they are typically preserved by flash freezing, which is not amenable to the isolation
of intact single cells. Here, we show that it is possible to isolate single nuclei from frozen
14
1.3 Results
Method optimization and computational analysis framework. We adopted a
combinatorial barcoding assisted single cell ATAC-seq strategy12 and optimized it for
frozen tissue samples (Supplementary Methods). Compared to previous reports12, key
modifications were made to maximally preserve nuclei integrity during sample processing
and optimize transposase-mediated fragmentation of chromatin in individual nuclei
(Figure S1.1-S1.2). We applied this modified protocol, hereafter referred to as
snATAC-seq (single nucleus ATAC-snATAC-seq), to mouse forebrain tissue from 8-week-old adult mice
(P56) and from mouse embryos at seven developmental stages from embryonic day 11.5
(E11.5) to birth (P0) (Figure 1.1a, b). DNA libraries were sequenced to near saturation
as indicated by a read duplication rate of 36-73% per sample. The barcode collision rate
which assesses the probability of two nuclei sharing the same barcode combination was
~16% and slightly higher than expected and reported before (Figure S1.3c)12. We filtered
out low-quality datasets using three stringent quality control criteria including read depth
(Figure S1.3d), recovery rate of constitutively accessible promoters in each nucleus
(Figure S1.3e), and signal-over-noise ratio estimated by fraction of reads in peak regions
(Figure S1.3f, Supplementary Methods). In total, 15,767 high-quality snATAC-seq
datasets were obtained. The median read depth per nucleus ranged from 9,275 to 18,397,
with the median promoter coverage at 11.6% and the median fraction of reads in peak
regions at 22%. Our protocol maintains the extraordinary scalability of combinatorial
indexing, while featuring a ~6-fold increase in read depth per nucleus compared to
previous reports. The high quality of the single nucleus chromatin accessibility maps was
15
ATAC-seq data (R > 0.9), and excellent reproducibility between independent
snATAC-seq experiments (R > 0.91, Figure 1.1c, Figure S1.4).
The snATAC-seq profiles from each forebrain tissue arise from a mixture of distinct
cell types. Enhancer regions are well known to display cell type-dependent chromatin
accessibility14, and are more effective at classifying cell types than promoters or
transcriptomic data11 (Figure S1.5a, b). Thus, we focused on Transcriptional Start Sites
(TSS)-distal accessible chromatin regions (defined as all genomic elements outside a 2
kb window upstream the TSS), corresponding to putative enhancers, to group individual
nucleus profiles into distinct cell types. We developed a novel computational framework
to uncover distinct cell types from the snATAC-seq datasets without requiring prior
knowledge (Supplementary Methods). First, we determined the open chromatin regions
from the bulk ATAC-seq profiles of mouse forebrain tissue in seven fetal development
time points and in adults, resulting in a total of 140,103 TSS-distal elements (Figure 1.1d
and Supplementary Methods). Next, we constructed a binary accessibility matrix of
open chromatin regions, using 0 or 1 to indicate absence or presence of a read at each
open chromatin region in each nucleus (Figure 1.1d). We then calculated the pairwise
similarity between cells using a Jaccard index, and applied a non-linear dimensionality
reduction method, t-SNE15, to project the Jaccard index matrix to a low-dimension space
(Figure 1.1d)16. The final t-SNE plot depicts cell types as distinct clusters in a
16
Identification of forebrain cell types from snATAC-seq profiles. We applied
this computational framework first to 3,033 high-quality snATAC-seq profiles obtained
from the adult forebrain (Figure 1.2a). As a negative control, we included 200 “shuffled”
nuclear profiles (Figure S1.5c, d and Supplementary Methods). This analysis revealed
10 total clusters. As expected, the shuffled nuclei formed a distinct cluster with low
intra-cluster similarity. In addition, one other intra-cluster showed low intra-intra-cluster similarity likely
represents low quality nuclei or accessibility profiles resulting from barcode collision
events (Figure S1.3c). After eliminating these nuclei, we determined 8 distinct cell type
clusters from the adult forebrain (Figure 1.2a and Figure S1.5c, d). Notably, the
clustering results were highly reproducible for two independent experiments (Figure
S1.5e, f).
To categorize each cluster, we generated aggregate chromatin accessibility maps
for each cluster and examined the patterns of chromatin accessibility at known cell type
marker genes. We found three clusters with chromatin accessibility at Neurod6 and other
excitatory neuron-specific genes17 (clusters EX1-3, Figure 1.2b, Figure S1.6a); two
clusters with accessibility at the gene locus of Gad1 likely representing inhibitory neurons
(clusters IN1-2, Figure 1.2b, Figure S1.6a)18; one cluster with accessibility at the Apoe
locus and other known astroglia markers19 (cluster AC, Figure 1.2b); one cluster with
accessibility at the Mog gene locus and other oligodendrocyte marker genes20 (cluster
OC, Figure 1.2b); and one microglia cluster with accessibility at genes encoding
complement factors including the gene C1qb (cluster MG, Figure 1.2b, Figure
17
previously published maps from sorted excitatory neurons6, GABAergic neurons8,
microglia21 and NeuN negative nuclei (which mostly comprise non-neuronal cells
including astrocytes and oligodendrocytes22; Figure 1.2b and Figure S1.7a-c).
Consistent with the accessibility patterns at marker gene loci, we observed that clusters
EX1-3 were highly similar to sorted excitatory neurons. To further characterize the distinct
excitatory neuron clusters, we compared EX1-3 with published bulk ATAC-seq data from
different cortical layers and from dentate gyrus. Interestingly, we found that EX1 and EX3
were more similar to upper and lower cortical layers, respectively, whereas EX2 showed
properties of dentate gyrus neurons (Figure S1.8a). Clusters IN1 was highly similar to
sorted cortical GABAergic neurons23. Surprisingly, IN2 was more similar to sorted
excitatory neurons than cortical GABAergic neurons. Distinctions between the inhibitory
neuron clusters (IN1 and IN2) were not clear at this stage but came into focus later when
we analyzed transcription factor (TF) motifs enriched in the accessible chromatin regions
(described below). Clusters OC and AC resembled sorted NeuN negative cells, and
cluster MG is similar to sorted microglia (Figure 1.2b, c)
According to our snATAC-seq data, the adult mouse forebrain consists of 52%
excitatory neurons, 24% inhibitory neurons, 12% oligodendrocytes and 6% astrocytes
and microglia, respectively (Figure 1.2d). Since the cell type proportion varies between
different forebrain regions, for example cortex and hippocampus, the percentages derived
from snATAC-seq represent an average of all forebrain regions (Figure S1.7d, e; Figure
18
confirmed by flow cytometry analysis using staining against the post-mitotic neuron
marker NeuN22 (Figure S1.6b; Figure S1.7b, e; Figure 1.2e).
Delineation of the cis regulatory landscape of specific cell types in the adult forebrain. The power of the snATAC-seq is not simply to delineate cell types, but further,
to reveal the cis-regulatory landscape within each cell type. To this end, we calculated
the cell type specificity of each putative cis regulatory element (i.e. chromatin accessibility
region) using a Shannon entropy index (Figure S1.9). As expected, proximal promoter
elements were accessible in more cell types, while the distal enhancer elements showed
significantly higher cell type-specificity (Median value of 4.2% for proximal elements vs.
0.4% for distal elements) (Figure S1.9a-d). We next developed a feature selection
method (Supplementary Methods) to identify the subset of elements that could best
distinguish the 8 cell type clusters from each other. This approach identified 4,980
elements showing clear cell type dependent accessibility (Figure 1.2e). To gain insight
into the key transcriptional regulators and pathways active in each cell type, we performed
k-means clustering followed by motif enrichment analysis for these genomic elements
(Figure 1.2e, f and Figure S1.9d). For each cell type, we observed an enrichment of
binding motifs corresponding to key TFs (Figure 1.2f). For example, the binding motif for
ETS-factor PU.1 was enriched in MG elements24, motifs for SOX proteins were enriched
in OC elements25, bHLH motifs were enriched in EX1-3 elements, and DLX homeodomain
factor motifs were enriched in IN elements (Figure 1.2f)26. Moreover, this analysis
revealed an important difference between the inhibitory neuron clusters IN1 and IN2. We
19
to IN2. Previous reports showed that MEIS2 plays a major role in generation of medium
spiny neurons, the main GABAergic neurons in the striatum27. Accordingly, we identified
gene loci of Ppp1r1b and Drd1, which encode markers of medium spiny neurons, to be
highly accessible in IN2 but not IN1 (Figure S1.10)27. These data suggest that IN2 may
represent medium spiny neurons, while IN1 could represent a distinct class of GABAergic
neurons. We also identified motifs that were differentially enriched between EX1, EX2
and EX3. Notably, regions specific for EX1 and 3 were enriched for motifs from the
Forkhead family and EX2 was enriched for motifs recognized by MEF2C (Figure S1.8c),
which has been shown to play an important role in hippocampus mediated memory28. A
comparison with data from cell-type specific differentially methylated regions identified by
single cell DNA-methylation analysis of neurons showed that both methods were able to
identify inhibitory and excitatory neuron specific elements (Figure S1.11)29.
Profiling embryonic forebrain development using snATAC-seq. We next
extended our framework by analyzing the snATAC-seq profiles derived from fetal mouse
forebrains at seven developmental stages (Figure 1.1b), seeking to reveal developmental
dynamics of transcriptional regulation at the cellular level. The developmental stages
examined cover key events from the onset of neurogenesis to gliogenesis30. From 12,733
high-quality snATAC-seq profiles we identified 12 distinct sub-populations (Figure 1.3a)
that exhibit changes in abundance through development (Figure 1.3a-c). This broad
cell-type classification allowed us to profile the dynamic cis-regulatory landscape of forebrain
development. Based on accessibility profiles at gene loci of known marker genes, we
20
astrocytes and erythromyeloid progenitors (EMP) (Figure 1.3b)24,31. Interestingly, the
EMP cluster was restricted to E11.5, whereas the astrocyte cluster was present after
E16.5 and expanded dramatically around birth (Figure 1.3b, c)30, highlighting two
developmental processes: invasion of myeloid cells into the brain prior to neurogenesis,
and gliogenesis succeeding neurogenesis after E16.530. Mature excitatory neurons
(eEX2) were indicated by increased accessibility at Neurod6 which encodes a post-mitotic
neuron marker, and absence of signal at the Hes5 gene, which encodes a Notch effector
and a marker gene for neuronal progenitors (Figure 1.3b, c)31. This cell type expanded
in abundance between E12.5 and E13.5 and followed the emergence of early
differentiating neurons (eEX1, Figure 1.3b, c). Remarkably, inhibitory-neuron-like cells
were already present at E11.5 (Figure 1.3b).
Identification of lineage specific transcriptional regulators during embryonic forebrain development. To identify the transcriptional regulatory sequences in each
sub-population, we identified 16,364 genomic elements that show cell-population-specific
chromatin accessibility and best separate the sub-cell populations (Figure 1.4a). To
further characterize these elements, we performed motif enrichment analysis and gene
ontology analysis of each cluster using GREAT32. Our analysis showed that genomic
elements that were mostly associated with radial glia like cell groups (Figure 1.4a,
RG1-4) fell into regulatory regions of genes involved in early forebrain developmental processes including “Forebrain regionalization” (Figure 1.4b, K1), “Central nervous
system development” (Figure 1.4b, K3) or “Forebrain development” (Figure 1.4b, K5).
21
factors including LHX2 (Figure 1.4c, K1,3,5), which is critical for generating the correct
neuron numbers by regulating proliferation of neural progenitors33 and for temporally
promoting neurogenesis over astrogliagenesis34. Remarkably, one of these clusters was
also enriched for both the proneural bHLH transcription factor ASCL1 (Mash1) and its
co-regulator POU3F3 (Brn1) (Figure 1.4c, K5)35. ASCL1 is required for normal proliferation
of neural progenitor cells and implicated in a DLX1/2 associated network that promotes
GABAergic neurogenesis36,37. In line with this, associated genomic elements were also
accessible in one inhibitory neuron cluster (eIN2, Figure 1.4c, K5).
We also identified transcriptional regulators that were specifically associated either
with neurogenesis or gliogenesis during forebrain development. For example, the early
astrocyte (eAC)-specific elements were located in open chromatin regions near genes involved in “glia cell fate commitment” and the top enriched transcription factor motif was
NF1-halfsite (Figure 1.4a-c, K2). Previous studies showed that NF1 transcription factor
NF1A alone is capable of specifying glia cells to the astrocyte lineage25. NFIX is another
NF1 family member with proneural function38. This motif is enriched together with the
bHLH transcription factor NEUROD1 binding sites mainly in open chromatin regions
found in the excitatory neuron cell population (Figure 1.4c, K4,12,13)31. Based on
chromatin accessibility profiles at marker gene loci, we have previously assigned two cell
clusters to the excitatory neuron lineage (eEX1, eEX2, Figure 1.3b). Compared to cluster
eEX2, eEX1 showed increased accessibility at both radial glia associated open chromatin
(Figure 1.4a, K4; Figure 1.3b) and chromatin regions associated with “CNS neuron
22
eEX2 nuclei during development (Figure 1.3c). These findings indicate that eEX1 might
represent a transitional state during excitatory neuron differentiation.
The bHLH transcription factor family consists of several subfamilies that recognize
different DNA motifs39. NEUROD1 belongs to a sub-family of transcription factors that
bind to a central CAT motif whereas other transcription factors such as TCF12
preferentially bind to a CAG motif39. Our snATAC-seq profiles revealed an enrichment of
the TCF12-binding motif in regions associated with “Cortex GABAergic interneuron
differentiation” in contrast to the excitatory neuron associated enrichment for NEUROD1
(Figure 1.4a-c, K4, 11-13)40. Analysis of the inhibitory neuron cluster eIN3 specific
genomic elements showed a remarkable bias in proximity to genes associated with “Skeletal muscle organ development” (Figure 1.4a, b, K8). More detailed analysis
revealed that the underlying genes Mef2c/d and Foxp1/2 as well as Drd2/3 encode
transcription factors and dopamine receptors indicating differentiating striatal medium
spiny neurons41,42. This finding was consistent with the enrichment for
MEIS-homeodomain factors in these regions (Figure 1.4c, K8) comparable to the medium spiny
neuron cluster in adult forebrain (Figure 1.2e, f, K8; Figure S1.10). Further, genomic elements specific to the EMP cluster were associated with genes involved in “Myeloid cell
development” (Figure 1.4a-c, K14) and enriched for motifs of the ubiquitous AP-1
transcription factor complexes that have been described to play a role in shaping the
23
Finally, we attempted to identify developmental dynamics of elements within each
cell cluster (Figure S1.11). Our analysis revealed between 41 and 2,114 dynamic
genomic elements for each cell type (Figure S1.12c-g). Regions that are more accessible
after birth (P0) compared to early time points were enriched for the RFX1 motif in the
GABAergic neuron including the cluster eIN1 as well as in the excitatory neuron cluster
eEX2 (Figure S12d, e) indicating a general role of the evolutionary conserved RFX
factors in perinatal adaptation of brain cells. Several family members including RFX1 are
expressed in the brain and have been implicated to regulate cilia e.g. in sensory
neurons44.
Functional and anatomical annotation of identified candidate cis-regulatory elements. While assessment of open chromatin plays an important role in predicting
regulatory elements in the genome. it does not provide direct information of functional
activity. To address this point, we asked if cluster-specific trannsposase accessible
chromatin in the embryonic forebrain overlaps with genomic elements tested in reporter
assays to validate enhancer activity in mouse embryonic forebrain in vivo45.First, we
focused our analysis on all genomic elements with validated functional activity in the
forebrain and a subset shown to be active only in the subpallium46,47. The subpallium is a
brain region that gives rise to GABAergic and cholinergic neurons46. In total, 63.1 %
(275/436) of all forebrain enhancer and 64.8% (59/91) of subpallial enhancer were
represented in our subset of genomic elements, respectively, indicating a high degree of
sensitivity. Next, we calculated the relative enrichment of subpallial enhancers over total