CHAPTER 1 1.0 INTRODUCTION 1.1 Background
According to the World Bank (2002), every year more than 1.17 million people die in road crashes around the world. The majority of these deaths, about 70 percent occur in developing countries. Sixty-five percent (65%) of deaths involve pedestrians and 35 percent of pedestrian deaths are children. Over 10 million are crippled or injured each year. It has been estimated that at least 6 million more will die and 60 million will be injured during the next 10 years in developing countries unless urgent action is taken.
The majority of road crash victims (injuries and fatalities) in developing countries are not the motorised vehicle occupants, but pedestrians, motorcyclists, bicyclists and non-motorised vehicles (NMV) occupants.
In response to these staggering statistics, the World Health Organisation (2010) works with partners - governmental and nongovernmental - around the world to raise the profile of the preventability of road traffic injuries and promote good practices related to helmet and seat-belt wearing, not drinking and driving, not speeding and being visible in traffic
According to Global Road Safety Partnership, Ghana, road crashes kill an average of four persons daily in Ghana. In 2005, the number of road crashes increased by 16% relative to 2004. The regions Ashanti, Eastern, Greater. Accra, Central and Brong Ahafo Regions account for more than 70% of the total number of crash fatalities. Some 70% of crashes occur on flat and straight roads. Speeding is a major cause of crashes, accounting for over 50% of reported crashes. Buses and mini-buses cause 35% of fatal crashes while cars are responsible for 32%.
Road users between 16-45 years are the most vulnerable group and account for 58% of total road crash fatalities from 2002-2005. 70% of persons killed in road crashes are males. The age
groups from 0-5, 46-65 and over 65 years also accounted for a 20.8%, 16.7% and 4.6% respectively of the total fatalities during the same period.
According to the National Road Safety Commission, an annual distribution of fatalities by road user class 3.5% of motorcyclist were I involved in fatalities. These fatalities were reportedly mostly due to head injuries which could have be preventable if motorcyclist were wearing crash helmets.
Afukaar et al. (2009) indicated that Northern region accounts for the most (20%) motorcycle fatalities in Ghana followed by the Upper West region with 14.7% motorcyclist. In the November 10th 2009, edition of the Daily Graphic, “Wear helmets for protection” was a major concern when Tamale was brought into focus on the Metro news column. In this article it mentioned that there had been occasions on which the Northern Regional Director of the NRSC and the Deputy Superintendent of Police and the Commander of the MTTU had to go on the streets of the metropolis sensitizing riders on the need to wear helmets. However the sensitization seemed to have fallen on deaf ears. Reports in the metropolis indicate that, at least an unhelmeted motorcycle rider is killed every fortnight and the number of motorcycle injuries has reportedly increased in recent times. The majority of those involved are reportedly young males.
In Ghana where motorcycle taxis are now becoming common although they are not an authorized means of public transportation, it is common to find both the riders and the pillion riders (passenger) riding without wearing helmets. In the event of an accident the risk of obtaining head injuries are high whereas the risk could be reduced if they wear crash helmets. Road safety campaigns should encourage pillion riders who patronize motorcycle taxis to insist on being provided with helmets.
Many studies conducted elsewhere have demonstrated higher incidence of head and cervical injuries and mortality in unhelmeted patients (Solagberu et al, 2006).
The idea that it is possible to engage the public at a personal level in road safety has led to the development of the driver Voluntary Code of Conduct (VCoC). In countries where there are scarce and competing resources, the most effective way to achieve casualty reductions may be to target the public and elicit personal commitment to being a responsible and respectful road user. This project is the result of a partnership between Shell Ghana Limited the Global Road Safety Partnership (Ghana) and the National Road Safety Commission.
Historical research into the causes of crashes suggested that road user errors were the predominant cause. The more recent approach of considering the road/vehicle/user system as a whole focuses more on the interactions between users and the physical elements of the system. Behavioural issues and human choices however remain critical, particularly with respect to aspects such as wearing seat belts and helmets, drinking and driving, and speed (GPRS Ghana, n. d).
1.2 Justification for the study
In many low-income and middle-income countries, where motorcycles and bicycles are an increasingly common means of transport, users of these two-wheelers make up a large proportion of those injured or killed on the roads. Motorcycle and bicycle riders are at an increased risk of being involved in a crash because they often share the traffic space with fast-moving cars, buses and trucks. In addition, their lack of physical protection makes them particularly vulnerable to being injured if they are involved in a collision. In most high-income countries, motorcycle fatalities typically comprise around 5% to 18% of overall traffic fatalities. This proportion reflects the combined effect of several important factors including the relatively low ownership and use of motorcycles in many developed countries, and the relatively high risk of these motorcycles being involved in crashes involving fatalities. Typically, these risks are much higher for motorcycle than for vehicle travel. In low-income and middle-income countries, car ownership and use rates are generally much lower than in high-income countries. In developing countries motorcycles are frequently the most common form of motor transport (WHO, 2006).
The ownership and use of motorcycles and other two-wheelers is generally relatively high – for example, in India 69% of the total number of motor vehicles are motorized two-wheelers, considerably higher than in high-income countries Reflecting this difference, the levels of motorcycle rider fatalities as a proportion of those injured on the roads are typically higher in low-income and middle-income countries than in high-income countries. For instance, 27% of road deaths in India are among users of motorized two-wheelers, while this figure is between 70–90% in Thailand, and about 60% in Malaysia. In China, motorcycle ownership between 1987 and 2001 grew rapidly from 23% to 63%, with a corresponding increase in the proportion of traffic fatalities sustained by motorcyclists increasing from 7.5% to 19% over the same
period (WHO, 2006). Motorcycle and bicycle taxis are emerging as important means of public transportation in many African cities - but their operation is characterized by non-helmet use.
In Ghana and most African countries, the use of motorcycles as a means of transportation is becoming increasingly popular. This is because the cost of a motorcycle is relatively lower compared with the cost of an automobile. Motorcycles can traverse and maneuver over all types of roads, thus the cost for infrastructure is rather low as compared to automobiles. In congested urban Ghana, a significant number of people prefer the use of motorcycles since one could maneuver and weave through all types of traffic; however the safety of riders leaves much to be desired, in that most of them ride without wearing helmets, especially when riding within the cities and towns.
Research indicates that wearing a helmet lowers a motorcycle rider's risk of fatalities by 29% and reduces the risk of traumatic brain injury by 67 %.( NHTSA, 2002). Here in Ghana the National Road Safety Commission’s Arrive Alive campaign has laid on the wearing of crash helmets and how it can reduce head injuries. Coupled with this, there is a Mandatory crash helmet law in Ghana requiring that all Motorcyclists should wear helmets when riding. Despite these laws, campaigns and the scientific evidence showing that helmets reduce deaths and injuries to motorcycle riders, many riders choose not to wear helmets. In Ghana, statistics show that
between 2004 and 2006, 303 motorcycle riders were involved in fatalities and these fatalities were due to head injuries.
Available data indicates that Northern Ghana accounts for a high proportion of fatalities
However, in Ghana, gap in existing data due to under reporting of crashes means that precise levels of motorcycle rider fatalities are still not known. Knowledge of the numbers of motorcyclists complying with helmet laws or levels of non compliance alongside the associated reasons will help the NRSC to shape its educational strategy or have a more focused road safety activity on helmet use.
1.3 Objectives of the Study The objectives of the study are:
1. To establish the prevalence of motorcycle helmet usage for both the rider and the pillion rider and factors determining use or non – use of the helmet
2. To establish the level of awareness among motorcyclists of the benefits of using crash helmet.
3. To establish the perception of motorcyclists on the usage of crash helmets and the enabling legislature or regulation.
CHAPTER 2
2.0 LITERATURE REVIEW 2.1 Studies Comparing Injury of Riders by Helmet Use
Over the past three decades the use of motorcycle safety helmets has become more common in many Countries throughout the world. Research, mostly conducted in the United States of America, has repeatedly found that motorcycle helmets are effective in reducing head and neck injuries and deaths from motorcycle crashes. Studies indicate that wearing helmets reduces fatalities by more than 25% (Baker et al. (1992), Offner et al. (1992), Rutledge et al. (1993)). A study by Braddock et al. (1992) found non-helmeted motorcyclists involved in crashes were 3.4-fold more likely to die than were helmeted riders. The National Highway Traffic Safety Administration (NHTSA) estimates that wearing a helmet reduces a motorcyclists’ overall risk of death in a crash by 29 percent and the risk of brain injury by 67 percent (NHTSA, 2002).
Bachulis et al. (1988) studied the records of all motorcyclists admitted to hospital and found a much higher percentage of deaths in non-helmeted riders than in helmeted riders. They found “23 deaths (9.7%) in the 235 non-helmeted patients compared to 7 deaths (5.3%) in the 132 helmeted riders. “ They also reported that almost half of the non-helmeted motorcyclists had brain injuries compared with nearly a fourth of the helmeted patients. Severe brain injuries were three times as high in non-helmeted patients as in helmeted patients (30% versus 9.3%). The study also shows that deaths from causes other than brain injury were 3.8% in both helmeted and non-helmeted patients.
Gabella et al. (1995) reported on the relationship between helmet use and head injuries among motorcycle crash victims in El Paso County, Colorado, from 1989 to 1990. They reported head injuries for 7.6% of motorcycle riders with helmets versus 25.4% of head injuries for motorcycle riders without helmets. May et al. (1989) reviewed 225 victims of motorcycle crashes during a 24-month period from 1987 to 1988. The source of the data was
the Bay Area Trauma Registry which show that 1 of 60 (1.7%) patients who used helmets died while 7 out of 153 (4.6%) patients who did not use helmets died. The study by Wagle et al (1993) includes 81 motorcyclists involved in crashes and flown to the trauma center of Hartford Hospital, Connecticut. They reported that one out of the 23 helmeted motorcyclists died (4.3%), while 9 of the 58 (15.5%) non-helmeted riders died. Heilman et al. (1982) study motorcycle-related trauma and helmet usage in North Dakota. The study which includes four years of data from 1977 to 1980 concludes that 2.5% of motorcycle riders without helmets in crashes died while 0.8% of motorcycle riders with helmets in crashes died (H Schneider, 2006).
2.2 Effectiveness of Motorcycle Helmet Legislation to Increase Helmet Use
There is strong evidence that laws requiring the use of helmets increases their use (Braddock et al. 1992; McSwain et al. 1990; Chenier et al. 1987), thus reducing injury, death and medical costs. Less than 50% of motorcyclists wear helmets when they are not required by law, while compliance approaches 100% when the laws are in effect and are enforced (Champion et al.1991).
Motorcycle injuries and fatalities are a growing problem in developing countries (Ding et al. 1993; Supramaniam et al. 1982; Sood 1988; Sidharta et al. 1989; Buro Pusat Statistik 1988). Relatively few developing countries have enacted and are enforced motorcycle helmet laws (Falope 1991).
Ghana is one of the few developing countries that have a mandatory helmet law. This law was passed in 2004. Although many risk factors for crashes have been identified, such as alcohol use, driver fault, speeding, vehicle design, there has been little reported success in reducing motorcycle crash rates. The most successful injury prevention approach has been secondary— that is, reduction of the severity of injury after the crash and the secondary countermeasure most employed worldwide for this purpose has been motorcycle helmets.
2.3 Head injuries; a leading cause of death and disability
Injuries to the head and neck are the main cause of death, severe injury and disability among users of motorcycles and bicycles. In European countries, head injuries contribute to around 75% of deaths among motorized two-wheeler users; in some low-income and middle-income countries head injuries are estimated to account for up to 88% of such fatalities (WHO et al, 2006). The social costs of head injuries for survivors, their families and communities are high, in part because they frequently require specialized or long term care. Head injuries also result in much higher medical costs than any other type of injury (WHO et al, 2006), such that these injuries exert a high toll on a country’s health care costs and its economy. Globally, there is an upward trend in the number and use of motorcycles and bicycles, both for transport and recreational purposes. Indeed, most of the growth in the number of vehicles on the world’s roads comes from an increasing use of motorized two-wheelers. Asian countries, in particular, are expected to experience a considerable rise in the number of motorized two-wheeler vehicles on their roads. This rapid growth in the use of motorcycles in many low income and middle-income countries is already being accompanied by a considerable increase in the number of head injuries and fatalities that will only continue to increase if present trends continue.
In Ghana, Road Traffic Act 2004, Act 683 ensures the mandatory use of standard crash helmet, the sale of standard protective crash helmet and the extensive education campaign on helmet use by the National Road Safety Commission. Thus the National Road Safety Commission‘s ARRIVE ALIVE campaign lays emphasis on the wearing of crash helmet and despite the documented effectiveness of helmets, many motorcycle riders choose not to wear them. It has been observed that when enforcement by the police is strong, some cyclists wear helmets and some go to the extent of improvising just to avert the attention of the police. In some communities in the North, Upper East and Upper West regions, some riders go to the extent of painting huge calabashes to look like helmets. Studies show that countries where the use of helmet is not mandatory or if this rule was repealed the number of fatal injuries or death due to motorcycle crashes increased many fold. In Pakistan the use of helmet is a mandatory for
motorcycle riders however poor compliance is a major problem and failure to enforce on the part of the traffic police.
2.4: What is a Helmet?
A motorcycle helmet is a type of protective headgear used by motorcycle riders. The primary goal of a motorcycle helmet is motorcycle safety - to protect the rider's head during impact, thus preventing or reducing head injury or saving the rider's life. Some helmets provide additional conveniences, such as ventilation, face shields, ear protection, intercom etc. [Wikipedia, 2010]
2.5 Types of Helmets
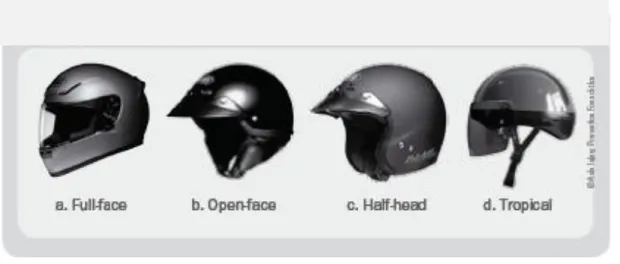
Full-face helmets (Figure 3.1a)
These helmets offer facial protection in addition to impact protection. Their principal feature is a chin bar that extends outwards, wrapping around the chin and jaw area. Extending above the jaw, there is a vision port that allows the wearer maximum range of sight, in line with the requirements for peripheral and vertical vision.
Open-face helmets (Figure 2.1b)
Open-face helmets give standard protection from impact with their hard outer shell and crushable inner liner. Compared to the full-face type, they offer only limited protection for the jaw and chin area. They may or may not have retractable visors to protect the eyes.
Half-head helmets (Figure 2.1c)
These helmets provide protection by means of a hard outer shell and a crushable inner liner. They do not offer protection for the chin or jaw area and are rarely equipped with visors. The half-head helmet may or may not have ear flaps attached to the retention system.
Helmets for tropical use (Figure 2.1d)
These are helmets specifically designed for South Asian and South-East Asian countries with extremely hot and humid climates. They are actually half-head helmets with ventilation holes to provide a maximum flow of air so as to reduce the heat. Their extreme lightness of weight is achieved by using semi-rigid vacuum-forming PVC material.
Fig. 2.1: Helmet Types (Source: WHO et al, 2006)
2.6 Laws and standards
Motorcycle helmets greatly reduce injuries and fatalities in motorcycle accidents, thus many countries have laws requiring acceptable helmets to be worn by motorcycle riders. These laws vary considerably, often exempting mopeds and other small-displacement bikes. In some countries, most notably the USA and India, there is some opposition to compulsory helmet use thus not all the States in the United Sates of America have a compulsory helmet law (wikipedia.org, 2010).
Worldwide, many countries have defined their own sets of standards that are used to judge the effectiveness of a motorcycle helmet in an accident, and define the minimal acceptable standard thereof. Among them are:
ACU (Auto-Cycle Union) Gold or Silver badge AS/NZS 1698:2006 (Australia and New Zealand) BSI (British Standards Institute) 6658
DOT FMVSS 218 (USA)[4] NBR 7471 (Brazil)
IS 4151 (India)
JIS T 8133:2000 (Japan)
Snell M 2005 "2005 Helmet Standard For Use in Motorcycling" SNI (Indonesia)
ECE 22.05 (Europe)[5]
The Snell Memorial Foundation has developed stricter requirements and testing procedures for motorcycle helmets with racing in mind, as well as helmets for other activities (e.g. drag racing, bicycling, horseback riding), and many riders in North America consider Snell certification a benefit when considering buying a helmet while others note that its standards allow for more force to be transferred to a rider's head than the U.S. Department of Transportation (DOT) standard. However, the DOT standard does not test the chin bar of helmets with them, while the Snell (and ECE) standards do.
In the United Kingdom, the Auto-Cycle Union (ACU) defines a stricter standard for racing than the legal minimum ECE 22.05 specification. Only helmets with an ACU Gold sticker are allowed to be worn in competition, or at track days. Many riders in the UK choose helmets with an ACU Gold sticker for their regular on-road use (wikipedia.org, 2010).
2.7 The Mechanism of Head Injuries
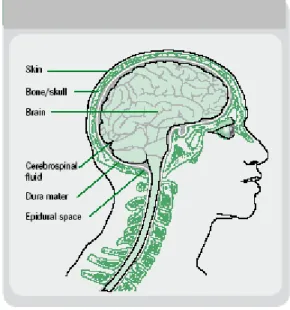
An appreciation of the anatomy of the head is important in understanding the mechanism of injuries to the head and brain (Figure 2.1). Briefly, the important anatomical information about the head to note is the following:
The brain is enclosed within a rigid skull.
The spinal cord passes through a hole in the underside of the brain.
Under the skull, adhering to the bones is a tough tissue called the dura that surrounds the brain.
Between the brain and the dura is a space containing cerebrospinal fluid that protects the brain tissue from mechanical shock.
The brain “floats” in the cerebrospinal fluid but it can only move about 1 millimeter in any direction.
The skull is covered by the scalp, which provides some additional protection.
Fig. 2.2: Structure of the head and brain (Source: WHO, 2006)
During a motorcycle or bicycle crash there are two principal mechanisms of injury to the brain: through direct contact and through acceleration–deceleration. Each mechanism causes different types of injuries.
When a motorcycle or bicycle is involved in a collision, the rider is often thrown from the cycle. If the rider’s head hits an object, such as the ground, the head’s forward motion is stopped, but the brain, having its own mass, continues to move forward until it strikes the inside of the skull. It then rebounds, striking the opposite side of the skull. This type of injury can result in anything from a minor head injury, such as concussion, to a fatal head injury. Head injuries that
result from either contact or acceleration–deceleration injuries are themselves divided into two categories: open or closed head injuries. Most traumatic brain injuries are the result of closed head injuries – that is, there is no open wound to the brain. ` Motorcycle riders who do not wear a helmet run a much higher risk of sustaining any of these head and traumatic brain injuries, or a combination of them. Helmets create an additional layer for the head and thus protect the wearer from some of the more severe forms of traumatic brain injury.
2.8 How a Helmet Works
A helmet aims to reduce the risk of serious head and brain injuries by reducing the impact of a force or collision to the head. A helmet works in three ways:
It reduces the deceleration of the skull, and hence the brain movement, by managing the impact. The soft material incorporated in the helmet absorbs some of the impact and therefore the head comes to a halt more slowly. This means that the brain does not hit the skull with such great force.
It spreads the forces of the impact over a greater surface area so that they are not concentrated on particular areas of the skull.
It prevents direct contact between the skull and the impacting object by acting as a mechanical barrier between the head and the object.
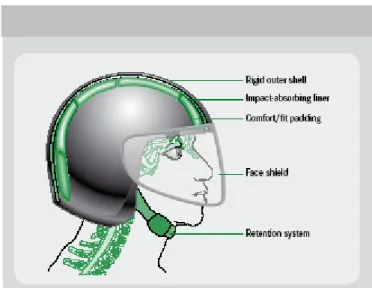
These three functions are achieved by combining the properties of four basic components of the helmet that are described below (Figure 2.3).
The shell
This is the strong outer surface of the helmet that distributes the impact over a large surface area, and therefore lessens the force before it reaches the head. Although the shell is tough, it is designed to compress when it hits anything hard. It provides protection against penetration by small, sharp and high speed objects and it also protects the padding inside the helmet from abrasions and knocks during daily use. These requirements mean that the shell must be hard, usually with a smooth exterior finish.
The impact-absorbing liner
This is made of a soft, crushable padded material – usually expanded polystyrene, commonly called “styrofoam”. This dense layer cushions and absorbs the shock as the helmet stops and the head tries to continue moving.
The comfort padding
This is the soft foam-and-cloth layer that sits next to the head. It helps keep the head comfortable and the helmet fitting snugly.
The retention system, or chin strap
This is the mechanism that keeps the helmet on the head in a crash. A strap is connected to each side of the shell. Chin and neck straps, which are specifically designed to keep the helmet on during an impact, must be correctly used for the helmet to function as it is designed to. A study in Malaysia examined the compliance of helmet use in a typical Malaysian town. Of the 5000 motorcyclists studied, only 54% used helmets properly, 21% used them improperly, and 24% did not wear them at all. Younger people, men and those with less formal education were more likely to not wear helmets properly.
Many helmet users do not secure their helmets properly – and sometimes not at all – thereby rendering the helmet of little – if any – value in the event of a collision
2.9 What Helmet Does Not Do
Helmets are designed to reduce the chances of head, brain, and facial injuries occurring, but are not designed to prevent injuries to other parts of the body. To reduce the likelihood of injuries to other parts of the body, the following strategies can be employed:
Appropriate clothing can be helpful to reduce other types of injuries (for example, jacket and trousers of particular materials which cover arms and legs the hands in the event of a crash)
Obeying the laws of the road, including adhering to speed limits and not driving
while drunk are behaviours that will reduce the chance of a motorcyclist being involved in a crash, and thus their likelihood of incurring any type of injury.
2.10 Motorcycle helmet design
In addition to meeting the previously described functions and conforming to standards, a helmet needs to be designed to suit the local weather and traffic conditions. The following are some of the considerations usually addressed by helmet designers:
Materials used in the construction of a helmet should not degrade over time, or through exposure to weather, nor should they be toxic or cause allergic reactions. Currently, the plastic materials commonly used are Expanded Poly-Styrene (EPS), Acrylonitrile Butadiene Styrene (ABS), Poly Carbon (PC) and Poly Propylene (PP). While the material of the helmet shell generally contains PC, PVC, ABS or fibre glass, the crushable liner inside the shell is often made out of EPS – a material that can absorb shock and impact and is relatively inexpensive. However, helmets with EPS liners should be discarded after a crash, and in any case users should replace such helmets after 3–5 years of use.
Standards often set the minimum coverage of a helmet (see Module 3). Half-head helmets offer minimal coverage. Full-face helmets should ensure that the wearer’s peripheral vision and hearing are not compromised.
To ensure that a helmet can absorb the shock of a crash, the crushable liner should be between 1.5 cm and 3.0 cm in thickness.
2.11 Helmet use is effective at reducing head injuries
Wearing a helmet is the single most effective way of reducing head injuries and fatalities resulting from motorcycle and bicycle crashes. Motorcyclists who do not wear helmets are at a much higher risk of sustaining head injuries and from dying from these injuries. In addition, riders who do not wear helmets place additional costs on hospitals , while the disability that results from these head injuries incurs costs at an individual, family (or carer) and societal level.
2.12 Hospital Costs Are Reduced By Helmet Use
Researchers in Michigan, USA, studied the impact of motorcycle helmet use on patient outcomes and cost of hospitalization. Despite Michigan’s mandatory helmet law, 19% of the 216 patients included in the study were not using helmets when they crashed, allowing the researchers to compare costs among helmeted and unhelmeted riders. On average, helmet use led to average hospital costs that were about 20%, or US$ 6000, less than costs for those who did not wear helmets. For patients who were treated on an inpatient rehabilitation floor after leaving the trauma unit, average costs for unhelmeted riders were nearly twice those of helmeted riders, in part due to the fact they were kept in hospital longer . The results also confirmed earlier findings that riders without helmets were younger, suffered more head and neck injuries, and had higher overall injury severity scores. Failure to wear a helmet adds to the financial burden created by motorcycle-related injuries. The authors concluded that individuals who do not wear helmets should therefore be required to pay higher insurance premiums (Brandt M et al. 2002).
2.13 Headwear Not Intended for Motorcycling
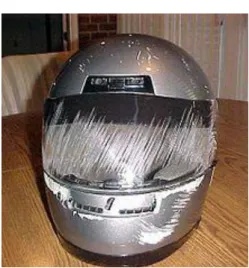
There are other types of headwear - often called "beanies," "brain buckets", or "novelty helmets", a term which arose since they cannot legally be called motorcycle helmets. These helmets are not certified and are generally only used to provide the illusion of compliance with mandatory helmet laws. Such items are often smaller and lighter than helmets made to DOT standards, and are unsuitable for crash protection because they lack the energy-absorbing foam that protects the brain by allowing it to come to a gradual stop during an impact. A "novelty helmet" can protect the scalp against sunburn while riding and - if it stays on during a crash - might protect the scalp against abrasion, but it has no capability to protect the skull or brain from an impact.
Fig: 2.5: Accident damaged helmet shows how the chain bar and face shield protected the user (Source: Wikipedia)
Fig: 2.6: A Shoei helmet which has been involved in an accident (Source: Wikipedia)
2.14 Standards Testing
Most motorcycle helmet standards use impacts at speeds between 4–7 m/s (9–16 mph). At first glance, this is confusing given that motorcyclists frequently ride at speeds higher than 20m/s (45mph). This confusion is relieved by understanding that the perpendicular impact speed of the helmet is usually not the same as the road speed of the motor cycle and that the severity of the impact is determined not only by the speed of the head but also by the nature of the surface it hits. For example, the surface of the road is almost parallel to the direction the motorcyclist moves in so only a small component of his velocity is directed perpendicular to the road while he is riding. Of course, other surfaces are perpendicular to the motorcyclist's
19
velocity, such as trees, walls and the sides of other vehicles. The other vital factor in determining the severity of an impact is the nature of the surface struck. The sheet metal wall of a car door may bend inwards to a depth of 7.5–10 cm (3.0–3.9 inch) during a helmeted head impact, meaning that it generates more stopping distance for the rider's head than the helmet itself. So a perpendicular impact against a flat steel anvil at 5m/s (11mph) might be about as severe as a 30m/s (67mph) oblique impact against a concrete surface or a 30m/s perpendicular impact against a sheet metal car door or windscreen. Overall, there is a very wide range of severity in the impacts that could conceivably happen in a motorcycle impact. Some of these are more severe than the impacts used in the standard tests and some are less so. (Wikipedia, 2010)
2.15 Public Awareness Campaign for Helmet Usage
Wear A Helmet. There Are No Excuses.” is the slogan of the Public Awareness Campaign (PAC) that strives to increase helmet-use rates and improve traffic safety knowledge throughout Vietnam, to decrease traffic accident fatalities and modify road safety behavior. The campaign is endorsed by many celebrities; including movie star Michelle Yeoh Formula 1 star Michael Schumacher, Football players Thanh Binh, Miss Vietnam 2006-2007 Mai Phuong Thuy and many others.
Fig. 2.7: Children playing in the street and wearing Protective Helmets Source:Asia Injury Prevention Foundation, 2006-2007)
The (PAC) includes billboards, postcards, concerts, fashion shows, and television commercials, all designed to focus on unsafe behaviors. The PAC currently is in phase III. Phase III of the PAC rounded out the message of Phase I and II, and responded to the changing dynamics of the road traffic safety public health crisis in Vietnam. In Phase I, the Campaign displayed graphic images of road accident survivors that portrayed the consequences of a severe road accident. During Phase II, PAC messages focused on habitual helmet use with the message: “Turn it on, put it on.” During Phase III, messages focusing on habitual helmet use were reinforced with television and outdoor advertising slogans “Wear a Helmet. There Are No Excuses.”
Contributions to the PAC can be arranged on an ad hoc basis and offers interesting opportunities for companies and other organizations to enhance and realize their corporate social responsibility.
Helmets for Kids (HFK) is a non-profit program distributing free quality safety helmets to needy primary school children. Sadly, children in Vietnam bear the brunt of the traffic safety crisis because they do not have access to proper safety equipment. In a society where the motorbike is the primary mode of transportation, children have become the most vulnerable passengers while riding with their parents. In response, AIPF initiated Helmets for Kids. Launched in 2000, this innovative program was the catalyst for government, nonprofit organizations, and corporate sponsors to work together to develop one of the most successful public-private partnerships devoted to saving the lives of children in the developing world. The program has distributed more than 260,000 child helmets to primary schools throughout Vietnam, Thailand, Laos and Cambodia and is now being expanded into Africa [AIPF Wear-a-Helmet English Site AIPF.mht, Asia Injury Prevention Foundation Copyright ©2006-2009 All Rights Reserved]
2.16... A National Helmet Law; Three Countries Report.
National mandatory helmet legislation for motorized two-wheelers (MTWs) is included in the Indian Motor Vehicles Act of 1988. Implementing the law, however, has been left to the states. Many states have yet to implement the legislation. In fact, in 1995 lobbying by opposition groups in the state of Karnataka led to the repeal of the helmet law. In Karnataka there are 42 million registered vehicles; 71 percent of these are motorized two-wheelers. The state capital, Bangalore, has 2 million registered vehicles, 75 percent of which are motorized two-wheelers. In 2004, over 6,000 deaths and 50,000 injuries resulted from road crashes in Karnataka. Of these, 40 percent were to riders and passengers of motorized two-wheelers. More than a third were brain injuries.
In the 10 years since repeal of the Karnataka helmet law, a considerable amount of effort has gone into bringing back the helmet law, including the following activities:
Raising awareness of the problem by making steadily rising death and injury data available to the public;
Raising awareness of the evidenceby publishing a report on the effectiveness of helmets and disseminating to government departments;
Campaigning by doctors who publicly endorsed helmet legislation;
Spreading information by highlighting the road safety situation in the state;
Issuing legal directives and in 2002, the High Court directed the state government to reintroduce helmet legislation;
Using the law courts to publicly question the absence of road safety measures including the lack of a helmet law;
Countering myths by using the media to dispel misconceptions about helmets, such as: that helmets are unnecessary at low speeds or for short distances, that riders wearing helmets are more careless, and that helmets cause neck injury; and
The combined effect of these efforts was a concerted move to tackle the lack of helmet use and increasing awareness among the public of road safety, helmet use in particular. As a result, in 2004 the Karnataka government proposed reintroducing the helmet law, setting a 45-day period for public comment. Guidelines are being developed to ensure the smooth implementation of the law and to evaluate its impact. Enforcement needs to be both visible and non-aggressive. Early results appear positive. Rates of helmet use rose from a low of under five percent to thirty percent within a few days of the new law being announced (WHO, 2004)
Iran has one of the highest rates of road traffic-related deaths in the world, and spends approximately US$ 6 billion a year on road traffic crashes. Motorcycles make up an increasing proportion of the country’s registered vehicles – about 40 percent in 2005. Over half of the road traffic crashes involve motorcyclists, with the risk of incurring a severe injury or fatality 10 times higher than for users of four-wheeled vehicles. Almost 70 percent of motorcycle deaths are from head injuries as a result of the non-use or improper use of helmets.
Although there has been a law for many years in Iran requiring that motorcyclists wear helmets, it was not until 2002 that it was seriously enforced. Beginning with the highways of the capital city, Tehran, traffic officials stepped up enforcement, increasing by a factor of 10 the fee for non-compliance of helmet use. At the same time, they launched a television campaign to raise awareness of the helmet law. As a result, helmet use increased from under 2 percent in 2002 to about 60 percent in 2004, and over 95 percent in 2005. The initiative was then taken to Iran’s other five major cities, with similar results.
In Iran’s many small towns the situation, however, was different. About half of all motorists drive unregistered vehicles and many motorcyclists lack a license. To increase helmet use in these towns, research was undertaken to study riders and their socioeconomic situation. The study found significant differences between motorcyclists in small towns and those in large cities. For 85 percent of the population of smaller towns, the motorcycle is the single family vehicle and 52 percent of motorcyclists rely on their vehicle to transport goods. Although 92
percent of motorcyclists surveyed owned a helmet, only 13 percent wore it, reflecting the high proportion – about 72 percent – who for some reason did not use the helmet.
Following this research, a three-year program was established between the Iranian government and the Karolinska Institute in Sweden. The Safe Community Program on Helmet Use would use various approaches to increase helmet use in urban areas. Five intervention cities would be compared to nine control cities receiving no intervention in order to evaluate the program. The intervention cities would receive the following:
An improved system of motorcycle registration and increased enforcement of motorcycle registration and driving licenses;
Incentives for helmet use and strict enforcement of the helmet law;
Identification and banning of defective motorcycles along with special incentives to repair motorcycles;
Public education on local helmet programs and safety education for children; Exhibitions and street carnivals to encourage helmet use;
Active collaboration of driving schools; and Motorcycle helmets at reduced prices.
The results of the study would help formulate interventions to increase helmet use in all parts of Iran but tailored to the particular needs of individual towns (WHO, 2004).
In October 2004, the South African government passed a law making it compulsory for all bicyclists to wear helmets. The regulation requires the use of a protective helmet that is properly fastened and fitted while riding a bicycle or being carried as a passenger. According to national road traffic crash data in South Africa, 270 cyclists were killed during 2004.
Despite this, less than a year after the law was passed, most South African cyclists still are not wearing helmets. Enforcement of the law is poor – a reflection of the difficulties in applying the national legislation at the local level – and an appropriate fine has not been determined.
Some traffic officials, interviewed about the new law, did not know it had been passed; others said there was a lack of public knowledge of the law in spite of considerable media coverage when it was passed. Even some cycling associations seem to have little awareness of it, although the South African Cycling Federation has now been enforcing international rules about helmet use in bicycle races and preventing cyclists from racing without a properly fitting helmet. In certain areas traffic officers are promoting the new law, but this is not the case across the whole country. Some officials are urging the national transport department to provide clear guidance on implementation of the legislation at the local level (WHO, 2004).
2.17 Helmet Law; an Infringement on Fundamental Human Rights
Most people argue that helmets are only good for a speed of up to 15-18 miles per hour. If one goes faster than this and gets an accident, the helmet will not save his/her life. It is a choice for each person to wear a helmet or not. A study reported in the American Journal of Public Health reveals that the abolishment of motorcycle helmet requirement for adults has been linked with a rise in motorcycle fatalities. Although the researchers’ argument is based on the universal helmet laws, the impact of these helmets is modest. Some anti-helmet law activists dispute that helmets that are on balance, reduce motorcycle safety. This is because they make riders reckless, make their heads heavy or impair their vision, sensitivity to pressure and hearing abilities change. However, there is no much evidence to support this claim. It does not seem to have a very big effect but in principle, the fatality rate should not matter. The right to ride with no a helmet should not center on around how huge the risk is. In addition to questioning how effective helmets are, motorcycle activists have suggested that helmets contribute to causing accidents because they impair hearing, increase fatigue and impair peripheral vision. When an accident occurs, the additional weight increases the risk of spine and neck injury. Most motorcycle riders have attested that helmets are an unsafe obstruction to vision.
The argument as to why motorcycle riders should wear helmets is not firm because of the Peltzman effect. Cyclists wearing helmets take the advantage of an increase in safety and in return take more risks. Some of these risks include cycling at high speeds and running red lights. In this view, helmets give cyclists the benefit to reach their destinations faster and this makes them less safe. It is not true that the use of helmets is only justified in cycling because it is more dangerous than driving or walking. The risks of cycling are almost the same as those of pedestrians. Wearing a helmet decreases the chances of getting brain injury, but increases the impact of the incidence on the thoracic and cervical spine fractures, which are sustained in motorcycle crashes. Helmets have been said to increase the risk of spinal fractures. When coming up with reasons not to wear a motorcycle helmet, comfort was a big topic of discussion. While buckling up a seat belt is painless for many people, wearing a motorcycle helmet is not. This is because the helmet is heavy and it covers most of the rider’s head. This can be sweaty and tiring especially when it is hot. When sitting on a spotlight under 100% humidity with the sun heating up so hard and heat coming off the road, one may even pass out. There have been reported cases of motorcycle riders passing out on the spotlights with their helmets on. Motorcycle helmets are viewed as stifling and confining meshes and forcing motorcycle riders to wear them ruins their freedom of experience. Helmets are believed to increase the chances of attaining severe injuries on the neck and offset the chance to have a brain injury. Most people argue that wearing motorcycle helmet and seat belts are a personal decision and should not be a state law made by government (Bikers of America, 2010)
CHAPTER 3
3.0 RESEARCH METHODOLOGY 3.1 Data Collection
3.2 Description of the Study Area
Northern Ghana includes the Guinea Savanna regions of the Northern, West and Upper-East regions. Geographically, Northern Ghana is an area that has been set apart from the rest of the country by climate, vegetation, ethnography, language, social, political and historical experience. The total land area for all the three regions is 97,539.9 sq. km. The Northern Region alone occupies about 70,250.1 sq km which is about a third of the total land area in the country. Most of the land area in the Northern region is flat with gentle slopes ranging from 1% to 5%.
Tamale is the capital of Northern region, occupying about 731 sq km with a population of 360,579 (population mongabay, 2007). The coordinates of the city is 9°24'6"N - 0°50'28"E. The area is characterized by relatively high temperatures of 24ºC and 38ºC since its northernmost point lies not more than 11.5º from the equator. Between May and October is the wet season, with an average annual rainfall of 750 to 1050 mm (30 to 40 inches). The dry season is between about November and April. The highest temperatures are reached at the end of the dry season, the lowest in December and January. However, the hot harmattan winds from the Sahara blow frequently between December and the beginning of February.
3.2.1 Road Network of Study Area
Tamale has a radial network system similar to that of Kumasi with all the roads converging at the Central Business District (CBD). The topography is generally flat with the road profile following the terrain. For the purpose this study the city was zoned into Central business district (≤ 1km radius from the city centre) and the out skirts (> 1km from the city centre).
3.3 General Research Approach
Objective 1: To establish the prevalence of motorcycle helmet usage for both the rider and the pillion rider and factors determining use or non – use of the helmet.
According to Schieber et al, 2001, overall, observational surveys are the best method to measure the outcome of interest—namely, helmet use. Observational surveys are more accurate, since recall or social desirability bias are not present. However, several key problems exist, especially (a) their cross-sectional design; (b) their inability to identify or classify demographic and other personal characteristics of riders; (c) the difficulty in selecting an unbiased sample of sites to observe riders; and (d) the resources needed and logistical problems associated with conducting observations. An observed rider may use a helmet only intermittently, so a single observation may not accurately reflect habitual use. Demographic data may not be collected for some riders, or may be misclassified. For example, it may be difficult to correctly estimate the cyclist’s age, given the variance in children’s height, weight, and sexual maturation.
Thus in order to measure helmet usage, the best approach is firmly oriented towards scientific observation, and toward field observation methods. Anyone who has worked with motorcycle riders and surveys knows the futility of asking a rider how far they have ridden recently, or almost anything else about their riding, and expecting an accurate answer. From this assumption, our bias is toward the field observation method: actual field counts of who is and who is not wearing a helmet.
Objective 2: To establish the level of awareness among motorcyclists of the benefits of using crash helmet.
Objective 3: To establish the perception of motorcyclists on the usage of crash helmets and the enabling legislature or regulation.
3.3.1 Observational Sites
Observational sites were randomly selected from national roads and urban roads. Helmet use was observed on the following roads:
Salaga road ( Town to Hospital Road, Hospital Road to Town) Bolga Road (Tamale to Bolga, Bolga to Tamale)
Techiman Road (Tamale to Kumasi, Kumasi to Tamale)
Taxi Station to Aboabo ( Tamale to Kumbugu, Kumbugu to Tamale)
3.3.2 Observational Study Design
Motorcycle helmet observations were conducted at vantage points on the above roads in the Tamale Municipality. The surveys were conducted on a weekday and one weekend (Friday and Saturday). Observations were conducted on days with fair weather conditions (non-rainy days) and on days that the police were not on patrol. It should be stated that no observations were conducted at night, because limited resources available and also relatively few people ride at night. This decision was arrived at upon studying existing twenty four hour vehicular traffic classification count collected by the Department of urban roads. The data indicated that vehicular traffic in general was lower from 11:00pm to 5:00 am. This data is made available at appendix F. The vantage points along observational sites/ roads included locations of traffic lights, speed humps etc.
Stationary observations were conducted for a period of 8 hours on each day. The morning session commenced at 8:00am and ended at 12 pm, and then afternoon session commenced at 2pm and ended at 6pm. The survey commenced on Thursday 25th March 2010 with a 12 hour master station count on the Salaga road; the actual observational surveys were conducted on the Friday 26th March 2010 and Saturday 27th March 2010. Two enumerators were assigned to each site, one for each direction of travel. To reduce the possibility of errors in recording, all manual count data were tallied at 15 minute intervals.
3.3.2 Attitudinal Survey
Motorcycle riders were randomly selected from service stations, bus stations, marketplaces and supermarket car parks. Motorcyclists who were unable to read and write will participate in a face-to-face interview to ascertain attitudes. Enumerators were recruited to assist in administering the questionnaires. They were briefed about the objectives of the survey, and this gave them an understanding into the quality of response required from respondents. It should be stated that no questionnaires were left with respondents for later collection. Only respondents who were ready to fill the questionnaires within the given period were given questionnaires and no incentives were added.
3.3.3 Sample size of Respondents to be considered
The following simplified formula by Glenn (1992) was adopted to calculate sample sizes;
2
1
Ne
N
n
Wheren is the sample size,
N is the population size and e is the level of precision required.
With an estimated target population of 400 to obtain assumed accuracies of 95% confidence interval and a 5% significance level required a minimum of 200 successful respondents.
3.3.4 Questionnaire Design
The questionnaire was designed to address the issues in objectives two and three of the research. Age distribution, motorcycle ownership as well as helmet use was considered. Gender and occupation of respondents were also considered. Respondents’ views were sought on the mandatory law requiring motorcyclist to wear helmet. They were asked to indicate whether or not they had heard any road safety education on the benefits of using a crash helmet. Those who had heard any road safety education on the benefits of using a crash helmet were asked to
indicate where they heard the safety education. The level of knowledge on road safety issues and practices regarding the benefits of using motorcycle crash helmet was also examined to ascertain the nature and extent of education acquired and required.
3.4 Data Coding and Analysis
Collected observational and attitudinal survey data was coded using Microsoft Excel. Using SPSS, version 16 (Statistical Package for the Social Sciences) a combination of descriptive and inferential statistics was used to analyze the survey data and interpret relationships between categorical variables of interest. A p value ≤ 0.5 was considered significant. Frequency and cross tabulation outputs were summarized and organized into tables for visual interpretation. (See Appendices for a breakdown of survey frequencies).
CHAPTER 4
4.0 RESULTS AND DISCUSSIONS 4.1 Master station counts.
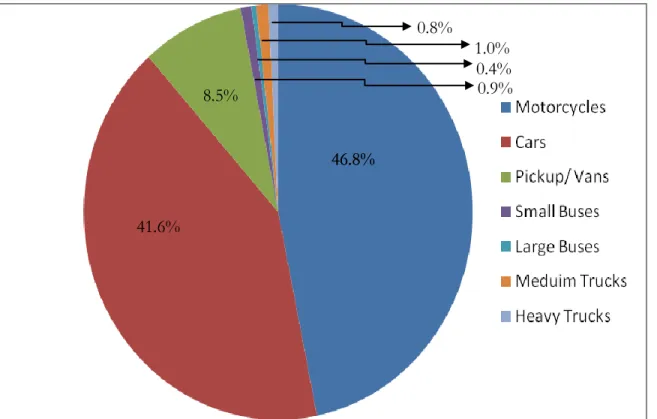
Below shows the results of a 12- hour master station count conducted on the Salaga Road (Hospital Road). The vehicle classification system adopted followed the format of the Department of Urban Roads. The figure shows that motorcycles constitute almost half of all the traffic mix. It should be noted that bicycle riders and bicycles were not observed in this survey as our interest was in motorized vehicles only.
Fig 4.1: Composition of Traffic Mix
46.8% 41.6% 8.5% 0.8% 46.8% 1.0% 0.4% 0.9%
4.2 Observational survey
A total of 47409 riders and 22384 pillion riders were observed on two successive days from 4 master stations authorized by the Department of Urban Roads in Tamale. Of the observed riders, 89.5% (42438) were men and 10.5% (4971) were women corresponding to a male: female ratio of 8.5:1. Among the 22384 pillion riders 70.8% were women (n=15846) and the remaining 29.2% were men (n=6538). In accordance with previous studies by Nguyen VT et al. (1985) most of the riders observed were males, indicating that more males use motorcycles than females. On the contrary, we observed more female pillion riders than male pillion riders and this is in conformity with prior studies conducted by Patricia Turneris et al. (2004)
The overall prevalence rate of motorcycle crash helmet use by riders was 20.3% (n=9633) compared with 6.9% (n=1536) for pillion riders. This is significantly lower than that for riders (P<0.0001). The prevalence rate of helmet use in Tehran, Iran, was 8.6% when a study was conducted in by Zargar et al. (1999-2000, 2006). This is much lower than the rate of 20.3% observed in Ghana-Tamale, however a prevalence rate of 20.3% is low compared to helmet use developed countries such as the United States of America, where in 2002, helmet use in Florida was observed at 52.7 %(Patricia Turner et al, June 2004). In this study we also found that pillion riders were less likely to wear helmets than motorcycle riders, and these results are consistent with those of other studies in developing countries such as Indonesia and China as well as in developed countries a confirmed by Hung et al, 2006. While the law requires both riders and passengers to wear helmets, the general belief for motorcyclist and pillion riders is that enforcement is for riders only although they agree that pillion riders should also wear helmets.
A comparison of helmet use rates among male and female riders indicated 20.3% (n=8603) and 20.7% (n=1030) respectively (P=0.5581). In contrast with other studies conducted by Patricia Turneris et al. (2004) the relationship between helmet use and gender was found not to be statistically significant. Female Pillion riders showed even lower prevalence rate of 5.7% (n=374) with their male counterparts indicating a prevalence rate of 7.3 %.( n=1162)
(P<0.0001). Hence the difference is significant, thus male pillion riders are more likely to wear a helmet than female pillion riders.
The overall rates of helmet use were highest at the Central Business District (CBD) with a prevalence of 23.8% (n=6284) as opposed to a prevalence of 15.9% (3349) at the outskirts, indicating that riders around the CBD were more likely to wear helmets than those in the outskirts (P=0.0001). This is statistically significant. Pillion riders in the CBD were three times more likely to wear helmets than those at the outskirts; both indicated a prevalence rate of 7.9% (n=1157) and 4.9% (n=378) respectively (P=0.0001) which is statistically significant. The difference in the prevalence of helmet use between district types indicates that helmet legislation, in combination with its enforcement, has an effect on the rates of helmet use. The observed variations in helmet use in the different districts suggest that law enforcement of helmet legislation is not consistent. The helmet wearing rate within the CBD was higher than on the outskirts of Tamale. This is due to the fact that enforcement within the CBD is stricter as compared to the outskirts (Conrad et al, 1996).
It is worth mentioning that at the CBD, rate of helmet use by male riders and female riders was 24.0% (n=5560) and 23.8% (n=724) respectively. However this is not statistically significant (P=0.8237). That for male pillion riders and female pillion riders was 20.1% (n=856) and 2.9 %( n=302) respectively, (P=0.0150). This is statistically significant and indicates that male pillion riders were more likely to use helmets in the CBD than their female counterparts. Prevalence rate of helmet use among male riders and female riders at the outskirts were 15.9 %( n=3043) and 15.6% (n=306) respectively, (P=0.7542). This is not statistically significant.
Rate of helmet was affected by time of day. The data between 8.00am and 12.00pm indicated a use of 21.3% (n=5160), where as a use of 19.3% (n=4473) was observed between the hours of 2pm - 6pm. During the early hours of the day (8.00am to 12.00pm) more riders are likely to wear helmets than between 2.00pm-6.00pm (P=0.0001). In accordance with other studies (Conrad et al, 1999) time of day affects helmet use. More riders are likely to wear helmet in the
early hour of the day than in the afternoon. This could be attributed to the warm weather in Northern Ghana. It should be mentioned that the survey was conducted in the month of March which happens to be the hottest period in the Northern part of Ghana. Thus riders are more likely to decline the use of helmets. While we do not have any data to confirm this, it is consistent with our other data to suggest that this may be at least in part due to the perception of less police surveillance in some locations after 14.00 hours. Perhaps, had our observational study continued beyond 20.00 hours, it is conceivable that as night fell we would have observed continuing decreases in helmet use.
During our investigation, we observed that carrying of children pillion riders on motorcycles was very common. A significant number of children went to school on motorcycles and we observed that most of these children pillion riders were not wearing helmets. This heightens the potential vulnerability of children pillion riders and the possibility of injuries or even death in the event of a motorcycle crash. With very limited resources available to us, we could not specifically group our subjects of observation into children and adults hence we do not data particularly on the number of children pillion riders who rode without helmets.
4.3 Attitudinal Survey
4.3.1 Characteristics of respondents
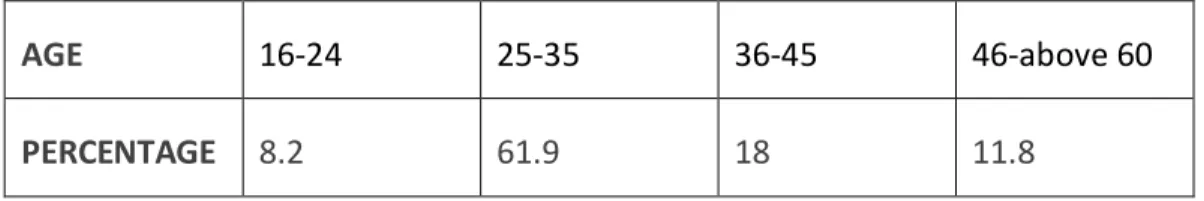
One hundred and ninety four (194) respondents responded to the 200 questionnaires administered. The respondents comprised 20.1% self employed people (shop owners, petty traders, tailors, seamstresses, taxi drivers, mechanics, electricians, etc), 2.1% agricultural activities (i.e. farmers, animal husbandry ), 2.6% Unemployed, 34% students, 6.7% teachers and 34.5% government workers. In all 22.7% of respondents were females and the remaining 77.3% were males giving a male to female ratio of 3.4: 1. The age distribution of the respondents is as shown in Table 4.1. The dominant age group of respondents is 25-35years and the least dominant is above 60 years, each contributing 61.9% and 0.5% respectively. Being the least dominant age group, respondent(s) in age group above 60 years were added to the age group
above 46-60 years. In this report, this age group may be represented by 46-60years or 46-above 60 years.
Table 4.1: Age distribution of respondents
AGE 16-24 25-35 36-45 46-above 60
PERCENTAGE 8.2 61.9 18 11.8
4.3.2 Overall response
In total, 78.4% (n=152) of respondents owned the motorcycle they were riding and 21.6% (n=42) did not own the motorcycles, however all respondents were included in the analysis. Overall helmet ownership was 72.7% (n=141) and 16% of the respondents claimed they had helmets for pillion riders. This claim cannot be substantiated, in that some respondents were not having their helmets at the time of the interview. They however claimed that they always carried their helmets with them but forgot to do so on that particular day. Others said that they were just riding to the service station to buy fuel and that they were not riding for a long distance and so left their helmets at their shops/work places.
The respondents were asked how often they wore a helmet when riding, 38.1% (n=74) indicated that they always used helmets when ever they rode motorcycles, 46.4% (n=90) indicated that they sometimes wore helmets, 11.9% (n=23) indicated not at all and 3.6% indicated that they wore helmets only when they were riding for a long distance, say outside Tamale or to a nearby village. In this study we used the conservative approach, defining helmet use as “always use” and defining non-use as all other categories. We accept the premise that self-reported use overestimates observed use (Schieber et al, 2001). Thus overall helmet use obtained as a result of this survey is 38.1% which is higher than the overall helmet use as a result of the observational survey. This goes to buttress the fact that self-reported use overestimates observed. It is also clear that respondents being aware of the law may have overstated their level of compliance.
Hence in the future it is advised that in order to estimate helmet use observational survey should be conducted.
Seventy four point seven percent (74.7 %, n=145) of the respondents indicated that the reason why they wore helmet was that it is for their own safety. Those who wore helmet to save them from the police were 10.3% (n=20). Riders who indicated they wore the helmet to protect themselves from wind and dust were 4.1% (n=8) and 8.8% indicated that they wore helmet when riding for a long distance, say to the next town. 2.1% (n=4) of the respondents wore the helmet for no reason at all. Respondents, who indicated that they wore helmets when they were riding for a long distance, say to the next town, showed the lack of stringent enforcement when riding at the outskirts.
It was encouraging to find out that 74.7% of those who claimed they used helmet indicated that they used it for their own safety. This shows that people have some knowledge on the benefits of using crash helmet but decline to use them when riding.
Sociologists often differentiate internalized from external social control. External control relies on sanctions, such as law, moral persuasion or peer pressure, to enforce norms. Control is internalized when norms are adhered to because of beliefs, conscience or shared understandings. Our results suggest that high prevalence of helmet use in Ghana would overwhelmingly be regulated by external controls. While it is true that external controls can eventually promote internal controls, we postulate in this case that more external control could lead to more token compliance. We agree that more police enforcement would probably increase helmet use, but suggest that police surveillance alone could never be enough to assure compliance. Studies have shown that a law enforcement strategy alone leads to token compliance, which does not in itself increase safety and protection (Conrad et al, 1999). Thus educating the general public on the importance of helmet should be intensified as well.
When the opinion of respondents was sought on whether or not pillion riders should wear helmets when riding; 95.9% (n=186) indicated yes whilst rest indicated no.
The questionnaire suggested a number of possible reasons for not wearing a helmet, expensiveness was mentioned as a factor by 8.3% (n=10), 18.3% (n=22) attributed it to forgetfulness, 2.5% (n=3) indicated that it would be of no help in the event of an accident whilst 71.3% indicated that helmets are uncomfortable. It should be noted that the sample space for this analysis is less those who earlier on indicated that they always wore helmets, hence N=120. Our study shows that for riders who were not using a helmet a significant number indicated that they felt uncomfortable and went on to say that helmets were warm and heavy. Previous studies reveal that motorcyclists also complain of warm weather and reduced view due to the existing designs of helmets (Ahmed et al., 2007). Research needs to be done to create a better design that weighs less and is of standard but affordable to the masses. The study also revealed that most of those who do not own helmets attributed it to the fact that they did not ride very often whilst others said helmets were unnecessary.
The questionnaire inquired from respondents the reason for not owning a helmet, the 72.7% (n= 141) respondents who indicated they owned helmets met the exclusion criteria for the analysis of this question and three applicants failed to respond to this question. Thus in all N=50. Six percent (6%, n=3) of the respondents indicated that they did not like helmets, whilst 20% (n=10) indicated that helmets were uncomfortable. 10% (n=5) and 36 % (n=18) of the respondents indicated that ‘helmets are unnecessary’ and they ‘do not ride very often respectively. The expensive factor was indicated by 14% (n=7) of respondents whilst 2% (n=1) indicated that helmets were not attractive. The remaining 12% (n=6) indicated more than one reason for not owning a helmet with the factor of uncomforting dominating in all these responses
Respondents were questioned on their knowledge of the mandatory helmet law in Ghana. Overall, 94.8 % (n=184) responded in the affirmative and 83% (n=161) agreed that wearing of
helmet whilst riding a motorcycle should be mandatory. An encouraging finding of the study is. This finding is very important as it gives an idea regarding how agreeable riders are to the existing legislation. Riders readily agreeing that the use of crash helmet should be mandatory is an indication of their knowledge of the benefits of using them.
When asked whether respondents had heard some education/ campaign about the use of helmets, 86.1% (n=167) indicated they had. The respondents who had heard some road safety education/campaigns were asked the place or media through which they heard them. Respondents were given the option to option to choose as many places or media applicable to them. The most popular media are radio and television. Please refer to appendix A for detailed results.
The study revealed that a significant 81% of the respondents had heard some road safety education/campaign on the use of crash helmet. Thus 19%of the respondents had no information on the benefit and use of crash helmets. The most popular media of education were the radio and television. Some education had also taken place in mosques, churches and schools. In all the respondents without any formal education made up 2.6%, indicating that the rest of the 97.4% have had some basic education. Assuming all 2.6% of the respondents without basic education indicated that they had not heard any road safety education on the use of crash helmets, the rest of the 16.4% making up the 19% are from those who have had some formal education. This goes a long way to show that if not today, sometime ago, our school curriculum inculcated minimal or no traffic rules at the early stage of education.
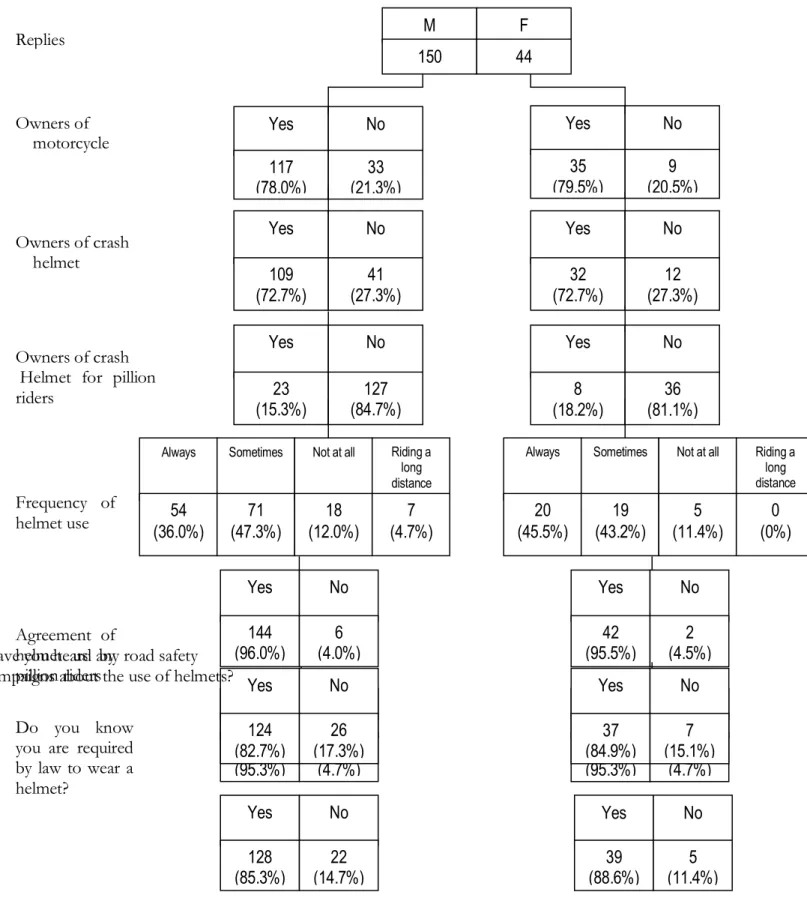
4.3.3 Association of Gender with Helmet Use
Out of the 194 respondents, 22.7% (n=44) were females and the remaining 77.3 %( n=150) were males. Ownership of motorcycles for Female and male respondent was 79.5% (n=35) and 78% (n=117) respectively. Both male and female respondents indicated a crash helmet ownership of 72.7% (P=0.994). A significant number of respondents indicated that pillion riders should wear helmets when riding (95.5%. of female respondents and 96% of male respondents). However
only 15.3% (n=23) of male respondents and 18.2% (n= 8) of female respondents owned a crash helmet for a pillion rider, (P=0.654). All riders were asked if they wore helmets ‘always’, ‘sometimes’, ‘not at all’, ‘when riding for a long distance’, nearly half of the females (45.5%, n=20) and 36% of male riders ‘always’ wore their helmets, as indicated in Table 4. 2. (P=0.393). It was inquired from respondents whether they had heard any road safety education/campaigns; as shown in Fig. 4.1 , 85.3% of males responded in the affirmative, and so did 88.6% of females. In all 20.5% and 26.7% of females and males respectively had heard road safety education/campaign on radio, whilst 11.4% and 10.7% of females and males respectively had heard road safety education/campaign on television. Some respondents indicated that they had heard education/campaign on more than one media; 25.0% and 21.3% of females and males respectively chose radio and television (P=0.704). Refer to appendix B for detailed results.
Respondents were asked to indicate from suggested reasons why they used helmet. Respondents could choose as many reasons as applicable to them. 61.4% and 52.7% of females and males respectively indicated that they wore helmets for their own safety, and 11.4% and 10.0% of females and males respectively also indicated that they wore helmets to save them from the police. 10.7% of males indicated that they wore helmets when riding for a long distance whilst their female counterparts indicated 2.3% for the same reason. Please refer to appendix A for detailed results.
From the above p values one can conclude that association of gender with helmet use is not significant.