Improving Drupal’s page loading performance
Wim Leers
Thesis proposed to achieve the degree of bachelor
in computer science/ICT/knowledge technology
Promotor
: Prof. dr. Wim Lamotte
Co-promotor
: dr. Peter Quax
Mentor
s: Stijn Agten & Maarten Wijnants
Hasselt University
Academic year 2008-2009
Abstract
This bachelor thesis is about improving Drupal’s page loading performance through integrating Drupal with a CDN. Page loading performance is about reducing the time it takes to load a web page. Because reducing that time also reduces the time required to access information, increases the number of satisfied visitors, and if the web site is commercial, it increases revenue. Before you can prove that improvements are made, you need a tool to measure that. So first, a comparison is made of available page loading performance profiling tools (and related tools). Episodes is chosen because it is the only tool that measures the real-world page loading performance. This requires tight integration with Drupal though, so a module was written to integrate Episodes with Drupal. A companion module to visualize the collected measurements through basic charts was also written.
Next, a daemon was written to synchronize files to a CDN (actually, any kind of file server). It was attempted to make the configuration as self-explanatory as possible. The daemon is capable of processing the file before it is synced, for example to optimize images or compress CSS and JavaScript files. A vari-ety of transporters (for different protocols) is available to transport the file to file servers. According to the configuration file, files are detected through the operating system’s file system monitor and then processed and transported to their destination servers. The resulting URLs at which the files are available are stored in a database.
Then, a Drupal module was written that makes it easy to integrate Drupal with a CDN (both with and without the daemon). A patch for Drupal core had to be written to make it possible to alter the URLs to static files (CSS, JavaScript, images, and so on). To make this functionality part of the next version of Drupal core, a patch for that version was also submitted.
Finally, a test case was built. A high-traffic web site with a geographically dispersed audience was migrated to Drupal and the Episodes integration was enabled. The first period, no CDN integration was enabled. Then the daemon was installed and CDN integration was enabled. Files were being synced to a static file server in Belgium and a North-American CDN, and visitors were assigned to either one, based on their geographical location. This second pe-riod, with CDN integration enabled, was also measured using Episodes and conclusions were drawn from this.
Preface
When I wrote a custom proposal for a bachelor thesis, it was quickly approved by my promotor, Prof. dr.Wim Lamotte. I would like to thank him for making this bachelor thesis possible. He also approved of writing this thesis in the open, to get feedback from the community and to release all my work under the GPL, which will hopefully ensure it will be used. I have worked to the best of my abilities to try to ensure that my work can be used in real world applications. During the creation of this bachelor thesis, I have often received very useful feedback from my mentors, Maarten Wijnants and Stijn Agten. My sincere thanks go to them. I would also like to thank dr. Peter Quax, co-promotor of this bachelor thesis.
I would also like to thank Rambla and SimpleCDN for providing free CDN accounts for testing and SlideME for providing feedback on my work.
Finally, I would like to thank my parents and my brother, whose support has been invaluable.
Dutch summary/Nederlandstalige samenvatting
Het doel van deze bachelorproef is het verbeteren van de “page loading perfor-mance” van Drupal.Drupal is een systeem om websites mee te bouwen en is bedoeld voor zowel ont-wikkelaars als eindgebruikers: het voorziet zowel uitgebreide API’s als een rijk ecosysteem aan kant-en-klare modules, die kunnen gedownload en ge¨ınstalleerd worden in minder dan een minuut. Het is geschreven in PHP, omdat die taal op de meeste servers beschikbaar is en ´e´en van de doelstellingen van Drupal is om op zoveel mogelijk servers te werken. Zo is het aantal potenti¨ele gebruikers het grootst, want het maakt het gebruik van Drupal goedkoper. Drupal is er ook op gericht om zoveel mogelijk te innoveren en om de laatste trends te volgen — of er op vooruit te lopen. Het is een volwassen open source software project dat wordt gebruikt door vele bekende instanties, waaronder de Belgische overheid, Disney, de NASA, Harvard university en de Verenigde Naties.
Honderdduizenden websites gebruiken Drupal. Het verbeteren van de page loa-ding performance van Drupal kan dus een effect hebben op een groot aantal websites. Een van de meest effectieve methodes om de page loading perfor-mance te verbeteren, is het gebruik van een CDN.
Een CDN is een verzameling van webservers die verspreid staan over meerdere locaties om gegevens effici¨enter af te leveren bij gebruikers. De server die geselec-teerd wordt om gegevens aan een specifieke gebruiker te leveren wordt meestal gedaan op basis van de afstand in het netwerk, waarbij dichterbij beter is. Er zijn twee soorten CDN wat betreft het plaatsen van bestanden op de CDN: push en pull. Pull vereist vrijwel geen werk: URLs moeten aangepast worden, waarbij de domeinnaam van de CDN geplaatst wordt waar voorheen de do-meinnaam van de website stond. De CDN downloadt dan vanzelf de bestanden die het moet verzenden aan de gebruiker van de server van de website. Dit wordt de Origin Pull techniek genoemd. Anderzijds zijn er ook CDNs die een push-mechanisme ondersteunen, waarbij door middel van bijvoorbeeld FTP de bestanden op de CDN kunnen geplaatst worden. De CDN downloadt dus niet vanzelf de bestanden, die moeten er door de eigenaar van de website op ge-plaatst worden.
Mijn doelstelling was om drie soorten CDN’s te ondersteunen: 1. iedere CDN die Origin Pull ondersteunt
2. iedere CDN die FTP ondersteunt
3. Amazon S3/CloudFront, dit is een specifieke CDN met een eigen protocol. Omdat deze zo populair is, heb ik er voor gekozen om deze ook expliciet te ondersteunen.
Dit lijken de de drie meest gebruikte soorten CDN’s te zijn.
Page loading performance gaat over het minimaliseren van de tijd die nodig is om een webpagina in te laden. Want snellere websites betekent tevredenere be-zoekers die vaker terugkomen en, indien je website commercieel is, meer omzet.
Zo wezen bijvoorbeeld tests van Google uit dat een halve seconde extra tijd om zoekresultaten te laden, een vermindering van twintig procent van het aantal zoekacties met zich meebracht. Amazon merkte dat iedere honderd milliseconde aan extra tijd om een webpagina in te laden in een daling van ´e´en procent van het aantal verkopen resulteerde. Als je dan nog weet dat het helemaal niet uit-zonderlijk is om laadtijden van vijf seconden en meer te hebben, wordt al snel duidelijk dat de impact groot kan zijn.
Om te garanderen dat mijn pogingen om de page loading performance van Drupal te verbeteren, was het echter noodzakelijk om de resultaten te kunnen meten. Na het analyseren van een brede waaier aan page loading performance profiling tools (en gerelateerde tools), werd het al snel duidelijk dat Episodes (dit was slechts een prototype, geschreven door Steve Souders — dit is de persoon die het fenomeen page loading performance en het nut van het optimaliseren ervan, bekend heeft gemaakt) was de beste kandidaat: het is de enige tool die de mogelijkheid heeft om de w´erkelijke page loading performance te meten, omdat het metingen doet in de browser van iedere bezoeker van de website, bij iedere paginaweergave. De gemeten episodes worden door middel van een GET request en een uitgebreide query string naar een Apache server gelogd naar een Apache log. Deze tool heeft bovendien ook het potentieel om d´e standaard te worden in de loop van de komende jaren. Het is zelfs niet ondenkbaar dat het ingebouwd zal worden in toekomstige browsers.
Om het te gebruiken in mijn bachelorproef, heb ik de code opgekuist en het klaar gemaakt (of tenminste bruikbaar) voor gebruik op een Drupal website, via een nieuwe Drupal module: de Episodes module. Deze integratie gebeurt op zo’n manier dat alle “Drupal behaviors” (dit zijn alle JavaScript “behaviors” (gedragingen) die gedefinieerd worden door middel van een vastgelegde Drupal JavaScript API) automatisch worden gemeten. Alles dat de eigenaar van de website moet doen, is enkele veranderingen in zijn Drupal “theme” (letterlijk: thema, het design van de website dus) aan te brengen om er voor te zorgen dat al dat wat kan gemeten worden, ook effectief gemeten wordt.
Deze module is klaar voor gebruik in productie.
Ik heb tevens een bijbehorende Episodes Server module gemaakt. Via deze mo-dule is het mogelijk om de logs die verzameld zijn door middel van Episodes te importeren en de metingen te visualiseren door middel van grafieken (ge-genereerd aan de hand van Google Chart API). Dankzij deze grafieken kan je de werkelijke page loading performance over een tijdspanne evalueren. Het is zelfs mogelijk om de page loading performance van meerdere landen tegelijk te vergelijken met de globale page loading performance. Het laat je ook toe om te zien welke episodes momenteel het langst duren en dus het best geschikt zijn voor optimalisatie.
Deze module is nog niet klaar voor gebruik in productie, maar het is een goede basis om van te beginnen. De code die de logs in de database importeert, werkt gegarandeerd dankzij unit tests.
Dan is er natuurlijk de daemon om bestanden te synchroniseren. Dit was het belangrijkste deel van deze bachelorproef. Hoe raar het ook mag lijken, er lijkt niets vergelijkbaar te bestaan, of tenminste niet publiekelijk beschikbaar (zelfs geen commerci¨ele programma’s). Als het zou bestaan, zou ik het zeker al ver-nomen hebben van een van de tientallen mensen die op de hoogte zijn van het
concept en doel van mijn bachelorproef.
Ik ben begonnen met het ontwerp van het configuratiebestand. De configuratie van de daemon gebeurt door middel van een XML bestand dat is ontworpen om gemakkelijk te zijn in gebruik, op voorwaarde dat je bekend bent met de termi-nologie. Verscheidene mensen die zich thuis voelen in de terminologie werden gevraagd om een voorbeeld configuratiebestand te bekijken en ze antwoordden meteen dat het logisch in elkaar zat. Het is belangrijk dat dit gemakkelijk is, want het is de interface naar de daemon toe.
De daemon werd gesplitst in grote componenten en ik ben begonnen met de eenvoudigste, omdat ik dit zou schrijven in Python, een taal die ik nooit eerder had gebruikt. Ik heb voor deze taal gekozen omdat volgens de geruchten het je leven als programmeur een stuk makkelijker zou maken, deels dankzij de be-schikbaarheid van modules voor vrijwel alles dat je je kan inbeelden. Gelukkig bleek dat grotendeels waar te zijn, hoewel ik wel lange tijd gevreesd heb dat ik alle code voor het transporteren van bestanden (transporters) zelf zou moeten gaan schrijven. Dat zou een vrijwel onmogelijke opdracht geweest zijn, gegeven de hoeveelheid tijd.
Dit is dan ook de reden waarom de daemon eigenlijk eenvoudigweg een verza-meling Python modules is. Deze modules kunnen in eender welke applicatie gebruikt worden, bijvoorbeeld de fsmonitory.py module — die bestandssys-teem monitors op verschillende besturingssystemen abstraheert en zo een cross-platform API cre¨eert — kan makkelijk hergebruikt worden in andere applicaties. Dus heb ik een relatief grote verzameling Python modules geschreven: config.py,
daemon thread runner.py, filter.py,fsmonitor.py (met een subclass voor
ieder ondersteund besturingssysteem),pathscanner.py,persistent list.py,
persistent queue,py, processor.py (met een verzameling subclasses, ´e´en
voor iedere processor) entransporter.py(met subclasses die zeer dunne wrap-pers rond Django custom storage systems zijn). Telkens indien het haalbaar was, heb ik unit tests geschreven. Maar omdat er in deze applicatie veel be-stand I/O en netwerk I/O aan te pas komt, was dit vaak extreem complex om te doen en dus overgeslagen, ook omdat de hoeveelheid beschikbare tijd be-perkt was. Voorfsmonitorondersteuning in Linux kon ik verder bouwen op de
pyinotifymodule en voor de transporters zag ik de mogelijkheid om Django’s
custom storage systems geheel te hergebruiken, waardoor ik zonder al te veel moeite ondersteuning heb voor FTP, Amazon S3 en “Symlink or Copy” (een speciaal custom storage system, om verwerkte bestanden ook te kunnen syn-chroniseren met Origin Pull CDNs). Django is een framework om websites mee te bouwen (in tegenstelling tot Drupal is het ´enkel geschikt voor developers) en daarvan heb ik dus ´e´en API (en zijn dependencies) hergebruikt. Het gevolg is dus dat veranderingen die gemaakt worden aan de transporters in de daemon, weer kunnen worden teruggegeven en vice versa. Ik heb enkele bugfixes door-gegeven die reeds goed bevonden zijn en nu dus deel uitmaken van die code. Dit heeft een interessant neveneffect: arbitrator.py, de module die al deze op zich zelf staande modules samenbindt tot ´e´en geheel (die dus arbitreert tussen de verscheidene modules), kan eenvoudig compleet gerefactored worden. Hoe-wel het bijna duizend regels code is (maar veel regels daarvan zijn commentaar), kan men eenvoudig de hele arbitrator herschrijven, omdat het enkel logica bevat die de losse modules aan elkaar linkt. Dus indien er bijvoorbeeld een bottleneck zou gevonden worden die zich enkel in bepaalde situaties voordoet omwille van een fout in het ontwerp van de arbitrator, kan dit relatief eenvoudig opgevangen
worden, omdat alle logica van de daemon in een enkele module zit.
Omdat het onmogelijk is om zeker te zijn dat de daemon correct en betrouwbaar werkt in iedere omgeving en iedere mogelijke configuratie, is het aan te raden dat een bedrijf eerst haar use case simuleert en verifieert dat de daemon zoals ge-wenst functioneert in die simulatie. Hopelijk trekt dit project voldoende mensen aan die er aan werken om het verder geschikt te maken voor meer situaties. Een Drupal module om de integratie met CDNs te vereenvoudigen werd ook geschreven: de CDN integratie module. Echter, voordat deze kon geschreven worden, was het nodig om een patch voor Drupal core te schrijven, omdat het nodig is om de URLs naar bestanden te kunnen aanpassen. Indien deze URLs niet aanpasbaar zijn (zoals het geval is voor Drupal 6), kunnen ze ook niet aan-gepast worden om naar een CDN te verwijzen.
Een patch voor Drupal 7 (deze versie van Drupal is momenteel in ontwikkeling) — met unit tests want dat is een vereiste — om deze functionaliteit deel te la-ten uitmaken van Drupal in de toekomst, heeft zeer positieve reviews gekregen, maar moet nog steeds door het minutieuse peer review proces gaan. Het is zeer waarschijnlijk dat het binnenkort gecommit zal worden.
Er zijn twee modi beschikbaar in de Drupal module: eenvoudig en geavanceerd. In de geavanceerde modus kan enkel gebruik gemaakt worden van Origin Pull CDN’s. Maar omdat het gebruiken van dit soort CDN’s nu zeer eenvoudig wordt dankzij deze module, terwijl het vroeger een reeks manuele stappen vereiste, is dit alleen al erg nuttig. Echter, in de geavanceerde modus wordt het pas echt interessant: dan wordt de database van gesynchroniseerde bestanden gebruikt die door de daemon werd aangemaakt en wordt onderhouden. Dan wordt de URL van een bestand op de CDN opgezocht, waarna deze URL wordt gebruikt. Het is zelfs mogelijk om een speciale callback functie te implementeren die kan gebruikt worden om een specifieke server te selecteren, op basis van de eigen-schappen van de gebruiker (locatie, type lidmaatschap of wat dan ook). Deze module is ook klaar voor gebruik in productie.
De feedback van bedrijven was teleurstellend wat betreft de hoeveelheid maar overweldigend positief. Op meer positieve feedback zou ik niet gehoopt kunnen hebben. Het potentieel van de daemon werd sterk gewaardeerd. De codestruc-tuur van de daemon werd beschreven als “duidelijk en zelfverklarend” en de documentatie (van de daemon zelf en de beschrijving ervan in de bachelorproef tekst) als “zeer duidelijk”. Het zorgde er blijkbaar zelfs voor dat een reviewer er spijt van kreeg dat hij zijn bachelor graad niet voltooid heeft. Deze reviewer was zelfs zo enthousiast dat hij al begonnen was met het schrijven van patches voor de daemon, zodat die beter inzetbaar was in zijn infrastructuur. Dit suggereert dat het mogelijk haalbaar is dat de daemon een levendig open source project wordt.
Ten slotte bevestigden de resultaten van mijn test case de stelling dat het inte-greren van Drupal met een CDN de page loading performance kan verbeteren. Hoewel de resultaten (die gelogd worden door middel van de Episodes module) niet zo expliciet waren als ze zouden kunnen geweest zijn voor een website rijk aan media (mijn test case was een website die arm was aan media), was het verschil nog steeds duidelijk te onderscheiden in de grafieken (die gegenereerd werden door de Episodes Server module). Ondanks het feit dat de website al
geoptimaliseerd was aan de hand van de mechanismen die standaard in Drupal aanwezig zijn, resulteerde de integratie met een CDN (via de CDN integratie module en de daemon) in een duidelijke algemene wereldwijde verbetering van de page loading performance.
Contents
1 Terminology 1 2 Definition 3 3 Drupal 4 4 Why it matters 6 5 Key Properties of a CDN 7 6 Profiling tools 9 6.1 UA Profiler . . . 9 6.2 Cuzillion . . . 9 6.3 YSlow . . . 10 6.4 Hammerhead . . . 12 6.5 Apache JMeter . . . 14 6.6 Gomez/Keynote/WebMetrics/Pingdom . . . 156.6.1 Limited number of measurement points . . . 15
6.6.2 No real-world browsers . . . 15
6.6.3 Unsuited for Web 2.0 . . . 16
6.6.4 Paid & closed source . . . 16
6.7 Jiffy/Episodes . . . 16
6.7.1 Jiffy . . . 16
6.7.2 Episodes . . . 17
6.8 Conclusion . . . 20
8 Improving Drupal: Episodes integration 22
8.1 The goal . . . 22
8.2 Making episodes.js reusable . . . 24
8.3 Episodes module: integration with Drupal . . . 25
8.3.1 Implementation . . . 25
8.3.2 Screenshots . . . 27
8.4 Episodes Server module: reports . . . 30
8.4.1 Implementation . . . 30
8.4.2 Screenshots . . . 31
8.4.3 Desired future features . . . 31
8.5 Insights . . . 33
8.6 Feedback from Steve Souders . . . 34
9 Daemon 35 9.1 Goals . . . 35
9.2 Configuration file design . . . 37
9.3 Python modules . . . 38
9.3.1 filter.py . . . 38
9.3.2 pathscanner.py . . . 40
9.3.3 fsmonitor.py . . . 41
9.3.4 persistent queue.py and persistent list.py . . . 43
9.3.5 Processors . . . 44
9.3.6 Transporters . . . 48
9.3.7 config.py . . . 52
9.3.8 daemon thread runner.py . . . 53
9.4.1 The big picture . . . 53
9.4.2 The flow . . . 54
9.4.3 Pipeline design pattern . . . 56
9.5 Performance tests . . . 59
9.6 Possible further optimizations . . . 60
9.7 Desired future features . . . 60
10 Improving Drupal: CDN integration 61 10.1 Goals . . . 61
10.2 Drupal core patch . . . 62
10.3 Implementation . . . 63
10.4 Comparison with the old CDN integration module . . . 63
10.5 Screenshots . . . 64
11 Used technologies 70
12 Feedback from businesses 71
13 Test case: DriverPacks.net 74
1
Terminology
above the fold The initially visible part of a web page: the part that you can see without scrolling
AHAH Asynchronous HTML And HTTP. Similar to AJAX, but the transfered content is HTML instead of XML.
base path The relative path in a URL that defines the root of a web site. E.g. if the sitehttp://example.com/ is where a web site lives, then the base path is/. If you have got another web site athttp://example.com/subsite/, then the base path for that web site is/subsite/.
browser A web browser is an application that runs on end user computers to view web sites (which live on the World Wide Web). Examples are Firefox, Internet Explorer, Safari and Opera.
CDN A content delivery network (CDN) is a collection of web servers dis-tributed across multiple locations to deliver content more efficiently to users. The server selected for delivering content to a specific user is typi-cally based on a measure of network proximity.
component A component of a web page, this can be a CSS style sheet, a JavaScript file, an image, a font, a movie file, et cetera.
CSS sprite An image that actually contains a grid of other images. Through CSS, each image in the grid can then be accessed (and displayed to the end user). The benefit is that instead of having as many HTTP requests as there are images in the grid, there is now a single HTTP request, reducing the number of round trips and thereby increasing the perceived page loading speed.
document root The absolute path on the file system of the web server that corresponds with the root directory of a web site. This is typically some-thing like/htdocs/example.com.
Drupal behaviors Behaviors are event-triggered actions that attach to HTML elements, enhancing default non-JavaScript UIs. Through this system, behaviors are also attached automatically to new HTML elements loaded through AHAH/AJAX and HTML elements to which the behaviors have already been applied are automatically skipped.
episode An episode in the page loading sequence.
Episodes The Episodes framework [52] (note the capital ’e’).
internationalization The process of designing a software application so that it can be adapted to various languages and regions without engineering change.
lazy loading Deferring the loading of something until it is actually needed. In the context of web pages, lazy loading a file implies that it will not be loaded until the end user will actually get to see it.
localization The process of adapting internationalized software for a specific region or language by adding locale-specific components and translating text.
page loading performance The time it takes to load a web page and all its components.
page rendering performance The time the server needs to render a web page.
PoP A Point of Presence is an access point to the internet where multiple Internet Service Providers connect with each other.
prefetching Loading something when it not yet needed. In the context of web pages, prefetching a file implies that it will be cached by the browser before it is actually used in a web page.
SLA Service-Level Agreement, part of a service contract where the level of service is formally defined. In practice, the term SLA is sometimes used to refer to the contracted delivery time (of the service) or performance.
2
Definition
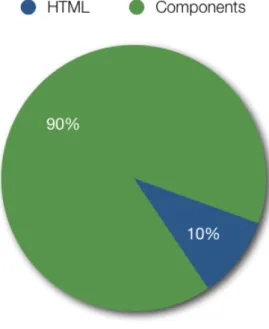
When an end user loads a web page, the time perceived by him until the page has loaded entirely is called theend user response time. Unlike what you might think, the majority of this time is not spent at the server, generating the page! The generating (back-end) and transport of the HTML document (front-end) is typically only 10-20% of the end user response time [1]. The other 80-90% of the time is spent on loading the components (CSS stylesheets, JavaScript, images, movies, et cetera) in the page (front-end only). Figure 1 clarifies this visually:
Figure 1: End user response time of a typical web page.
It should be obvious now that it is far more effective to focus on front-end performance than it is to focus on back-end performance, because it has got a greater potential. It is also easier to optimize than the back-end, because instead of having to profile the entire codebase through which the page is generated (which is necessary for optimizing the back-end performance), you can simply change where in the HTML files are being referenced and possibly also replacing the URLs to use a CDN instead. These measures are clearly far more easy to implement.
3
Drupal
Drupal [2] is a content management system (CMS), although it has become more of a content management framework (CMF). The difference between the two is that the former is a system with predefined rules, or with relatively little flexibility. The latter is — as the name already indicates — a framework which still needs to be configured to suit your needs and therefor offers more flexibility.
History
It is an open source project, started in 2000 by Dries Buytaert, whom was then still studying at the University of Antwerp. He built a small news web site with a built-in web board, allowing his friends in the same dorm to leave notes or to announce when they were having dinner. After graduation, they decided they wanted to stay in touch with each other, so they wanted to keep this site online. Dries wanted to register the domain namedorp.org (the Dutch word for “village”), which was considered a fitting name. But he made a typo and registereddrop.org.
drop.org’s audience changed as its members began talking about new web
tech-nologies, such as syndication, rating and distributed authentication. The ideas resulting from those discussions were implemented ondrop.orgitself.
Only later, in 2001, Dries released the software behind drop.orgas “Drupal”. The purpose was to enable others to use and extend the experimentation plat-form so that more people could explore new paths for development. The name Drupal, pronounced ”droo-puhl,” derives from the English pronunciation of the Dutch word ”druppel,” which means ”drop” .
Figure 2: Drupal’s mascotte: Druplicon.
What makes it different?
There are a couple of things that separate Drupal from most other CMSes and CMFs. For starters, Drupal has a set of principles [4] it strictly adheres to, amongst which is this one:
Drupal should also have minimal, widely-available server-side software requirements. Specifically, Drupal should be fully opera-tional on a platform with a web server, PHP, and either MySQL or PostgreSQL.
This is the reason PHP was chosen as the language to write Drupal in. PHP is the justification for some people to not even try Drupal. But it is also a reason why so many web sites today are running Drupal, and why its statistics (and the popularity of its web site) have been growing exponentially for years [5, 6]. By settling for the lowest common denominator and creating a robust, flexible platform on top of that, it can scale from a simple blogger (such as myself) to the huge media company (such as Sony BMG, Universal Music, Warner Bros, Popular Science, Disney, and so on), non-profit organizations (amongst which are Amnesty International, the United Nations and Oxfam), schools (Harvard, MIT and many more), even governments (including the Belgian, French, U.S. and New Zealand) and important organisations such as NASA and NATO. The list is seemingly endless [7].
Drupal is also strongly focused on innovation, and always closely follows (or leads!) the cutting edge of the world wide web. The Drupal community even has a saying for this:
the drop is always moving [8]
This means there will always be an upgrade from one major Drupal core version to the next, but it will only preserve your data, your code will stop working. This is what prevents Drupal from having an excessive amount of legacy code that many other projects suffer from. Each new major version contains many, often radical, changes in the APIs.
Maturity
Indicators of project maturity are also present: Drupal has a set of coding standards [9] that must be followed strictly. For even the slightest deviation (a single missing space), a patch can be marked as ’needs work’. It also has a large security team [10] which releases security advisories whenever a security flaw is found in either Drupal core or any of the contributed modules.
Community
That brings us to the final part of this brief general introduction to Drupal: the gold of Drupal is in its community. The community is in general very eager to help getting newcomers acquainted with the ins and outs of Drupal. Many people have learned their way through the Drupal APIs by helping others (including myself). The result of this vibrant community is that there is a very large collection of more than 4000 modules [11] and more than 500 themes [12] available for Drupal, albeit of varying quality. This is what enables even the less technically adept to build a web site with complex interactions, without writing a single line of code.
4
Why it matters
Page loading performance matters for a single reason:
Users care about performance!
Your web site’s visitors will not be timing the page loads themselves, but they will browse elsewhere when you are forcing them to wait too long. Fast web sites are rewarded, slow web sites are punished. Fast web sites get more visitors, have happier visitors and their visitors return more often. If the revenue of your company is generated through your web site, you will want to make sure that page loading performance is as good as possible, because it will maximize your revenue as well.
Some statistics:
• Amazon: 100 ms of extra load time caused a 1% drop in sales [13]
• Yahoo!: 400 ms of extra load time caused a 5-9% drop in full-page traffic (meaning that they leave before the page has finished loading) [13]
• Google: 500 ms of extra load time caused 20% fewer searches [13]
• Google: trimming page size by 30% resulted in 30% more map requests [14]
It is clear that even the smallest delays can have disastrous and wondrous effects. Now, why is this important to Drupal – because this bachelor thesis is about improving Drupal’s page loading performance in particular? Because then the Drupal experience is better: a faster web site results in happier users and de-velopers. If your site is a commercial one, either through ads or a store, then it also impacts your revenue. More generally, a faster Drupal would affect many:
• Drupal is increasingly being used for big, high-traffic web sites, thus a faster Drupal would affect a lot of people
• Drupal is still growing in popularity (according to its usage statistics, which only include web sites with the Update Status module enabled, there are over 140,000 web sites as of February 22, 2009, see [15]) and would therefor affect ever more people. Near the end of my bachelor thesis, on June 14, 2009, this had already grown to more than 175,000 web sites.
• Drupal is international, thanks to its internationalization and localization support, and thanks to that it is used for sites with very geographically dispersed audiences (whom face high network latencies) and developing countries (where low-speed internet connections are commonplace). A faster Drupal would make a big difference there as well.
5
Key Properties of a CDN
I will repeat the definition from the terminology section:
A content delivery network (CDN) is a collection of web servers distributed across multiple locations to deliver content more effi-ciently to users. The server selected for delivering content to a spe-cific user is typically based on a measure of network proximity.
It is extremely hard to decide which CDN to use. In fact, by just looking at a CDN’s performance, it is close to impossible [17, 18]!
That is why CDNs achieve differentiation through their feature sets, not through performance. Depending on your audience, the geographical spread (the number of PoPs around the world) may be very important to you. A 100% SLA is also nice to have — this means that the CDN guarantees that it will be online 100% of the time.
You may also choose a CDN based on the population methods it supports. There are two big categories here: push and pull. Pull requires virtually no work on your side: all you have to do, is rewrite the URLs to your files: replace your own domain name with the CDN’s domain name. The CDN will then apply
the Origin Pull technique and will periodically pull the files from the origin
(that is your server). How often that is, depends on how you have configured headers (particularly the Expires header). It of course also depends on the software driving the CDN – there is no standard in this field. It may also result in redundant traffic because files are being pulled from the origin server more often than they actually change, but this is a minor drawback in most situations. Push on the other hand requires a fair amount of work from your part to sync files to the CDN. But you gain flexibility because you can decide when files are synced, how often and if any preprocessing should happen. That is much harder to do with Origin Pull CDNs. See table 1 for an overview on this.
It should also be noted that some CDNs, if not most, support both Origin Pull and one or more push methods.
The last thing to consider is vendor lock-in. Some CDNs offer highly specialized features, such as video transcoding. If you then discover another CDN that is significantly cheaper, you cannot easily move, because you are depending on your current CDN’s specific features.
Pull Push
transfer protocol none FTP, SFTP, WebDAV, Amazon S3 . . .
advantages virtually no setup flexibility, no redundant traffic
disadvantages no flexibility, redundant traffic setup
Table 1: Pull versus Push CDNs comparison table.
• any CDN that supports Origin Pull
• any CDN that supports FTP
• Amazon S3 [97] and Amazon CloudFront [98]. Amazon S3 (or Simple Storage Service in full) is a storage service that can be accessed via the web (via REST and SOAP interfaces). It is used by many other web sites and web services. It has a pay-per-use pricing model: per GB of file transfer and per GB of storage.
Amazon S3 is designed to be a storage service and only has servers in one location in the U.S. and one location in Europe. Recently, Amazon CloudFront has been added. This is a service on top of S3 (files must be on S3 before they can be served from CloudFront), which has edge servers everywhere in the world, thereby acting as a CDN.
6
Profiling tools
If you can not measure it, you can not improve it.
Lord Kelvin
The same applies to page loading performance: if you cannot measure it, you cannot know which parts have the biggest effect and thus deserve your focus. So before doing any real work, we will have to figure out which tools can help us analyzing page loading performance. “Profiling” turns out to be a more accurate description than “analyzing”:
In software engineering, performance analysis, more commonly
today known as profiling, is the investigation of a program’s behavior
using information gathered as the program executes. Theusual goal of performance analysis is to determine which sections of a program
to optimize — usually either to increase its speed or decrease its
memory requirement (or sometimes both). [19]
So a list of tools will be evaluated: UA Profiler, Cuzillion, YSlow, Hammerhead, Apache JMeter, Gomez/Keynote/WebMetrics/Pingdom and Jiffy/Episodes. From this fairly long list, the tools that will be used while improving Drupal’s page loading performance will be picked, based on two factors:
1. How the tool could help improve Drupal core’s page loading performance. 2. How the tool could help Drupal site owners to profile their site’s page
loading performance.
6.1
UA Profiler
UA Profiler [20] is a crowd-sourced project for gathering browser performance characteristics (on the number of parallel connections, downloading scripts with-out blocking, caching, et cetera). The tests run automatically when you navigate to the test page from any browser – this is why it is powered by crowd sourcing. It is a handyreferenceto find out which browser supports which features related to page loading performance.
6.2
Cuzillion
Cuzillion [21] was introduced [22] on April 25, 2008 so it is a relatively new tool. Its tag line, “‘cuz there are zillion pages to check” indicates what it is about: there are a lot of possible combinations of stylesheets, scripts and images. Plus they can be external or inline. And each combination has different effects. Finally, to further complicate the situation, all these combinations depend on the browser being used. It should be obvious that without Cuzillion, it is an insane job to figure out how each browser behaves:
Before I would open an editor and build some test pages. Firing up a packet sniffer I would load these pages in different browsers to diagnose what was going on. I was starting my research on ad-vanced techniques for loading scripts without blocking and realized the number of test pages needed to cover all the permutations was in the hundreds. That was the birth of Cuzillion.
Cuzillion is not a tool that helps you analyze any existing web page. Instead, it allows you to analyze any combination of components. That means it is a
learning tool. You could also look at it as abrowser profiling tool instead of all
other listed tools, which arepage loading profiling tools.
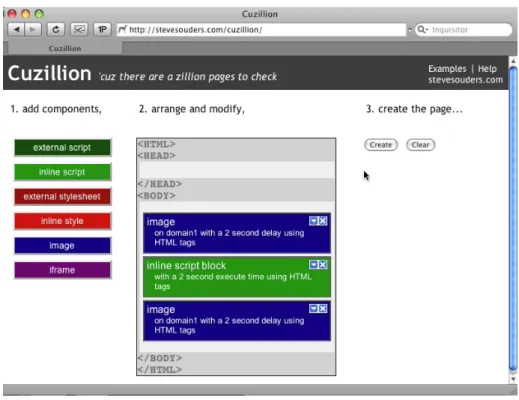
Here is a simple example to achieve a better understanding. How does the following combination of components (in the <body>tag) behave in different browsers?
1. an image on domain 1 with a 2 second delay 2. an inline script with a 2 second execution time 3. an image on domain 1 with a 2 second delay
First you create this setup in Cuzillion (see figure 3). This generates a unique URL. You can then copy this URL to all browsers you would like to test. As you can see, Safari and Firefox behave very differently. In Safari (see figure 4), the loading of the first image seems to be deferred until the inline script has been executed (the images are displayed when the light purple bars become dark purple). In Firefox (see figure 5), the first image is immediately rendered and after a delay of 2 seconds – indeed the execution time of the inline script – the second image is rendered (the images are displayed when the gray bars stop). Without going into details about this, it should be clear that Cuzillion is a simple, yet powerful tool to learn about browser behavior, which can in turn help to improve the page loading performance.
6.3
YSlow
YSlow [27] is a Firebug [25] extension (see figure 6) that can be used to analyze page loading performance through thirteen rules. These were part of the orig-inal fourteen rules [29] – of which there are now thirty-four – of “Exceptional Performance” [28], as developed by the Yahoo! performance team.
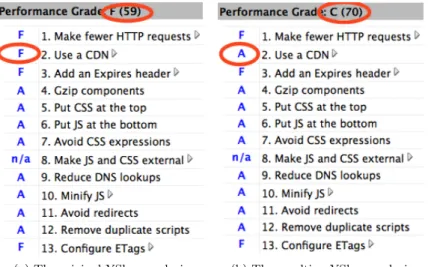
YSlow 1.0 can only evaluate these thirteen rules and has a hardcoded grading algorithm. You should also remember that YSlow just checks how well a web page implements these rules. It analyzes the content of your web page (and the headers that were sent with it). For example, it does not test the latency or speed of a CDN, it just checks if you are using one. As an example, because
Figure 3: The example situation created in Cuzillion.
Figure 5: The example situation in Firefox 3.
you have to tell YSlow (via Firefox’about:config) what the domain name of your CDN is, you can even fool YSlow into thinking any site is using a CDN: see 7.
That, and the fact that some of the rules it analyzes are only relevant tovery
big web sites. For example, one of the rules (#13, “Configure ETags”) is only relevant if you are using a cluster of web servers. For a more in-depth article on how to deal with YSlow’s evaluation of your web sites, see [30]. YSlow 2.0 [31] aims to be more extensible and customizable: it will allow for community contributions, or even web site specific rules.
Since only YSlow 1.0 is available at the time of writing, I will stick with that. It is a very powerful and helpful tool as it stands, it will just get better. But remember the two caveats: it only verifies rules (it does not measure real-world performance) and some of the rules may not be relevant for your web site.
6.4
Hammerhead
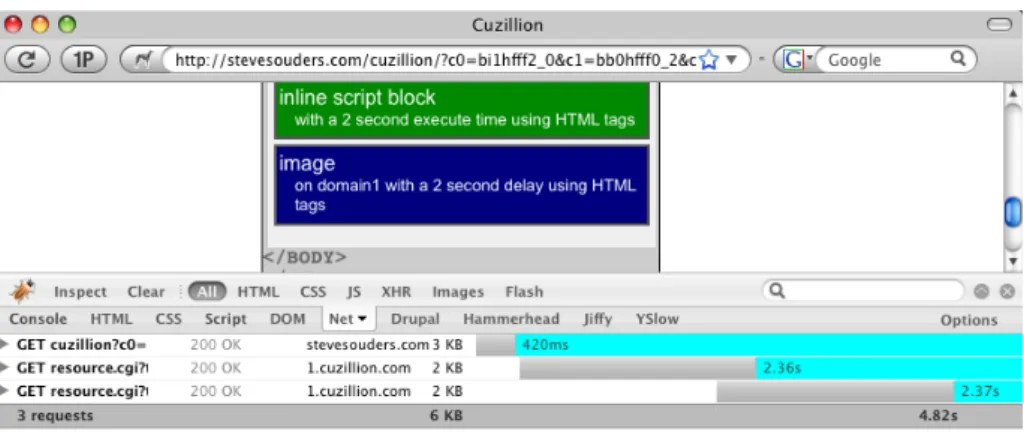
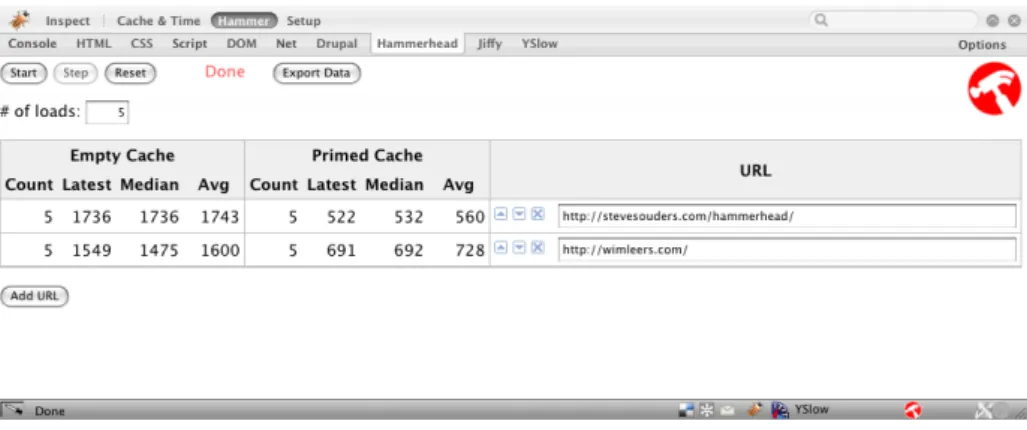
Hammerhead [23, 24] is a Firebug [25] extension that should be usedwhile de-veloping. It measures how long a page takes to load and it can load a page multiple times, to calculate the average and mean page load times. Of course, this is a lot less precise than real-world profiling, but it allows you to profile
Figure 6: YSlow applied to drupal.org.
(a) The original YSlow analysis. (b) The resulting YSlow analysis.
Figure 8: Hammerhead.
while you are working. It is far more effective to prevent page loading perfor-mance problems due to changes in code, because you have the test results within seconds or minutes after you have made these changes!
Of course, you could also use YSlow (see section 6.3) or FasterFox [26], but then you have to load the page multiple times (i.e. hammer the server, this is where the name comes from). And you would still have to set up the separate testing conditions for each page load that Hammerhead already sets up for you: empty cache, primed cache and for the latter there are again two possible situations: disk cache and memory cache or just disk cache. Memory cache is of course faster than disk cache; that is also why that distinction is important. Finally, it supports exporting the resulting data into CSV format, so you could even create some tools to roughly track page loading performance throughout time. A screenshot of Hammerhead is provided in figure 8.
6.5
Apache JMeter
Apache JMeter [33] is an application designed to load test functional behavior
and measure performance. In the perspective of profiling page loading
perfor-mance, the relevant features are: loading of web pages with and without its components and measuring the response time of just the HTML or the HTML and all the components it references.
However, it has several severe limitations:
• Because it only measures from one location – the location from where it is run, it does not give a good big picture.
• It is not an actual browser, so it does not download components referenced from CSS or JS files.
• Also because it is not an actual browser, it does not behave the same as browsers when it comes to parallel downloads.
• It requires more setup than Hammerhead (see section 6.4), so it is less likely that a developer will make JMeter part of his workflow.
It can be very useful in case you are doing performance testing (How long does the back-end need to generate certain pages?), load testing (how many concurrent users can the back-end/server setup handle?) and stress testing (how many concurrent users can it handle until errors ensue?).
To learn more about load testing Drupal with Apache JMeter, see [34, 35]
6.6
Gomez/Keynote/WebMetrics/Pingdom
Gomez [36], KeyNote [37], WebMetrics [38] and Pingdom [39] are examples of third-party (paid) performance monitoring systems.
They have four major disadvantages:
1. limited number of measurement points 2. no real-world browsers are used 3. unsuited for Web 2.0
4. paid & closed source
6.6.1 Limited number of measurement points
These services poll your site at regular or irregular intervals. This poses analysis problems: for example, if one of your servers is very slow just at that one moment that any of these services requests a page, you will be told that there is a major issue with your site. But that is not necessarily true: it might be a fluke.
6.6.2 No real-world browsers
Most, if not all of these services use their own custom clients [46]. That implies their results are not a representation of the real-world situation, which means you cannot rely upon these metrics for making decisions: what if a commonly used real-world browser behaves completely differently? Even if the services would all use real-world browsers, they would never reflect real-world perfor-mance, because each site has different visitors and therefor also a different mix of browsers.
6.6.3 Unsuited for Web 2.0
The problem with these services is that they still assume the World Wide Web is the same as it was 10 years ago, where JavaScript was rather a scarcity than the abundance it is today. They still interpret the onload event as the “end time” for response time measurements. In Web 1.0, that was fine. But as the adoption of AJAX [40] has grown, the onload event has become less and less representative of when the page is ready (i.e. has completely loaded), because the page can continue to load additional components. For some web sites, the “above the fold” section of a web page has been optimized, thereby loading “heavier” content later, below the fold. Thus the “page ready” point in time is shifted from its default.
In both of these cases, theonloadevent is too optimistic [49]. There are two ways to measure Web 2.0 web sites [50]:
1. manual scripting: identify timing points using scripting tools (Selenium
[41], Keynote’s KITE [42], et cetera). This approach has a long list of disadvantages: low accuracy, high switching costs, high maintenance costs, synthetic (no real-world measurements).
2. programmatic scripting: timing points are marked by JavaScript (Jiffy
[47], Gomez Script Recorder [43], et cetera). This is the preferred ap-proach: it has lower maintenance costs and a higher accuracy because the code for timing is included in the other code and measures real user traffic. If we would now work on a shared implementation of this approach, then we would not have to reinvent the wheel every time and switching costs would be much lower. See the Jiffy/Episodes later on.
6.6.4 Paid & closed source
The end user is dependent upon the third party service to implement new in-strumentations and analyses. It is typical for closed source applications to only implement the most commonly asked feature and because of that, the end user may be left out in the cold. There is a high cost for the implementation and a also a very high cost when switching to a different third party service.
6.7
Jiffy/Episodes
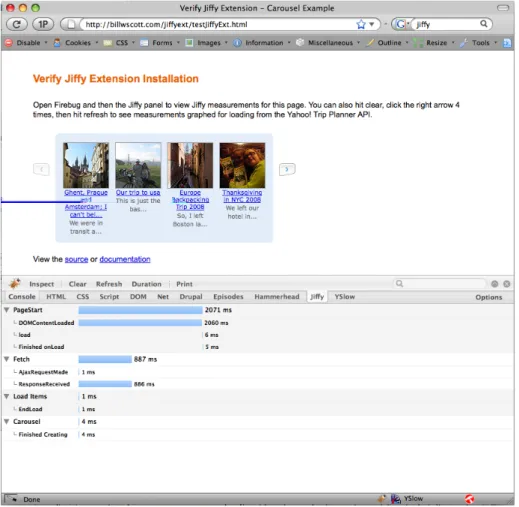
6.7.1 JiffyJiffy [45, 46, 47] is designed to give you real-world information on what is ac-tually happening within browsers of users that are visiting your site. It shows you how long pages really take to load and how long events that happen while
or after your page is loading really take. Especially when you do not control all the components of your web site (e.g. widgets of photo and music web sites, contextual ads or web analytics services), it is important that you can moni-tor their performance. It overcomes four major disadvantages that were listed previously:
1. it can measureevery page load if desired
2. real-world browsers are used, because it is just JavaScript code that runs in the browser
3. well-suited for Web 2.0, because you can configure it to measureanything
4. open source
Jiffy consists of several components:
• Jiffy.js: a library for measuring your pages and reporting measurements
• Apache configuration: to receive and log measurements via a specific query string syntax
• Ingestor: parse logs and store in a database (currently only supports Or-acle XE)
• Reporting toolset
• Firebug extension [48], see figure 9
Jiffy was built to be used by the WhitePages web site [44] and has been running on that site. At more than 10 million page views per day, it should be clear that Jiffy can scale quite well. It has been released as an open source project, but at the time of writing, the last commit was on July 25, 2008. So it is a dead project.
6.7.2 Episodes
Episodes [52, 53] is very much like Jiffy. There are two differences:
1. Episodes’ goal is to become an industry standard. This would imply that the aforementioned third party services (Gomez/Keynote/WebMet-rics/Pingdom) would take advantage of the the instrumentations imple-mented through Episodes in their analyses.
2. Most of the implementation is built into browsers (window.postMessage(),
addEventListener()), which means there is less code that must be
down-loaded. (Note: the newest versions of browsers are necessary: Internet Ex-plorer 8, Firefox 3, WebKit Nightlies and Opera 9.5. An additional back-wards compatibility JavaScript file must be downloaded for older browsers.
Figure 10: Episodes.
Steve Souders outlines the goals and vision for Episodes succinctly in these two paragraphs:
The goal is to make Episodes the industrywide solution for
mea-suring web page load times. This is possible because Episodes has
benefits for all the stakeholders. Web developers only need to learn and deploy a single framework. Tool developers and web metrics ser-vice providers get more accurate timing information by relying on instrumentation inserted by the developer of the web page. Browser developers gain insight into what is happening in the web page by relying on the context relayed by Episodes.
Most importantly, users benefit by the adoption of Episodes. They get a browser that can better inform them of the web page’s status for Web 2.0 apps. Since Episodes is a lighter weight design than other instrumentation frameworks, users get faster pages. As Episodes makes it easier for web developers to shine a light on per-formance issues,the end result is an Internet experience that is faster
for everyone.
A couple of things can be said about the current codebase of Episodes:
• There are two JavaScript files: episodes.js and episodes-compat.js. The latter is loaded on-the-fly when an older browser is being used that does not supportwindow.postMessage(). These files are operational but have not had wide testing yet.
• It uses the same query string syntax as Jiffy uses to perform logging, which means Jiffy’s Apache configuration, ingestor and reporting toolset can be reused, at least partially.
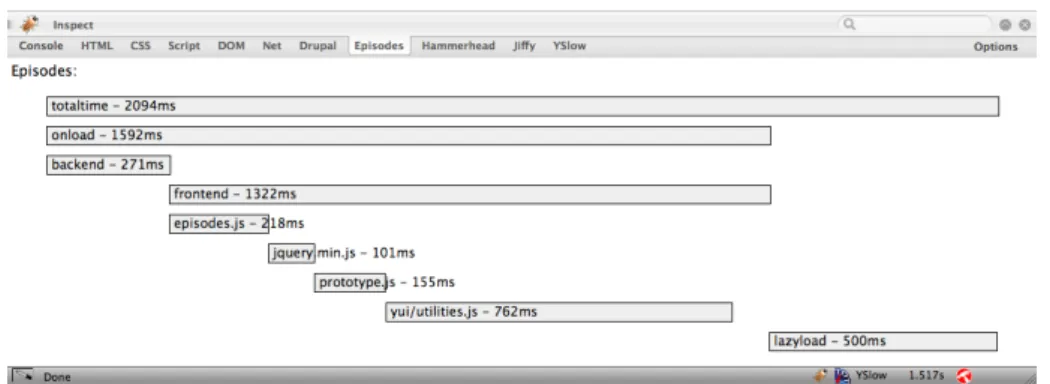
• It has its own Firebug extension, see figure 10.
So, Episodes’ veryraison d’existence is to achieve a consensus on a JavaScript-based page loading instrumentation toolset. It aims to become an industry
standard and is maintained by Steve Souders, who is currently on Google’s pay-roll to work full-time on all things related to page loading performance (which suggests we might see integration with Google’s Analytics [51] service in the future). Add in the fact that Jiffy has not been updated since its initial release, and it becomes clear that Episodes is the better long-term choice.
6.8
Conclusion
There is not a single, “do-it-all” tool that you should use. Instead, you should wisely combine all of the above tools. Use the tool that fits the task at hand. However, for the scope of this thesis, there is one tool that jumps out: YSlow. It allows you to carefully analyze which things Drupal could be doing better. It is not necessarily meaningful in real-world situations, because it e.g. only checks if you are using a CDN, not how fast that CDN is. But the fact that it tests whether a CDN is being used (or Expired headers, or gzipped components, or . . . ) is enough to find out what can be improved, to maximize the potential performance.
This kind of analysis is exactly what I will perform in the next section. There is one more tool that jumps out for real, practical use: Episodes. This tool, if properly integrated with Drupal, would be a key asset to Drupal, be-cause it would enable web site owners to track the real-world page loading performance. It would allow module developers to support Episodes. This, in turn, would be a good indicator for a module’s quality and would allow the web site owner/administrator/developer to carefully analyze each aspect of his Drupal web site.
7
The state of Drupal’s page loading performance
So you might expect that Drupal has already invested heavily in improving its page loading performance. Unfortunately, that is not true. Hopefully this bachelor thesis will help to gain some developer attention.Because of this, the article I wrote more than a year ago is still completely applicable. It does not make much sense to just rephrase the article here in my thesis text, so instead I would like to forward you to that article [16] for the details. The article analyzes Drupal based on the 14 rules defined in Steve Souder’s High Performance Web Sites book.
The essence of the article is that Drupal does some things right already, but many more not yet. The things Drupal did wrong then — and still does wrong today because nothing has changed in this area — yet:
• Static files (CSS, JavaScript, images) should be served with proper HTTP headers so that the browser can cache them and reduce the number of HTTP requests for each page load. Especially the Expires header is im-portant here.
• To allow for CDN integration in Drupal, the ability to dynamically alter file URLs is needed, but this is not supported yet.
• CSS and JS files should be served GZIPped when the browser supports it.
• JavaScript files should be at the bottom (just before the closing</body> tag) whenever possible.
• JavaScript files should be minified.
• Drupal should provide a mechanism to render the same content in multiple formats: (X)HTML (for the regular browser), partial HTML or JSON (for AHAH), XML (for AJAX) and so on. You should be able to set transformations, including cacheability and GZIPability per format.
8
Improving Drupal: Episodes integration
The work I am doing as part of bachelor thesis on improving Drupal’s page loading performance should be practical, not theoretical. It should have a real-world impact.
To ensure that that also happens, I wrote the Episodes module [54]. This module integrates the Episodes framework for timing web pages (see section 6.7.2) with Drupal on several levels –all without modifying Drupal core:
• Automatically includes the necessary JavaScript files and settings on each appropriate page.
• Automatically inserts the crucial initialization variables at the beginning of thehead tag.
• Automatically turns each behavior (in Drupal.behaviors) into its own episode.
• Provides a centralized mechanism for lazy loading callbacks that perform the lazy loading of content. These are then also automatically measured.
• For measuring the css, headerjs and footerjs episodes, you need to change a couple of lines in thepage.tpl.phpfile of your theme. That is the only modification you have to make by hand. It is acceptable because a theme always must be tweaked for a given web site.
• Provides basic reports with charts to make sense of the collected data.
I actually wrote two Drupal modules: the Episodes module and the Episodes Server module. The former is the actual integration and can be used without the latter. The latter can be installed on a separate Drupal web site or on the same. It provides basic reports. It is recommended to install this on a separate Drupal web site, and preferably even a separate web server, because it has to process a lot of data and is not optimized. That would have led me too far outside of the scope of this bachelor thesis.
You could also choose to not enable the Episodes Server module and use an external web service to generate reports, but for now, no such services yet exist. This void will probably be filled in the next few years by the business world. It might become the subject of my master thesis.
8.1
The goal
The goal is to measure the different episodes of loading a web page. Let me clarify that via a timeline, while referencing the HTML in listing 1.
Listing 1: Sample Drupal HTML file.
1 <!DOCTYPE html PUBLIC ”−//W3C//DTD XHTML 1 . 0 S t r i c t //EN” 2 ” h t t p : / /www. w3 . o r g /TR/ xhtml1 /DTD/ xhtml1−s t r i c t . dtd ”>
3 <html xmlns=” h t t p : / /www. w3 . o r g / 1 9 9 9 / xhtml ” xml :lang=” en ” lang=” en ” d i r=” l t r ”>
4 <head>
5 <t i t l e>Sample D r u p a l HTML</t i t l e>
6 <meta h t t p−e q u i v=” Content−Type ” content=” t e x t / html ; c h a r s e t=u t f−8” />
7 <l i n k r e l=” s h o r t c u t i c o n ” h r e f=” / m i s c / f a v i c o n . i c o ” type=” image /x−i c o n ” />
8 <l i n k type=” t e x t / c s s ” r e l=” s t y l e s h e e t ” media=” a l l ” h r e f=” main . c s s ” />
9 <l i n k type=” t e x t / c s s ” r e l=” s t y l e s h e e t ” media=” p r i n t ” h r e f=” more . c s s ” />
10 <s c r i p t type=” t e x t / j a v a s c r i p t ” s r c=” main . j s ”></s c r i p t>
11 <s c r i p t type=” t e x t / j a v a s c r i p t ”>
12 <!−−//−−><! [ CDATA[ / /><!−−
13 jQuery . e x t e n d ( Drupal . s e t t i n g s , { ” b a s e P a t h ”: ” / d r u p a l / ”, ” more ”: t r u e }) ;
14 //−−><! ] ]> 15 </s c r i p t> 16 <!−−[ i f l t IE 7]> 17 <l i n k type=” t e x t / c s s ” r e l=” s t y l e s h e e t ” media=” a l l ” h r e f=” f i x−i e . c s s /> 18 <! [ e n d i f ]−−> 19 </head> 20 <body> 21 <!−− 22 l o t s 23 o f 24 HTML 25 h e r e 26 −−> 27 <s c r i p t t y p e=”t e x t/ j a v a s c r i p t ” s r c=” more . j s ”></ s c r i p t> 28 </body> 29 </html>
• starttime: time of requesting the web page (when the onbeforeunload
event fires, the time is stored in a cookie); not in the HTML file
• firstbyte: time of arrival of the first byte of the HTML file (the JavaScript to measure this time should be as early in the HTML as possible for highest possible accuracy); line 1 of the HTML file
• domready: when the entire HTML document is loaded, but just the HTML,not the referenced files
• pageready: when theonloadevent fires, this happens when also all refer-enced files are loaded
• totaltime: when everything, including lazily-loaded content, is loaded (i.e. pageready + the time to lazy-load content)
Which make for these basic episodes:
• backend episode = firstbyte - starttime
• frontend episode = pageready - firstbyte
• domready episode = domready - firstbyte, this episode is contained within the frontend episode
• totaltime episode = totaltime - starttime, this episode contains the back-end and frontback-end episodes
These are just the basic time measurements and episodes. It is possible to also measure the time it took to load the CSS (lines 8-9, this would be the css
episode) and JavaScript files in the header (line 10, this would be theheaderjs
episode) and in the footer (line 27, this would be the footerjs episode), for example. It is possible to measure just about anything you want.
For a visual example of all the above, see figure 13.
8.2
Making episodes.js reusable
The episodes.js file provided at the Episodes example [55] is in fact just a
rough sample implementation, an implementation that indicates what it should look like. It contained several hardcoded URLs, does not measure the sensible default episodes, contains a few bugs. In short, it is an excellent and solid start, but it needs some work to be truly reusable.
There also seems to be a bug in Episodes when used in Internet Explorer 8. It is actually a bug in Internet Explorer 8: near the end of the page loading sequence, Internet Explorer 8 seems to be randomly disabling the window.postMessage() JavaScript function, thereby causing JavaScript errors. After a while of search-ing cluelessly for the cause, I gave up and made Internet Explorer 8 also use the backwards-compatibility script (episodes-compat.js), which overrides the
window.postMessage()method. The problem had vanished. This is not ideal,
but at least it works reliably now.
Finally, there also was a bug in the referrer matching logic, or more specifically, it only worked reliably in Internet Explorer and intermittently worked in Fire-fox, due to the differences between browsers in cookie handling. Because of this bug, manybackendepisodes were not being measured, and now they are. I improved episodes.js to make it reusable, so that I could integrate it with Drupal without adding Drupal-specific code to it. I made it so that all you have to do is something like this:
1 <head>
2
3 <!−− I n i t i a l i z e EPISODES . −−>
4 <s c r i p t type=” t e x t / j a v a s c r i p t ”>
5 v a r EPISODES = EPISODES | | { };
6 EPISODES . f r o n t e n d S t a r t T i m e = Number ( new Date ( ) ) ; 7 EPISODES . c o m p a t S c r i p t U r l = ” l i b / e p i s o d e s−compat . j s ” ; 8 EPISODES . l o g g i n g = t r u e ; 9 EPISODES . b e a c o n U r l = ” e p i s o d e s / b e a c o n ” ; 10 </s c r i p t> 11 12 <!−− Load e p i s o d e s . j s . −−> 13 <s c r i p t type=” t e x t / j a v a s c r i p t ” s r c=” l i b / e p i s o d e s . j s ” /> 14 15 <!−− R e s t o f head t a g . −−> 16 <!−− . . . −−> 17 18 </head>
This way, you can initialize the variables to the desired values without
customiz-ingepisodes.js. Line 6 should be as early in the page as possible, because it
8.3
Episodes module: integration with Drupal
8.3.1 ImplementationHere is a brief overview with the highlights of what had to be done to integrate the Episodes framework with Drupal.
• Implemented hook install(), through which I set a module weight of -1000. This extremely low module weight ensures the hook implementa-tions of this module are always executed before all others.
• Implementedhook init(), which is invoked at the end of the Drupal boot-strap process. Through this hook I automatically insert the JavaScript into the<head>tag that is necessary to make Episodes work (see section 8.2). Thanks to the extremely low module weight, the JavaScript code it inserts is the first tag in the<head>tag.
• Also through this same hook I addDrupal.episodes.js, which provides the actual integration with Drupal. It automatically creates an episode for each Drupal “behavior”. (A behavior is written in JavaScript and adds interactivity to the web page.) Each time new content is added to the page through AHAH,Drupal.attachBehaviors()is called and automatically attaches behaviors to new content, but not to existing content. Through
Drupal.episodes.js, Drupal’s defaultDrupal.attachBehaviors()method
is overridden – this is very easy in JavaScript. In this overridden version, each behavior is automatically measured as an episode.
Thanks to Drupal’s existing abstraction and the override I have imple-mented, all JavaScript code can be measured through Episodes without hacking Drupal core.
A simplified version of what it does can be seen here:
Listing 2: Drupal.attachBehaviors() override.
D r u p a l . a t t a c h B e h a v i o r s = f u n c t i o n ( c o n t e x t ) {
u r l = document . l o c a t i o n ;
f o r ( b e h a v i o r i n D r u p a l . b e h a v i o r s ) {
window . p o s t M e s s a g e ( ”EPISODES : mark : ” + b e h a v i o r , u r l ) ; D r u p a l . b e h a v i o r s [ b e h a v i o r ] ( c o n t e x t ) ;
window . p o s t M e s s a g e ( ”EPISODES : m e a s u r e : ” + b e h a v i o r , u r l ) ;
} };
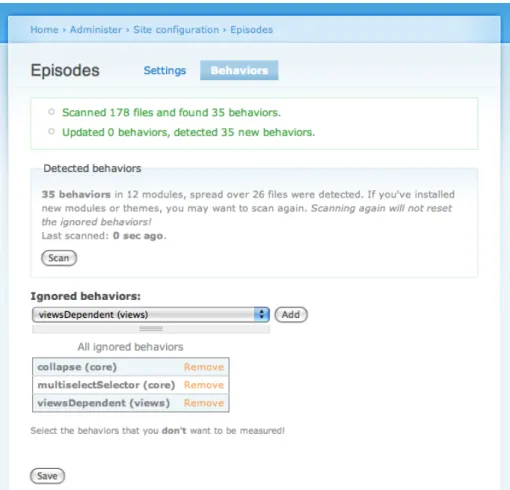
• Some of the Drupal behaviors are too meaningless to measure, so it would be nice to be able to mark some of the behaviors as ignored. That is also something I implemented. Basically I do this by locating every directory in which one or more*.js files exist, create a scan job for each of these and queue them in Drupal’s Batch API [56]. Each of these jobs scans each
*.jsfile, looking for behaviors. Every detected behavior is stored in the database and can be marked as ignored through a simple UI that uses the Hierarchical Select module [58].
• For measuring the css and headerjs episodes, it is necessary to make a couple of simple (copy-and-paste) changes to thepage.tpl.php of the Drupal theme(s) you are using. These changes are explained in theREADME.txt
file that ships with the Episodes module. This is the only manual change to code thatcan be done – it is recommended, but not required.
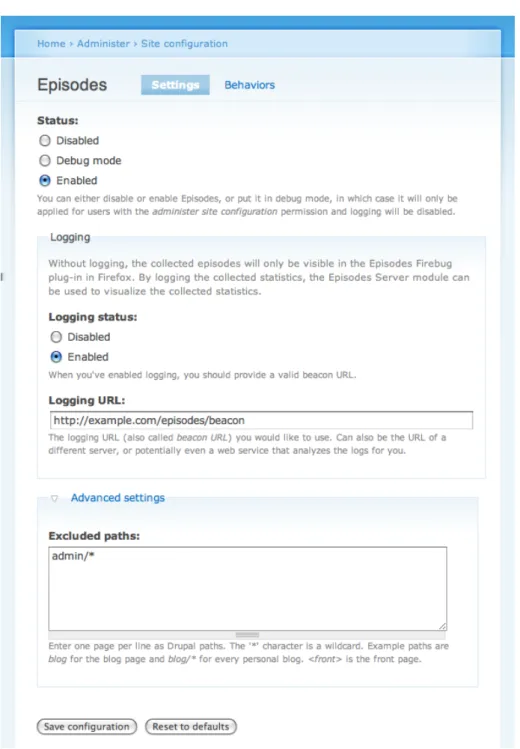
• And of course a configuration UI (see figure 11 and figure 12) using the Forms API [57]. It ensures the logging URL (this is the URL through which the collected data is logged to Apache’s log files) exists and is prop-erly configured (i.e. returns a zero-byte file).
8.3.2 Screenshots
8.4
Episodes Server module: reports
Only basic reports are provided, highlighting the most important statistics and visualizing them through charts. Advanced/detailed reports are beyond the scope of this bachelor thesis, because they require extensive performance re-search (to be able to handle massive datasets), database indexing optimization and usability research.
8.4.1 Implementation
• First of all, the Apache HTTP server is a requirement as this application’s logging component is used for generating the log files. Its logging compo-nent has been proven to be scalable, so there is no need to roll our own. The source of this idea lies with Jiffy (see section 6.7.1 on page 16).
• The user must make some changes to his httpd.conf configuration file for his Apache HTTP server. As just mentioned, my implementation is derived from Jiffy’s, yet every configuration line is different.
• The ingestor parses the Apache log file and moves the data to the database. I was able to borrow a couple of regular expressions from Jiffy’s ingestor (which is written in Perl) but I completely rewrote it to obtain clean and simple code, conform the Drupal coding guidelines. It detects the browser, browser version and operating system from the User Agent that was logged with the help of the Browser.php library [60].
Also, IPs are converted to country codes using theip2country Drupal module [61].
This is guaranteed to work thanks to the included meticulous unit tests.
• For the reports, I used the Google Chart API [59]. You can see an example result in figures 15, 16 and 17. It is possible to compare the page loading performance of multiple countries by simply selecting as many countries as you would like in the “Filters” fieldset.
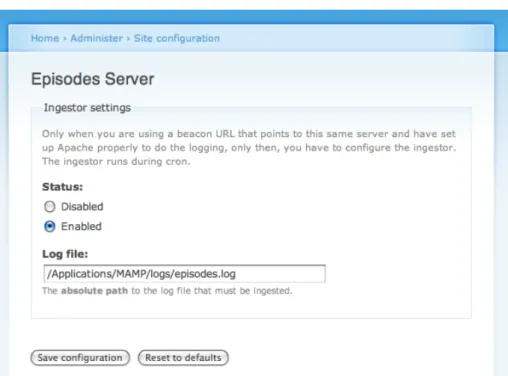
• And of course again a configuration UI (see figure 14) using the Forms API [57]. It ensures the log file exists and is accessible for reading.
8.4.2 Screenshots
Figure 14: Episodes Server module settings form.
Figure 15: Episodes Server module: overall analysis.
8.4.3 Desired future features
Due to lack of time, the basic reports are . . . well . . . very basic. It would be nice to have more charts and to be able to filter the data of the charts. In particular, these three filters would be very useful:
1. filter by timespan: all time, 1 year, 6 months, 1 month, 1 week, 1 day 2. filter by browser and browser version
Figure 17: Episodes Server module: episodes analysis.
8.5
Insights
• Episodes module
– Generating the back-end start time on the server can never work reliably because the clocks of the client (browser) and server are never perfectly in sync, which is required. Thus, I simply kept Steve Souders’onbeforeunloadmethod to log the time when a next page was requested. The major disadvantage of this method is that it is impossible to measure the backend episode for each page load: it is only possible to measure the backend episode when the user navigates through our site (more specifically, when the referrer is the same as the current domain).
– Even just measuring the page execution time on the server cannot work because of this same reason. You can accurately measure this time, but you cannot relate it to the measurements in the browser. I implemented this using Drupal’s hook boot() and hook exit()
hooks and came to this conclusion.
– On the first page load, the onbeforeunload cookie is not yet set and therefor the backend episode cannot be calculated, which in turn prevents the pageready and totaltime episodes from being calculated. This is of course also a problem when cookies are disabled, because then thebackendepisode cannever be calculated. There is no way around this until the day that browsers provide something
like document.requestTime.
– Currently the same database as Drupal is being used. Is this scalable enough for analyzing the logs of web sites with millions of page views? No. Writing everything to a SQLite database would not be better. The real solution is to use a different server to run the Episodes Server module on or even an external web service. Better even is to log to your own server and then send the logs to an external web service. This way you stay in control of all your data! Because you still have your log data, you can switch to another external web service, thereby avoiding vendor lock-in. The main reason I opted for using the same database, is ease of development.
Optimizing the profiling tool is not the goal of this bachelor thesis, optimizing page loading performance is. As I already mentioned before, writing an advanced profiling tool could be a master thesis on its own.
8.6
Feedback from Steve Souders
I explained Steve Souders what I wanted to achieve through this bachelor thesis and the initial work I had already done on integrating Episodes with Drupal. This is how his reply started:
Wow.
Wow, this is awesome.
So, at least he thinks that this was a worthwhile job, which suggests that it will probably be worthwhile/helpful for the Drupal community as well.
Unfortunately for me, Steve Souders is a very busy man, speaking at many web-related conferences, teaching at Stanford, writing books and working at Google. He did not manage to get back to the questions I asked him.
9
Daemon
So now that we have the tools to accurately (or at leastrepresentatively) measure the effects of using a CDN, we still have to start using a CDN. Next, we will examine how a web site can take advantage of a CDN.
As explained in section 5, there are two very different methods for populating CDNs. Supporting pull is easy, supporting push is a lot of work. But if we want to avoid vendor lock-in, it is necessary to be able to transparently switch between pull and any of the transfer protocols for push. Suppose that you are using CDN A, which only supports FTP. when you want to switch to a cheaper, yet better CDN B, that would be a costly operation, because CDN B only supports a custom protocol.
To further reduce costs, it is necessary that we can do the preprocessing ourselves (be that video transcoding, image optimization or anything else). Also note that many CDNs do not support processing of files — but it can reduce the amount of bandwidth consumed significantly, and thereby the bill received every month. That is why the meat of this thesis is about a daemon that makes it just as easy to use either push or pull CDNs and that gives you full flexibility in what kind of preprocessing you would like to perform. All you will have to do to integrate your web site with a CDN is:
1. install the daemon
2. tell it what to do by filling out a simple configuration file 3. start the daemon
4. retrieve the URLs of the synced files from an SQLite database (so you can alter the existing URLs to files to the ones for the CDN)
9.1
Goals
As said before, the ability to use either push or pull CDNs is an absolute ne-cessity, as is the ability to process files before they are synced to the CDN. However, there is more to it than just that, so here is a full list of goals.
• Easy to use: the configuration file is the interface and explain itself just by its structure
• Transparency: the transfer protocol(s) supported by the CDN should be irrelevant
• Mixing CDNs and static file servers