University of Iowa
University of Iowa
Iowa Research Online
Iowa Research Online
Proceedings of the Ophthalmic Medical Image Analysis International Workshop
Sep 14th, 2014
Multiple ocular diseases detection by graph regularized
Multiple ocular diseases detection by graph regularized
multi-label learning
label learning
Xiangyu Chen
Institute for Infocomm Research, Agency for Science, Technology and Research, Singapore
Yanwu Xu
Institute for Infocomm Research, Agency for Science, Technology and Research, Singapore
Lixin Duan
Institute for Infocomm Research, Agency for Science, Technology and Research, Singapore
Zhuo Zhang
Institute for Infocomm Research, Agency for Science, Technology and Research, Singapore
Damon Wing Kee Wong
Institute for Infocomm Research, Agency for Science, Technology and Research, Singapore
See next page for additional authors
Follow this and additional works at: https://ir.uiowa.edu/omia Part of the Ophthalmology Commons
Recommended Citation
Recommended Citation
Chen, Xiangyu; Xu, Yanwu; Duan, Lixin; Zhang, Zhuo; Wong, Damon Wing Kee; and Liu, Jiang. Multiple ocular diseases detection by graph regularized multi-label learning. In: Chen X, Garvin MK, Liu JJ editors. Proceedings of the Ophthalmic Medical Image Analysis First International Workshop, OMIA 2014, Held in Conjunction with MICCAI 2014, Boston, Massachusetts, September 14, 2014. 17-24. https://doi.org/ 10.17077/omia.1004
Rights
Copyright © 2014, Xiangyu Chen, Yanwu Xu, Lixin Duan, Zhuo Zhang, Damon Wing Kee Wong, and Jiang Liu. Hosted by Iowa Research Online. For more information please contact: [email protected].
Presenter Information
Presenter Information
Xiangyu Chen, Yanwu Xu, Lixin Duan, Zhuo Zhang, Damon Wing Kee Wong, and Jiang Liu
Multiple Ocular Diseases Detection by Graph
Regularized Multi-label Learning
Xiangyu Chen, Yanwu Xu, Lixin Duan, Zhuo Zhang, Damon Wing Kee Wong, and Jiang Liu
Institute for Infocomm Research, Agency for Science, Technology and Research, Singapore
Abstract. We develop a general framework for multiple ocular diseases diag-nosis, based on Graph Regularized Multi-label Learning (GRML). Glaucoma, Pathological Myopia (PM), and Age-related Macular Degeneration (AMD) are three leading ocular diseases in the world. By exploiting the correlations among these three diseases, a novel GRML scheme is investigated for a simultaneous detection of these three leading ocular diseases for a given fundus image. We validate our GRML framework by conducting extensive experiments on SiMES dataset. The results show area under curve (AUC) of the receiver operating characteristic curve in multiple ocular diseases detection are much better than traditional popular algorithms. The method could be used for glaucoma, PM, and AMD diagnosis.
1
Introduction
Glaucoma, Pathological Myopia (PM), and age-related macular degeneration (AMD) are three leading ocular diseases. Glaucoma is a chronic eye disease that leads to vi-sion loss, in which the optic nerve is progressively damaged. It is one of the common causes of blindness, and is predicted to affect around 80 million people by 2020 [1]. Glaucoma diagnosis is typically based on the medical history, intraocular pressure, and visual field loss tests together with a manual assessment of the Optic Disc (OD) through ophthalmoscopy. OD or optic nerve head is the location where ganglion cell axons exit the eye to form the optic nerve [21][20], through which visual information of the photo-receptors is transmitted to the brain [2].
As one of the leading causes of blindness worldwide, Pathological Myopia (PM) is a type of severe and progressive nearsightedness characterized by changes in the fun-dus of the eye, due to posterior staphyloma and deficient corrected acuity. PM is pri-marily a genetic condition [3] [4]. It is accompanied by degenerative changes in the retina, which if left untreated can lead to irrecoverable vision loss. The accurate detec-tion of PM will enable timely intervendetec-tion and facilitate better disease management to slow down the progression of the disease. PM has been detected mostly from fundus image where retinal degeneration is observed in the form of Peripapillary Atrophy (PPA). PPA is the thinning of retinal layers around the optic nerve and is character-ized by a pigmented ring like structure around the optic disc.
Age-related Macular Degeneration (AMD) causes vision loss at the central region and blur and distortion at the peripheral region. Depending on the presence of exu-
Fig. 1. Three leading ocular diseases (from left top to right bottom): a) Normal eye, b) Glauco-ma disease, c) Age-related Macular Degeneration (AMD) disease, d) Pathological Myopia (PM) disease.
dates, AMD is classified into dry AMD (non-exudative AMD) and wet AMD (exuda-tive AMD). Dry AMD results from atrophy of the retinal pigment epithelial layer below the retina. It causes vision loss through loss of photoreceptors (rods and cones) in the central part of the retina. The major symptom and also the first clinical indica-tor of dry AMD is drusen, sub-retinal deposits formed by retinal waste. Wet AMD causes vision loss due to abnormal blood vessel growth (choroidal neovasculariza-tion) in the choriocapillaris, through Bruchs membrane, ultimately leading to blood and protein leakage below the macula. Bleeding, leaking, and scarring from these blood vessels eventually cause irreversible damage to the photoreceptors and rapid vision loss if left untreated. The major symptom of wet AMD is exudation [5] [6]. For these three leading ocular diseases, there are some correlations among them. In recent decades the problem of low vision and blindness in elderly people became major and socially significant issue. The number of patients having age-related macu-lar degeneration (AMD) in association with glaucoma grows all over the world [7], which attaches medical and social value to this multiple diseases diagnosis problem. Moreover, in recent study, myopic eyes are less likely to have AMD and diabetic retinopathy (DR) but more likely to have nuclear cataract and primary open-angle glaucoma (POAG) [8]. Inspired by the correlations among Glaucoma, PM, and AMD, we propose a graph regularized multi-label learning framework for harmoniously integrating the above correlation information, and investigating the problem of
ing to simultaneously diagnose these three leading ocular diseases for a given fundus image. Unlike previous approaches that detect individual ocular disease independent-ly, our proposed GRML scheme encodes the correlation information of multiple dis-eases of an image as a unit label confidence vector, which naturally imposes inter-label constraints and manipulates inter-labels of diseases interactively. Since Kullback-Leibler divergence has been widely employed in the field of computer vision [9] [14][19], here we adopt the probabilistic Kullback-Leibler divergence for problem formulation on multi-label learning. This kind of multiple diseases screening is more oriented to real world diagnosis scenario because a patient may have two or three diseases at the same time.
2
Graph Regularized Multi-label Learning
There are two main concatenating parts in our proposed multi-label learning frame-work: 1) Graph Construction based on k-nearest-neighbor (k-NN); 2) Multi-label Learning based on Kullback-Leibler divergence.
2.1 Graph Construction
In this paper, we adopt an directed weighted graph for multi-label learn-ing, where is represented by a weight matrix , the cardinality of
the node set is ( and denote the number of labeled and unlabeled fun-dus images respectively), and the edge set describes the graph topology. We denote the sets of labeled and unlabeled vertices and respectively. To en-force the constructed graph to be sparse, we utilize the k-nearest-neighbor (k-NN) for graph construction. The assumption of k-NN is that the weight between two nodes is nonzero only when , where denotes the local neighborhood of the i-th image.
The graph construction includes two parts: neighborhood selection and weight computation. For neighborhood selection, we employ k-nearest-neighbor for graph construction. In this setting, if is among the k-nearest neighbors to the i-th fundus image, then is nonzero. Graphs constructed in this way ensure a constant vertex
degree and avoid over-dense sub-graphs and isolated vertices. For weight computa-tion, the underlying philosophy is that the message transmitted from the neighboring vertices with higher weights will be much stronger than the others, where the more similar a sample is to another sample, the larger weight exists between them. In this paper, we utilize the popular way to calculate the pairwise weights–exponentially weighted similarity. The weights between the neighbors are computed as below: (
), (1)
where is the distance between the fundus image and , and is a free parameter to control the decay rate.
2.2 Multi-label Learning based on Kullback-Leibler Divergence
Here we adopt the same representation and distance measure as in [14], yet in a dif-ferent scenario (i.e. medical multiple diseases detection). We denote the set of labeled fundus images by , where is the feature vector of the i-th fundus image and is a multi-label vector with ground truth. is the set of unlabeled images, and is the entire fundus image data set. Given , be the probability measure over the measurable space , where is the -field of measurable subsets of and is the space of classifier outputs. For binary classification, | | . For multiple diseases classification, | | , which is the case of our proposed framework. We use and for the i-th fundus image, both of which are subject to the multinomial distributions, and is the probability that xi be-longs to class . Here { }encodes the supervision disease information of the labeled fundus image. We adopt the following objective function for multi-label learning, which is based on the concept of Kullback-Leibler divergence:
∑ || ∑ ∑ || , (2) Here || denotes the KL divergence between and , whose formal
defi-nition for the discrete case is expressed as ( || ∑ ⁄ )
Since in Equation (2) is not amenable to alternating optimization, we employ a modified version by introducing a new group of variables , which is shown as below:
∑ || ∑ ∑ || ) ∑ || (3)
where can actually be regarded as an approximated version of , which is intro-duced to decouple the original term ∑ ∑ || ). To enforce
con-sistency between them, the third term ∑ || is incorporated. The Equa-tion (3) could be solved by utilizing the similar method in [14].
3
Experiments
To evaluate the multiple diseases diagnosis performance of our proposed Graph Regularized Multi-label Learning (GRML), we conduct extensive experiments on the Singapore Malay Eye Study (SiMES) database [10] for detecting the three leading ocular diseases: Glaucoma, Pathological Myopia (PM), and age-related macular de-generation (AMD). We also consider using different types of features as well as their combination in the experiments, which gives us a total of three settings: 1) global features; 2) bag of words; 3) global feature + bag of words. The notation + indicates a combination of two types of features in the corresponding setting.
3.1 Dataset
SiMES is a population-based study conducted from 2004 to 2007. It examined a crosssectional and age stratified sample of 3,280 randomly selected Malays aged from 40 to 80 years old living in Singapore. For each subject in this database, personal demographic/ clinical data, a retinal fundus image, and a blood sample (used for genotyping) were collected during the clinic visit, which thus gives us three informat-ics domains containing completely different types of data. Moreover, the detection of three leading ocular diseases (i.e., glaucoma, AMD, and PM) have been made by clinicians at the same time. The detection of different diseases made by clinicians during the visit are used as the gold standard to evaluate the classification perfor-mance of all the methods in this work. In this work, we select a subset of SiMES for experiments, which contains 2,258 subjects. Among the 2,258 subjects, there are 100 with glaucoma, 122 with AMD, and 58 with PM. For each disease, the distribution of the subjects who contracted the disease in the selected dataset is representative of the disease prevalence in the population.
3.2 Low-level Features
To facilitate experimentation and comparison of results, we extract a set of effective and popularly used global and local features for each image. For global features, four types of features are extracted: 64-dimensional color histogram (LAB) [11], 144-dimensional color auto-correlogram (HSV) [12], 73-144-dimensional edge direction histo-gram [13], and 128-dimensional wavelet texture [15]. For local features, 500-dimensional bags of visual words [16] are generated. The generation of bag of words comprises three major steps: (a) we apply the Difference of Gaussian filter on the gray scale images to detect a set of key-points and scales respectively; (b) we com-pute the Scale Invariant Feature Transform (SIFT) [16] over the local region defined by the key-point and scale; and (c) we perform the vector quantization on SIFT region descriptors to construct the visual vocabulary by exploiting the k-means clustering.
3.3 Evaluation Metric
In this work, we utilize the area under the curve (AUC) of receiver operation charac-teristic curve (ROC) to evaluate the performance of glaucoma diagnosis. The ROC is plotted as a curve which shows the tradeoff between sensitivity TPR (true positive rate) and specificity TNR (true negative rate), defined as
(4)
where TP and TN are the number of true positives and true negatives, respectively, and FP and FN are the number of false positives and false negatives, respectively.
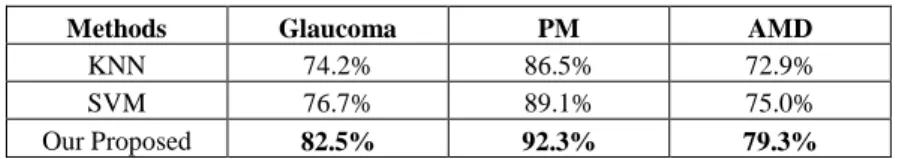
Table 1. The AUCs of different algorithms for simultaneously detecting the three leading ocular diseases (i.e., Glaucoma, PM and AMD) on SiMES dataset. The combined visual features (global features + bag of words) are utilized in the experiment. The results of AUC marked in boldfaceare significantly better than others.
Methods Glaucoma PM AMD
KNN 74.2% 86.5% 72.9%
SVM 76.7% 89.1% 75.0%
Our Proposed 82.5% 92.3% 79.3%
3.4 Experimental Setup
In this work, we compare our proposed Graph Regularized Multi-label Learning (GRML) with two baseline methods (i.e., Support Vector Machine (SVM) [17] and the k- Nearest Neighbors (KNN) [18]) under the aforementioned three settings using different feature types as well as their combinations. For each setting, all the methods for the automatic detections of the three leading ocular diseases (i.e., glaucoma, AMD and PM) are evaluated on the subset of SiMES.
3.5 Experiment Results Analysis
In the experiments, we systematically compare our proposed GRML with SVM and KNN on the subset of SiMES under different types of visual features. Below are the parameters and the adopted values for each method:
For SVM algorithm, we adopt the RBF kernel. For its two parameters and , we set and 1 in experiments after fine tuning.
For KNN, there is only one parameter for tuning, which stands for the number of nearest neighbors and is trivially set as 500.
For GRML, we set the two parameters as , and .
The AUCs of these three methods for simultaneously detecting the three leading ocular diseases (i.e., Glaucoma, PM, and AMD) on SiMES dataset are illustrated in Table 1. The combined visual features (global features + bag of words) are utilized in this experiment. Our proposed algorithm GRML outperforms the other baseline algo-rithms significantly. For example, GRML has an improvement 7.6% over SVM, 11.2% over KNN for detecting Glaucoma. For PM, GRML has an improvement 3.6% over SVM, 6.7% over KNN. For AMD, GRML has an improvement 5.7% over SVM, 8.8% over KNN. The improvement is supposed to stem from the fact that our pro-posed algorithm encodes the disease label information of each image as a unit confi-dence vector, which imposes extra inter-label constraints. In contrast, other methods consider each disease label independently.
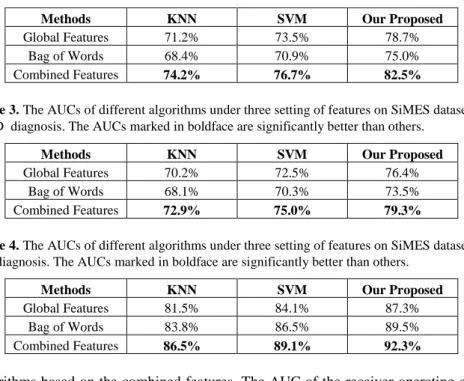
The comparison results of the detecting performance under three feature setting are listed in Table 2, Table 3, and Table 4. From Table 2, we are able to observe that, for glaucoma detection, our proposed algorithm GRML outperforms the two baseline
Table 2. The AUCs of different algorithms under three setting of features on SiMES dataset for Glaucoma diagnosis. The AUCs marked in boldface are significantly better than others.
Methods KNN SVM Our Proposed
Global Features 71.2% 73.5% 78.7% Bag of Words 68.4% 70.9% 75.0% Combined Features 74.2% 76.7% 82.5%
Table 3. The AUCs of different algorithms under three setting of features on SiMES dataset for AMD diagnosis. The AUCs marked in boldface are significantly better than others.
Methods KNN SVM Our Proposed
Global Features 70.2% 72.5% 76.4% Bag of Words 68.1% 70.3% 73.5% Combined Features 72.9% 75.0% 79.3%
Table 4. The AUCs of different algorithms under three setting of features on SiMES dataset for PM diagnosis. The AUCs marked in boldface are significantly better than others.
Methods KNN SVM Our Proposed
Global Features 81.5% 84.1% 87.3% Bag of Words 83.8% 86.5% 89.5% Combined Features 86.5% 89.1% 92.3%
algorithms based on the combined features. The AUC of the receiver operating char-acteristic curve in glaucoma detection is 82.5%. The similar results are shown in Ta-ble 3 and TaTa-ble 4 for AMD and PM detection respectively. For AMD detection, our proposed GRML algorithm achieves 79.3%. For PM detection, the AUC of GRML is 92.3%.
4
Conclusions
In this paper, we present a novel Graph Regularized Multi-label Learning (GRML) framework for multiple ocular diseases diagnosis. The proposed GRML harmoniously integrates the correlation information of Glaucoma, PM and AMD, and exploits the problem of learning to simultaneously detect these three ocular diseases. Two concat-enating parts are included GRML: 1) Graph Construction based on k-nearest-neighbor (k-NN); 2) Multi-label Learning based on Kullback-Leibler Divergence. This type of multiple diseases screening is more oriented to real world diagnosis scenario because a patient may has two or three diseases at the same time. In future work, we plan to extend our multi-label learning framework to large-scale multiple ocular diseases diagnosis.
References
1. Quigley, H.A., Broman, A.T.: The number of people with glaucoma worldwide in 2010 and 2020. Br. J. Ophthalmol, 90(3), 262–7, (2006)
2. Xu, Y., Lin, S., Wong, T.Y., Liu, J., Xu, D.: Efficient Reconstruction-Based Optic Cup Localization for Glaucoma Screening. In: MICCAI 2013
3. Young, T.L., Ronan, S.M.,Alvear, A.B., Wildenberg, S.C., Oetting, W.S., Atwood, L.D., Wilkin, D.J., King, R.A.: A second locus for familial high myopia maps to chromosome 12q. Am J Hum Genet., 63(5), 1419–24 (1998)
4. Xu, Yanwu, Liu, Jiang, Zhang, Zhuo, Tan, Ngan Meng,Wong, DamonWing Kee, Saw, Seang Mei, Wong, Tien Yin: Learn to recognize pathological myopia in fundus images us-ing bag-of-feature and sparse learnus-ing approach. In: International Symposium on Biomed-ical Imaging (2013)
5. Bressler, N.M., Bressler, S.B., Fine, S.L.: Age-related macular degeneration. Survey of ophthalmology. Survey of ophthalmology, 32(6), 375–413 (1988)
6. De Jong, P.T.: Age-related macular degeneration. : New England Journal of Medicine, 355(14), 1474–1484 (2006)
7. Avetisov, S.E., Erichev, V.P., Budzinskaia, M.V., Karpilova, M.A., Gurova, I.V., Shchegoleva, I.V., Chikun, E.A.: Age-related macular degeneration and glaucoma: intra-ocular pressure monitoring after intravitreal injections. : Vestn. Oftalmol. , 128(6), 3–5, (2012)
8. Pan, C.W., Cheung, C.Y., Aung, T., Cheung, C.M., Zheng, Y.F., Wu, R.Y., Mitchell, P., Lavanya, R, Baskaran, M., Wang, J.J., Wong, T.Y., Saw, S.M.: Differential associations of myopia with major age-related eye diseases: the Singapore Indian Eye Study. Oph-thalmol, 20(2), 284–91, (2013)
9. Subramanya, A., Bilmes, J.: Entropic graph regularization in non-parametric semi-supervised classification. In: NIPS, (2009)
10. Shen, S. Y., Wong, T. Y., Foster, P. J., Loo, J. L., Rosman, M., Loon, S. C., Wong, W. L., Saw, S. M., Aung, T.: The prevalence and types of glaucoma in malay people: the Singa-pore malay eye study. Investigative Ophthalmology and Visual Science, 49(9), 3846– 3851, (2008)
11. Shapiro, L. G., Stockman, G. C.: Computer Vision. : Prentice Hall, (2003)
12. Huang, J., Kumar, S., Mitra, M., Zhu, W.-J., Zabih, R.: Image indexing using color corre-logram. In: IEEE Conf. on Computer Vision and Pattern Recognition, (1997)
13. Park, D. K., Jeon, Y. S., Won, C. S.: Efficient use of local edge histogram descriptor. In: ACM Multimedia, (2000)
14. Chen, X., Mu, Y., Yan, S., Chua, T.: Efficient Large-Scale Image Annotation by Probabil-istic Collaborative Multi-Label Propagation. In: ACM Multimedia, (2010)
15. Manjunath, B. S., Ma, W.-Y.: Texture features for browsing and retrieval of image data. IEEE Transactions on Pattern Analysis and Machine Intelligence, 18(8), 837–842, (1996) 16. Lowe., D.: Distinctive image features from scale-invariant keypoints. Intl J. Computer
Vision, 2(60), 91–110, (2004)
17. Collobert, R., Sinz, F. H., Weston, J., Bottou, L.: Large scale transductive svms. : Journal of Machine Learning Research, 7, 1687–1712, (2006)
18. Duda, R., Stork, D., Hart, P.: Pattern Classification. JOHN WILEY, (2000)
19. Chen, X., Mu, Y., Liu, H., Yan, S., Rui, Y., Chua, T.: Large-scale multilabel propagation based on efficient sparse graph construction. ACM Transactions on Multimedia Compu-ting, Communications and Applications, 10(1), 6, (2013)
20. Xu, Y., Liu, J., Lin, S., Xu, D., Cheung, C., Aung, T., Wong, T.Y.: Efficient Optic Cup Detection from Intra-image Learning with Retinal Structure Priors. In: MICCAI 2012 21. Xu, Y., Xu, D., Lin, S., Liu, J., Cheng, J., Cheung, C., Aung, T.,Wong, T.Y.: Sliding
Win-dow and Regression Based Cup Detection in Digital Fundus Images for Glaucoma Diag-nosis. In: MICCAI 2011