Predictive Models and Analysis of Peak and Flatten Curve
Values of CoVID-19 Cases in India
Paras Bhatnagar
1*), Shivendra Kaura
2), Sanjeev Rajan
3) 1Department of Mathematics,G. L. Bajaj Institute of Technology and Management, Greater Noida, UP, India
2Department of Electrical and Electronics Engineering,
G. L. Bajaj Institute of Technology and Management, Greater Noida, UP, India
3Department of Mathematics, Hindu College Moradabad, UP India
*Author to whom correspondence should be addressed:
E-mail: [email protected] (PB)
(Received 9 August 2020; Revised 20 October 2020; accepted 2 November 2020).
Abstract: Worldwide increasing cases of COVID-19 are putting high pressure on healthcare services. The coronavirus epidemic caused announcing emergency cases in India. The virus started with one infected case by 30th January, 2020, in Kerala, where the first death
due to corona in Karnataka and 73 announced cases were reported by 12th March, 2020. 1024
announced cases were reported by 29th March, 2020.This indicates that the number of
confirmed cases is increasing rapidly, causing national crises for India. This study aims is to fill a gap between previous studies and the current development of COVID-19 spreading, by extracting a relationship between corona positives as independent and corresponding deaths as a dependent variable. This research statistically analyses the mortality in 10 days of every month. A mathematical model to predict the new deceased cases corresponding infected cases in a practical scenario is proposed. An approximate prediction of mortality corresponding to new predicted cases can be easily performed using the proposed model. As most of the other countries have reached their peaks, confirmed cases start decreasing. By analyzing these countries’ data considering the lockdown, the peak ratio is identified using all countries’ population and the decreasing rate of confirmed cases after the peak has been achieved. The same calculation has been done for death and recovered cases. This average peak ratio is used to identify India’s COVID patients’ peak value. The decreasing rate is also used to define the rate of confirmed cases and mortality after the peak has occurred. The model has also been verified in different countries to identify the significance of the model.
Keywords: COVID-19, Correlation, regression, a test of significance, Machine Learning.
1. Introduction
Saudi Arabia faced a novel virus called Middle East Respiratory Syndrome Coronavirus (MERS-CoV) in 2012, which belongs to the Coronavirus family. Infection with MERS-COV leaded to fatal complications. In1) the
authors developed several models to predict the cases’ stability and chances of recovery in MERS-COV infected cases. The reports on COVID-19 indicated that it is a pneumonia like SARS, in which 26 to 33 per cent of patients required intensive care and the mortality rate 4 to 15 % 2,3). China4,5), Lombardy, Italy6) and New York,
USA7) has described clinical presentation and early
outcomes on the characteristics of COVID-19 patients. Outbreaks of the COVID-19 epidemic have been causing worldwide health concerns since December 2019. The virus causes fever, cough, fatigue and mild to severe respiratory complications, which, if very severe, can lead
cumulated cases of infection across the world and 3,045 deaths had been reported. On 11th March, the virus
outbreak was declared a pandemic by the World Health Organization8). So far, it has been reported that 13.8–
19.1% of COVID-19-infected patients in Wuhan, China, became severely ill9,10). Furthermore, recent reports have
exposed an astonishing case fatality rate of 61.5% for critical cases and increasing sharply with age. The severity of cases puts great pressure on medical services, leading to a shortage of intensive care resources. Unfortunately, there is no currently available prognostic biomarker to distinguish patients that require immediate medical attention and to estimate their associated mortality rate. The capacity to identify cases that are at imminent risk of death has thus become an urgent yet challenging necessity.
The first case of Coronavirus CoVID-19 disease in India was announced on 30th January 202011). India is
in Asia. As of 11 June 2020, the Ministry of Health and Family Welfare12) have confirmed a total of 286,579
cases, 141,029 recoveries (including 1 migration) and 8,102 deaths in India13), while the global number of
infected cases is 7255960 and number of confirmed deaths is 412583, referring to World Health Organization (WHO)14). In India, 1024 confirmed cases and 27
numbers of confirmed deaths were reported by 29th
March, 2020. By the time, the number of confirmed infected cases has been rapidly increased in India. The growth rate of confirmed cases was rapid until 29th May,
2020, while India’s fatality rate is relatively lower at 2.80%, against the global 6.13% as of 3rd June 202015).
People with low immunity, old age, and medical problems, specially related to lungs, are more prone to such cases. The rate of increasing cases in six cities
Mumbai, Delhi, Ahmedabad, Chennai, Pune and Kol kata is higher in India’s reported cases in India.
Lakshadweep is reported as the only region without any confirmed cases on 24th May, 2020.
This research statistically analyses the mortality rate in 10 days of every month. A new mathematical model to predict mortality rate corresponding to the new cases in the current scenario is proposed.
This research aims to study the mortality rate in an interval of 10 days of every month and develop a model to identify the COVID-19 spread in India by analyzing the data and ratios defined from the various fields available in different countries considering the complete lockdown or partial lockdown respectively. Based on real collected data and published reports this model can approximately predict the number of deaths due to Covid19. The study would give an overview of India’s current situation besides, it may show the main parameters used to build a forecasting model.
COVID-19 cure and prediction are becoming a problem for almost all countries. The prediction of cases, their cure, mortality and recovery is becoming a hitch for us. Most of the countries are seeking for the peak, trying to flatten the curve. The top 15 countries are taking in our paper having maximum COVID-19 cases till 2nd June 2020 (Refer Figure: 1). It has also seen that besides lockdown, some countries like Italy, Spain, Germany, France, Korea16,17) etc. are successful in achieving this.
However some countries like India, Brazil, Chile, Peru, and Mexico are still looking for a peak point and reduction in cases to see the graph to be flattened. Also, it has been seen that top countries have the same trend as compared to each other, and lockdown is also having an approximately equal effect on the daily cases if we consider the population into account. When we compare the peak of these countries those achieved the flatten curve with their population, then some wonderful parameters came into consideration. By encountered these parameters in the prediction of COVID cases a graph has been prepared, a model & graph has been built. After comparing the model R-Square, its relevance was
established. The model has been built for daily confirmed cases, total cases, mortality & recovery using the parameter developed, and graphs are plotted. Let us see how the model is predicting the cases.
Figure. 1:Top 15 Countries with COVID Cases
2. Dataset description
We obtained our data set in table 1 from the data published by the Ministry of Health and Family Welfare on their website. We used the data on COVID-19 cases reported between 1st March, 2020 and
8th June, 2020. The data is published in the category of
State/Union Territory wise per day new cases and deaths18). A sample of the original dataset is given table
no. 1. The dataset was published in different formats. Some of the records are available in text files some in the image and some tabulated form. Therefore, first we prepare data in a unified format appropriate for the regression model. To find our prediction model, we take the data (COVID-19 cases) in a sum of every 10 days of Months March, April, May and June respectively. The reason for taking 10 days is that if a person is infected in a particular day then he may recover or he may cause death within this duration. Suppose if all the persons infected in this duration recovered, then the recovery rate may be considered as 100 %. Similarly, if all the COVID-19 patients cause death, mortality can be considered 100% during this interval.
3. Methodology
We have taken the number of confirmed cases as an independent variable and number of deaths as a dependent variable. Both statistical analysis and t-test are used to analyze the collected data and ensure the impact of COVID-19 on mortality. First, we find the correlation coefficient between these two variables. In statistics, Correlation is a method used to appraise an approximate linear association between two continuous variables. Correlation is measured by Karl Pearson’s coefficient r that takes value in the range −1 to +1 which is a dimensionless quantity and represents the strength of
linear association between two variables.
Then we use Student’s t-test to confirm the average number of mortality rates with the previous number of cases. T-test also called the Student’s t-test, is often used as a statistical method to assess whether the mean value of the data from an independent sample which follows a normal distribution is consistent with or depart significantly from the mean value of a null hypothesis, or whether the difference between the means of two independent samples which follow a normal distribution is statistically significant.
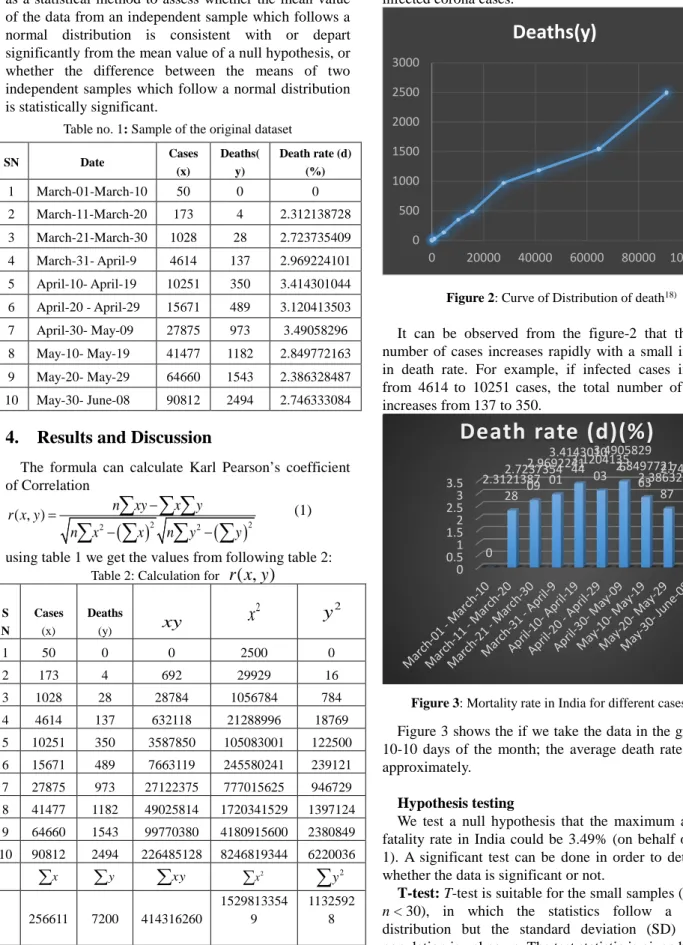
Table no. 1: Sample of the original dataset
SN Date Cases (x) Deaths( y) Death rate (d) (%) 1 March-01-March-10 50 0 0 2 March-11-March-20 173 4 2.312138728 3 March-21-March-30 1028 28 2.723735409 4 March-31- April-9 4614 137 2.969224101 5 April-10- April-19 10251 350 3.414301044 6 April-20 - April-29 15671 489 3.120413503 7 April-30- May-09 27875 973 3.49058296 8 May-10- May-19 41477 1182 2.849772163 9 May-20- May-29 64660 1543 2.386328487 10 May-30- June-08 90812 2494 2.746333084
4. Results and Discussion
The formula can calculate Karl Pearson’s coefficient of Correlation
( )
2( )
2 2 2 ( , ) n xy x y r x y n x x n y y − = − −∑ ∑ ∑
∑
∑
∑
∑
(1)using table 1 we get the values from following table 2: Table 2:Calculation for
r x y
( , )
S N Cases (x) Deaths (y)
xy
2x
y
2 1 50 0 0 2500 0 2 173 4 692 29929 16 3 1028 28 28784 1056784 784 4 4614 137 632118 21288996 18769 5 10251 350 3587850 105083001 122500 6 15671 489 7663119 245580241 239121 7 27875 973 27122375 777015625 946729 8 41477 1182 49025814 1720341529 1397124 9 64660 1543 99770380 4180915600 2380849 10 90812 2494 226485128 8246819344 6220036 x∑
∑
y∑
xy 2 x∑
2 y∑
256611 7200 414316260 1529813354 9 1132592 8Using (1)and table 2,
r x y
( , )
=
0.992310908
. This value ofr x y
( , )
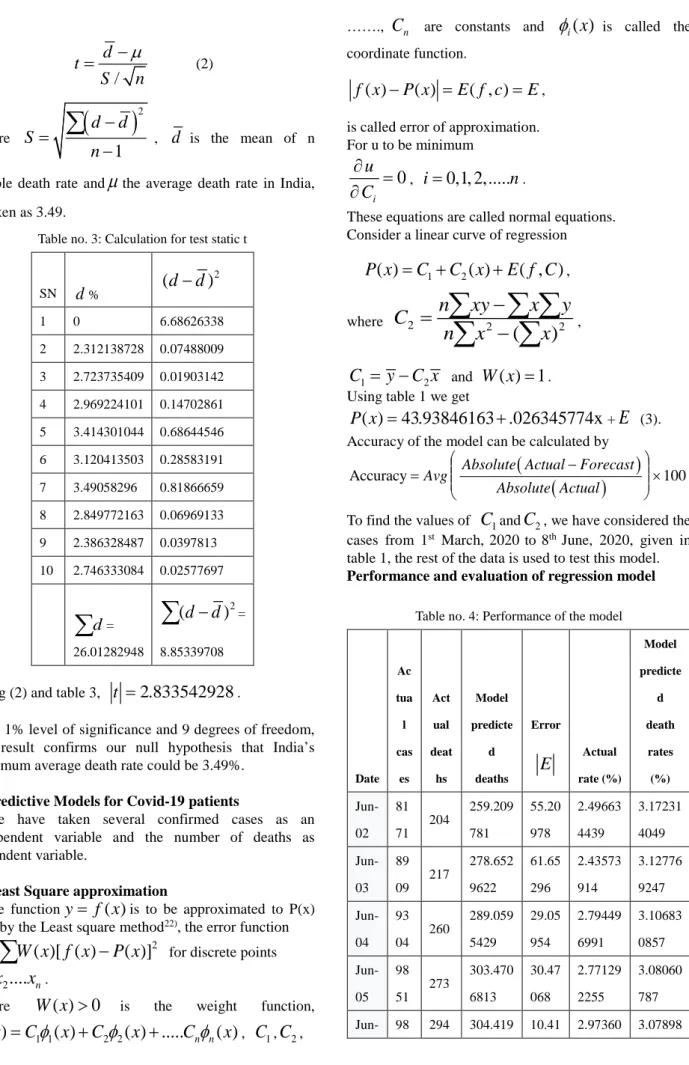
shows the high degree positive correlation between x and y. It indicates that the mortality rate will linearly increase with the increase of infected corona cases.Figure 2: Curve of Distribution of death18)
It can be observed from the figure-2 that the total number of cases increases rapidly with a small increase in death rate. For example, if infected cases increase from 4614 to 10251 cases, the total number of deaths increases from 137 to 350.
Figure 3: Mortality rate in India for different cases23)
Figure 3 shows the if we take the data in the group of 10-10 days of the month; the average death rate is 2.% approximately.
Hypothesis testing
We test a null hypothesis that the maximum average fatality rate in India could be 3.49% (on behalf of table 1). A significant test can be done in order to determine whether the data is significant or not.
T-test: T-test is suitable for the small samples (such as
n < 30), in which the statistics follow a normal distribution but the standard deviation (SD) of the
0 500 1000 1500 2000 2500 3000 0 20000 40000 60000 80000 100000
Deaths(y)
0 0.51 1.52 2.53 3.5 0 2.3121387 28 2.7237354 09 2.9692241 01 3.4143010 44 3.1204135 03 3.4905829 6 2.8497721 63 2.3863284 87 2.7463330 84Death rate (d)(%)
/
d
t
S
n
µ
−
=
(2) Where(
)
21
d
d
S
n
−
=
−
∑
,d
is the mean of nsample death rate and
µ
the average death rate in India, is taken as 3.49.Table no. 3: Calculation for test static t
SN
d
% 2(
d
−
d
)
1 0 6.68626338 2 2.312138728 0.07488009 3 2.723735409 0.01903142 4 2.969224101 0.14702861 5 3.414301044 0.68644546 6 3.120413503 0.28583191 7 3.49058296 0.81866659 8 2.849772163 0.06969133 9 2.386328487 0.0397813 10 2.746333084 0.02577697d
∑
= 26.01282948 2(
d
−
d
)
∑
= 8.85339708 Using (2) and table 3,t
=
2.833542928
.At 1% level of significance and 9 degrees of freedom, this result confirms our null hypothesis that India’s maximum average death rate could be 3.49%.
Predictive Models for Covid-19 patients
We have taken several confirmed cases as an independent variable and the number of deaths as dependent variable.
Least Square approximation
If the function
y
=
f x
( )
is to be approximated to P(x) then by the Least square method22), the error function2
( )[ ( )
( )]
u
=
∑
W x f x
−
P x
for discrete points 1,
2....
nx x
x
.Where
W x
( )
>
0
is the weight function,1 1 2 2
( )
( )
( ) ...
n n( )
P x
=
C
φ
x
+
C
φ
x
+
C
φ
x
,C
1,C
2,…….,
C
n are constants andφ
i( )
x
is called the coordinate function.( )
( )
( , )
f x
−
P x
=
E f c
=
E
, is called error of approximation. For u to be minimum0
iu
C
∂
=
∂
,i
=
0,1, 2,...
n
.These equations are called normal equations. Consider a linear curve of regression
1 2
( )
( )
( , )
P x
=
C
+
C x
+
E f C
, where 2 2 2(
)
n
xy
x
y
C
n
x
x
−
=
−
∑ ∑ ∑
∑
∑
, 1 2C
= −
y
C x
andW x
( ) 1
=
. Using table 1 we get( )
43.93846163 .026345774x
P x
=
+
+E
(3). Accuracy of the model can be calculated by(
)
(
)
Accuracy Avg Absolute Actual Forecast 100
Absolute Actual
−
= ×
To find the values of
C
1andC
2, we have considered the cases from 1st March, 2020 to 8th June, 2020, given intable 1, the rest of the data is used to test this model.
Performance and evaluation of regression model
Table no. 4: Performance of the model
Date Ac tua l cas es Act ual deat hs Model predicte d deaths Error
E
Actual rate (%) Model predicte d death rates (%) Jun-02 81 71 204 259.209 781 55.20 978 2.49663 4439 3.17231 4049 Jun-03 89 09 217 278.652 9622 61.65 296 2.43573 914 3.12776 9247 Jun-04 93 04 260 289.059 5429 29.05 954 2.79449 6991 3.10683 0857 Jun-05 98 51 273 303.470 6813 30.47 068 2.77129 2255 3.08060 787 Jun- 98 294 304.419 10.41 2.97360 3.0789806 87 1292 913 1699 3809 Jun-07 99 71 287 306.632 1742 19.63 217 2.87834 7207 3.07523 9938 Jun-08 99 83 271 306.948 3235 35.94 832 2.71461 4845 3.07471 0242 Jun-09 99 87 271 307.053 7066 36.05 371 2.71352 7586 3.07453 396 Jun-10 99 85 274 307.001 015 33.00 102 2.74411 6174 3.07462 2083 Tot al 86 04 8 235 1 2662.44 7316 311.4 473 2.74411 6174 3.07462 2083 In table no. 4, the performance of the model (3) is evaluated and compared with available data. In general, the accuracy of the model is between 71.59 to 96.45. It is believed that the accuracy of the model can be enhanced with the use of more collected data of further Covid-19 cases.
A predictive model of COVID Confirmed Cases:
A data of Top 15 countries23) having the highest
COVID cases is taken for the calculation. The graphs of countries are plotted against days to see the pattern of daily COVID confirmed cases. Among them we found 10 countries have reached the peak and also reverse cycle has been achieved in decreasing the total daily cases of COVID. So from these 15 countries, 10 countries are taken in the calculation. The confirmed cases graphs of these countries are plotted (using machine learning algorithm)24) in figure23) 4,5,6.
Figure. 4: COVID Daily Cases Curve of Canada, France,
Figure. 5: COVID Daily Cases Curve of Iran, Italy, Spain
Figure. 6: COVID Daily Cases Curve of Peru, Turkey, UK, US
Almost all countries in these 10 had been gone through lockdown at the initial state except the United States. The maximum/peak points of daily confirmed cases are noted. All of these countries, curves start bending after this peak value. Now, if we compare this peak point total cases with the total population then almost the same ratio (Table No.: 5) has been achieved for all of these countries. It has been noted that besides lockdown this ratio (CPR) is approximately the same for
all of these countries25).
So, it has seemed that the population act a major role in predicting the COVID-19 cases for any country. It is also observed despite of lockdown, any country will be having approximately cases equal to:
CPR * Population of Country.
The total cases on 2nd June are also observed in the
table, at this point these countries’ graph came close to zero or bare minimum after the peak point achieved. A ratio TPR is calculated here, i.e. the ratio of total cases to
the population of the country. This ratio established a connection for total cases where the graph flattens and
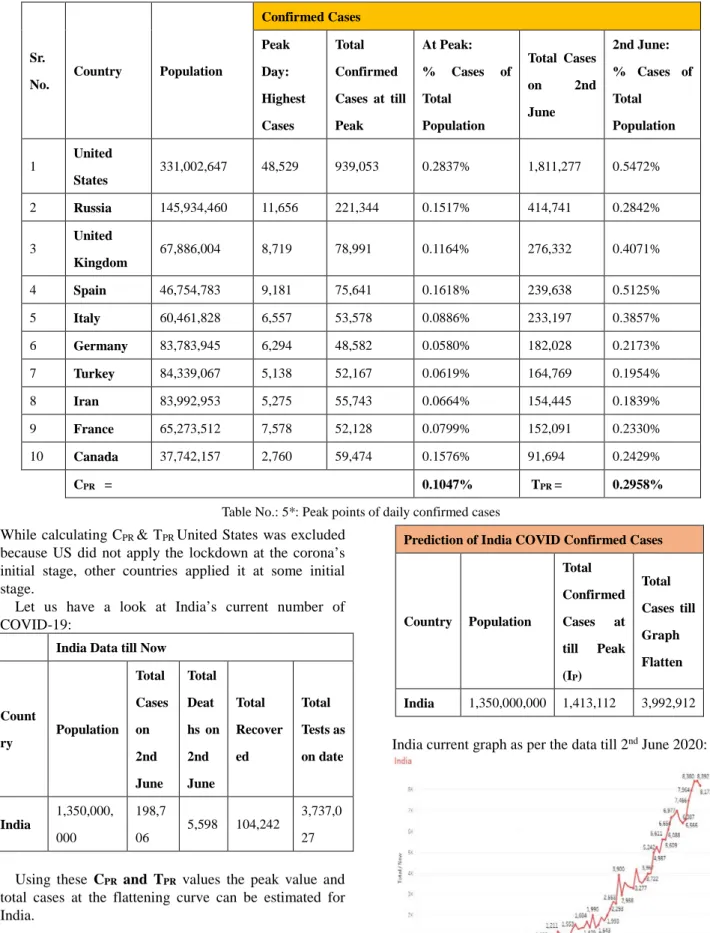
Table No.: 5*: Peak points of daily confirmed cases While calculating CPR & TPR United States was excluded
because US did not apply the lockdown at the corona’s initial stage, other countries applied it at some initial stage.
Let us have a look at India’s current number of COVID-19:
India Data till Now
Count ry Population Total Cases on 2nd June Total Deat hs on 2nd June Total Recover ed Total Tests as on date India 1,350,000, 000 198,7 06 5,598 104,242 3,737,0 27 Using these CPR and TPR values the peak value and total cases at the flattening curve can be estimated for India.
Considering the population of India let us calculate predicted values for India:
Prediction of India COVID Confirmed Cases
Country Population Total Confirmed Cases at till Peak (IP) Total Cases till Graph Flatten India 1,350,000,000 1,413,112 3,992,912 India current graph as per the data till 2nd June 2020:
Figure. 7: India current Daily COVID Cases Curve Sr. No. Country Population Confirmed Cases Peak Day: Highest Cases Total Confirmed Cases at till Peak At Peak: % Cases of Total Population Total Cases on 2nd June 2nd June: % Cases of Total Population 1 United States 331,002,647 48,529 939,053 0.2837% 1,811,277 0.5472% 2 Russia 145,934,460 11,656 221,344 0.1517% 414,741 0.2842% 3 United Kingdom 67,886,004 8,719 78,991 0.1164% 276,332 0.4071% 4 Spain 46,754,783 9,181 75,641 0.1618% 239,638 0.5125% 5 Italy 60,461,828 6,557 53,578 0.0886% 233,197 0.3857% 6 Germany 83,783,945 6,294 48,582 0.0580% 182,028 0.2173% 7 Turkey 84,339,067 5,138 52,167 0.0619% 164,769 0.1954% 8 Iran 83,992,953 5,275 55,743 0.0664% 154,445 0.1839% 9 France 65,273,512 7,578 52,128 0.0799% 152,091 0.2330% 10 Canada 37,742,157 2,760 59,474 0.1576% 91,694 0.2429% CPR = 0.1047% TPR = 0.2958%
Now consider the average current rate of daily cases as CR & applying the regression model to predict the future values of daily cases. When the cases reach the IP
(peak values) then the CR for the model will start decreasing.
Daily Cases (DC) = Total Cases*
(CR %)…………..………..… (Till DC <
IP)
Daily Cases (DC) = Total Cases * (CR(t-1) - (CR(t-1) *5 %))……… (Till DC > IP)
Where t refers to the current day, CR(t-1) is value of CR at t-1 day (i.e. previous day).
After applying the parameters to the model, the model gave the daily case values and total cases. These values are plotted (Figure:8, which gives a very accurate prediction of the COVID-19 cases). The R-Squared value of predicted confirmed cases is 96.67%.
Figure. 8: India predicted Daily New and Total COVID Cases Curve (With Peak)
It is seen from the prediction model that a peak of India COVID total cases will be in 1st week of July, at
this point, the daily cases are its peak i.e. CPR % of the
total population of India and after this week the curves start bending. The total cases curve will also start flatten in the month of August/September. So, using this, the country can plan for health care needs.
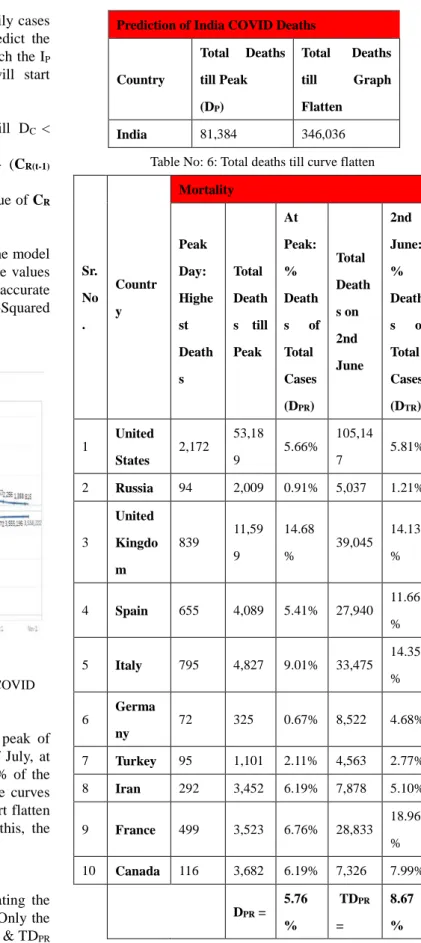
A predictive model of COVID Deaths
The same phenomena are used while calculating the total deaths due to COVID-19 for any country. Only the difference is now the ration DPR (Deaths at Peak) & TDPR
(Total deaths till curve flatten) are calculated over the total number of cases at peak inspite of population.
(Refer table No.6)
Using these DPR and TDPR deaths at peak and total
Table No: 6: Total deaths till curve flatten
Sr. No . Countr y Mortality Peak Day: Highe st Death s Total Death s till Peak At Peak: % Death s of Total Cases (DPR) Total Death s on 2nd June 2nd June: % Death s of Total Cases (DTR) 1 United States 2,172 53,18 9 5.66% 105,14 7 5.81% 2 Russia 94 2,009 0.91% 5,037 1.21% 3 United Kingdo m 839 11,59 9 14.68 % 39,045 14.13 % 4 Spain 655 4,089 5.41% 27,940 11.66 % 5 Italy 795 4,827 9.01% 33,475 14.35 % 6 Germa ny 72 325 0.67% 8,522 4.68% 7 Turkey 95 1,101 2.11% 4,563 2.77% 8 Iran 292 3,452 6.19% 7,878 5.10% 9 France 499 3,523 6.76% 28,833 18.96 % 10 Canada 116 3,682 6.19% 7,326 7.99% DPR = 5.76 % TDPR = 8.67 % Now consider the average current rate of daily deaths as DR & applying the regression model to predict the future values of daily deaths.
Daily Deaths (DD) = Total Cases * (DR %)
After applying the death parameters to the model, it Prediction of India COVID Deaths
Country Total Deaths till Peak (DP) Total Deaths till Graph Flatten India 81,384 346,036
plotted (Figure:9, which gives a very accurate prediction of the COVID-19 deaths). The R-Squared value of predicted deaths is 92.13%.
Figure18). 9: India predicted Daily and Total COVID Deaths Curve (With Peak)
The predictive model of COVID Recovered Cases
A model is also formed to predict the recovery rate, total recovery until the graph flattens and total test to be conducted versus population until any country’s graph started to flatten. A data is collected for the same top 10 countries and an average of percent total recovery over total confirmed cases is calculated for modelling. (Refer Table: 7)
Table: 7: Average of percent total recovery over total confirmed cases S r . N o . Cou ntry
Recovered Cases Test Conducted
Total Reco vered Till Date % Total Recover ed of Total Confirm ed Total Tests as on date % Total Tests of Populat ion % Confirm ed Cases of Total Test Conduct ed 1 Unit ed Stat es 688,6 92 38.02% 16,93 6,891 5.12% 10.69% 2 Rus sia 204,6 23 49.34% 10,92 3,108 7.48% 3.80% 3 Unit ed Not Avail able -- 2,144, 626 3.16% 12.88% Kin gdo m 4 Spai n 150,0 00 62.59% 2,536, 234 5.42% 9.45% 5 Ital y 160,9 38 69.01% 3,910, 133 6.47% 5.96% 6 Ger man y 167,8 00 92.18% 3,952, 971 4.72% 4.60% 7 Tur key 130,8 52 79.42% 2,070, 719 2.46% 7.96% 8 Iran 127,4 85 82.54% 935,8 94 1.11% 16.50% 9 Fra nce 69,45 5 45.67% 1,384, 633 2.12% 10.98% 1 0 Can ada 51,04 8 55.67% 1,691, 297 4.48% 5.42% RPR 63.83% TSPR 4.16% 8.62%
Where RPR is the recovery rate of total confirmed cases and TSPR is the percent total test to be conducted over population until the graph flattens of any country. Using RPR and TSPR values of total recovered cases and total test to be conducted till graph flatten are calculated as follows: Prediction Based on Tests Conduction Prediction on Recovered Cases Coun try Test Cond ucted Till date Total Tests of Popula tion will be conduc ted till graph Flatten Curr ent Reco very Rate Total Reco vered at Grap h Flatt en India % age of recover ed cases at Graph Flatten India 3,737, 027 56,160, 000 RR = 45% 2,677 ,248 66.89%
It has been seen that till India graph flatten total approximate 5.62 Crore test to be conducted and the recovery rate per day will be 67% till graph flatten.
After applying the regression model, the graph was plotted for the daily recovered cases in India (figure 10).
Daily Recovered Cases (RD) = Total Cases * (RR(t-1) + (RR(t-1)*0.25%))
Where t refers to the current day, RR(t-1) is value of RR at t-1 day (i.e. previous day). The R-Squared value of predicted recovered cases is 98.1%.
Figure. 10: India recovered Total COVID Cases Curve The model has been built for prediction of COVID confirmed cases, peak confirmed cases, deaths, peak deaths and recovery rate. The model is self-explanatory and well established. The actual data of top 15 countries till 2nd June 2020 was used to build the model.
Conclusion
The actual data of the top 15 countries till 2nd June
2020 was used to build the model. We have analyzed the data of Covid-19 spread in India in current scenarios. A mathematical model is established following the actual data trend of Covid-19 spread in India. This model can find an approximate fatality rate in India. The performance of the model is evaluated and compared with available data. The calculated value of correlation coefficient indicating that the mortality rate will linearly increase with the increase of corona infected cases and t-test confirms our null hypothesis that the maximum average death rate in India could be 3.49%. As future work we are planning to collect the data in order to collect more information related to 3.49% death cases due to COVID-19. It has been observed that countries with lockdown are still having a total COVID case equal to CPR percent of its population and total cases till the country graph flatten will be TPR percent of the total population because of virus. After this much spread only any country can be in the state of bending the curve for
found that total deaths till any country flatten the curve will approximately DPRpercent of its total population. The recovery rate is quite good for lockdown countries i.e. 67% till they reach the peak and which is further improving as soon as daily cases reach to minimum/zero. Regarding Coronavirus testing, it’s found that a country will be doing an approximate 4 % test of its population till reaching the end of the pandemic/graph flattens. Sharing information can help researchers and governments to understand the mortality rate during virus transmission. The results also found that regression could give initial an indicator of the possibility of surviving or dying, based on the collected data.
Funding: No funding sources and no competing interest.
Ethical Approval:No ethical approval is required.
Conflicts of Interest Statement: The authors have no affiliations with or involvement in any organization or entity with any financial interest (such as honoraria; educational grants; participation in speakers’ bureaus; membership, employment, consultancies, stock ownership, or other equity interest; and expert testimony or patent-licensing arrangements), or non-financial interest (such as personal or professional relationships, affiliations, knowledge or beliefs) in the subject matter or materials discussed in this manuscript.
References
1) I. Turaiki, M. Alshahrani, T. Almutairi, “Building predictive models for Mers-CoV infections using data mining techniques”. Journal of Infection and Public Health 2016: 9,744-748.
2) N. Zhu, D. Zhang, W. Wang, X. Li, B. Yang, J. Song, “China novel coronavirus investigating and research team”. A novel coronavirus from patients with pneumonia in China, 2019. N Engl J Med 2020; 382: 727-33.
3) D. Wang, B. Hu, C. Hu, F. Zhu, X. Liu X, J. Zhang, “Clinical characteristics of 138 hospitalized patients with 2019 novel coronavirus-infected pneumonia in Wuhan”, China. JAMA 2020; 323: 1061-9.
4) Z. Wu, J.M. McGoogan, “Characteristics of and important lessons from the coronavirus disease 2019 (COVID-19) outbreak in China: Summary of a report of 72314 cases from the Chinese center for Disease Control and Prevention”. JAMA 2020; 323: 1239-42.
5) W.J. Guan, Z.Y. Ni, Y. Hu, W.H. Liang, “Clinical characteristics of coronavirus disease 2019 in China”. N Engl J Med 2020; 382: 1708-20.
6) G. Grassell, A. Zangrillo, M. Antonelli, L. Cabrini, A. Castelli, “Baseline characteristics and outcomes of 1591 patients infected with SARS-CoV-2 admitted to ICUs of the Lombardy region, Italy”. JAMA 2020; 323: 1574-81.
characteristics, co-morbidities and outcomes among 5700 patients hospitalized with COVID-19 in the New York city area”. JAMA 2020; 323: 2052-9. 8) World Health Organization. Coronavirus Disease
2019 (COVID-19) Situation Report 68, 28th March
2020 (2020); https://www.who.int/docs/default-source/coronaviru
s /situation-reports/20200328-sitrep-68-covid-19.pdf 9) C. Huang, “Clinical features of patients infected
with 2019 novel coronavirus in Wuhan”, China. Lancet 2020: 395, 497–506.
10) L. Zhonghua, B. Xing, Z. Xue. “Novel Coronavirus Pneumonia Emergency Response Epidemiology Team The epidemiological characteristics of an outbreak of 2019 novel coronavirus diseases (COVID-19) in China”. 2020: 41, 145–151.
11) M.A. Andrews, B. Areekal, K.R. Rajesh, J. Krishnan, R. Suryakala, B. Krishnan, “First confirmed case of COVID-19 infection in India”: A case report. Indian J Med Res 2020; 151: 490-2.
12) "India most infected by Covid-19 among Asian countries, leaves Turkey behind". Hindustan Times. 29th May 2020. Retrieved 30th May 2020.
13) "Home | Ministry of Health and Family Welfare | GOI". mohfw.gov.in. Retrieved 30 May 2020.
14) World Health Organization (WHO) Coronavirus Disease (COVID-19) Dashboard Data last updated: 2020/5/29, 7:02pm CEST https://covid19.who.int.
15) "Coronavirus pandemic (COVID-19) in India". Our World in Data. Retrieved 20th May 2020.
16) J.H. Yoo, S.T. Hong, “The outbreak cases with the novel coronavirus suggest upgraded quarantine and isolation in Korea”. Journal of Korean Medical Science, 35(5) (2020).
17) Korea Centers for Disease Control and Prevention (2020).
http://ghdx.healthdata.org/organizations/korea-center s-disease-control-and-prevention-kcdc
18) New COVID-19 cases in India by state and union territory.https://en.wikipedia.org/wiki/COVID-19_pa ndemic_in_India#Escaping_of_suspected_people 19) P. Tungjiratthitikan, “Accidents in Thai Industry
between 2001 and 2017”, Evergreen Joint Journal of Novel Carbon Resource Sciences & Green Asia Strategy, Vol. 05, Issue 02, pp.86-92, June 2018. 20) S. Kitjanukit, “Attitude toward Bio remediation
Related Technology and Relation with Company Social Responsibility”, Evergreen Joint Journal of Novel Carbon Resource Sciences & Green Asia Strategy, Vol. 06, Issue 03, pp240-245, September, 2019.
21) M. Rahman, A. Pal, K. Uddin, T. Kyaw, B.B. Saha, “Statistical Analysis of Optimized Isotherm Model for Maxsorb III/Ethanol and Silica Gel/Water Pairs”, Evergreen Joint Journal of Novel Carbon Resource Sciences & Green Asia Strategy, Vol. 05, Issue 04,
pp.1-12, December 2018.
22) M.R. Bhatnagar, “COVID-19: Mathematical Modeling and Predictions”, submitted to ARXIV.
Online available at: http://web.iitd.ac.in/~manav/COVID.pdf [Accessed
on April 01, 2020].
23) https://www.worldometers.info/coronavirus /#countries [Accessed on June 02, 2020].
24) G.D. Nugraha, B. Sudiarto, R. Kalamullah, “Machine Learning-based Energy Management System for Prosumer”, Evergreen Joint Journal of Novel Carbon Resource Sciences & Green Asia Strategy, Vol. 07, Issue 02, pp309-313, June, 2020. 25) N. Khan, M. Naushad, “Effects of Corona Virus on
the World Community”. Available at SSRN 3532001(2020).