Comparison of Organic and Conventional Corn,
Soybean, Alfalfa, Oats, And Rye Crops at the
Neely-Kinyon Long-Term Agroecological Research (LTAR)
Site-1998
Dr. Kathleen Delate, assistant professor, Depts. of Horticulture & Agronomy Dr. Cynthia Cambardella, soil scientist, USDA National Soil Tilth Lab
Bob Burcham, farm superintendent, Neely-Kinyon Research and Demonstration Farm Introduction
Organic farming has increased to a $4.2 billion industry in the U.S. and continues to expand approximately 20% annually (18). In Iowa alone, organic acreage for all crops has increased from 13,000 in 1995 to 120,000 in 1998. Organic corn production in 1997 was reported at 9,920 acres, and organic soybean on approximately 60,000 acres. (13). International demand for organic products, particularly from the Japanese and European markets, is also on the rise. Farmers interested in transitioning some or all of their land into organic production require information on best management practices for these systems. Once the transition is complete, comparable yields to conventional systems can be obtained (1,16,20,27). In addition, organic products garner a 20-300% premium price in the marketplace, with organic clear-hilum soybeans, for example, averaging twice to three times the price of conventional clear-hilum soybeans in 1998 (2). Soil health, maintained through crop rotations, organic matter additions (manure/compost), and cover crops (10,14,19,21), has been the basis of successful organic farming.
The Leopold Center for Sustainable Agriculture has identified the need for dedicated lands throughout Iowa where research on organic practices can be conducted over the long term. In the first year trials at the Neely-Kinyon Long-Term Agroecological Research (LTAR) Site, we examined the agronomic and economic performance of conventional and organic systems, using required practices for certified organic production (24).
Materials and Methods
Experimental Design
The Neely-Kinyon Farm Association dedicated a 17-acre block for this long-term study. One-third of the block had previously been in alfalfa (3 years) and the remaining two-thirds in a corn-soybean rotation (1997 crop-soybean). In order to equalize all plots as much as possible, the field was moldboard plowed, disked, and field cultivated for seedbed preparation on May 4, 11, and 13, 1998, respectively. Treatments were assigned in a completely randomized statistical design to the forty, quarter-acre plots constituting the experiment. The plot plan is shown below. Treatments were as follows: Conventional Soybean rotation; organic Soybean-Oats (with alfalfa); organic
Corn-plowdown in the spring prior to soybean planting each year). All crops in all rotations will be planted each year. While the final treatment (soybean-rye) is currently
discouraged (and with certain certification agencies, prohibited) (17), many farmers are interested in this rotation in order to continue production of the most lucrative organic crop, clear-hilum soybeans.
Results and Discussion
Plant Performance
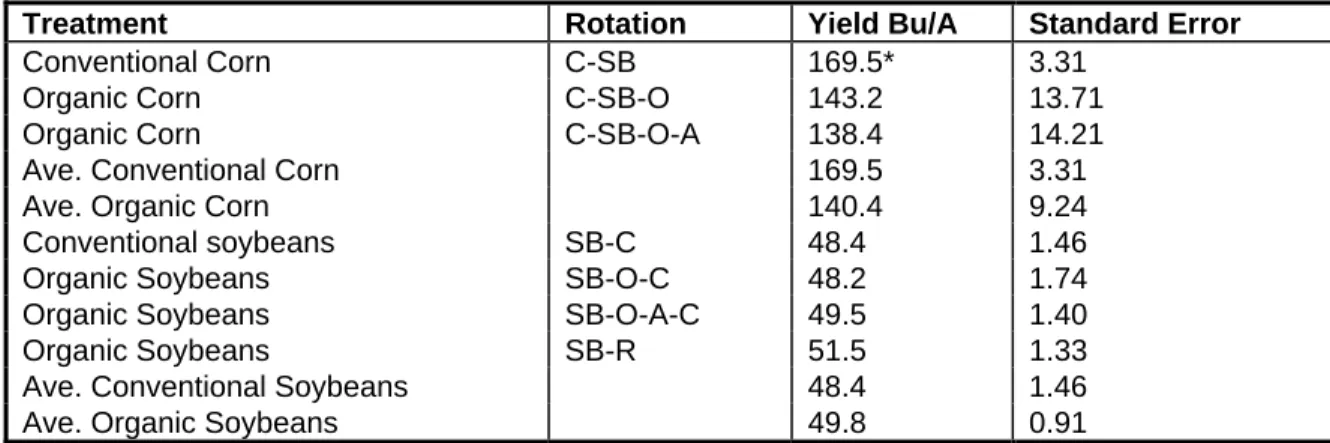
First-year results from the Neely-Kinyon LTAR site were very encouraging. There were no statistically significant differences in yields between the organic and conventional corn and soybeans (P=.05) (Table 1). The greatest organic corn yield (177 bushels/acre) was produced on ground previously in alfalfa. Conventional corn yields ranged from 162 to 178 bushels/acre and organic yields ranged from 116 to 177 bushels/acre. Because of the variability among organic plots, significant differences were not obtained. Despite adjusting fertilization rates based on previous crop to provide similar nutrients to each system, plots previously in alfalfa produced greater yields overall. Organic corn averaged 174 and 127 bushels/acre on ground previously in alfalfa and soybean,
respectively. Conventional corn averaged 173 and 166 bushels/acre on ground previously in alfalfa and soybean, respectively.
Table 1. Yield analysis from organic vs. conventional corn and soybeans.
Treatment Rotation Yield Bu/A Standard Error
Conventional Corn C-SB 169.5* 3.31
Organic Corn C-SB-O 143.2 13.71
Organic Corn C-SB-O-A 138.4 14.21
Ave. Conventional Corn 169.5 3.31
Ave. Organic Corn 140.4 9.24
Conventional soybeans SB-C 48.4 1.46
Organic Soybeans SB-O-C 48.2 1.74
Organic Soybeans SB-O-A-C 49.5 1.40
Organic Soybeans SB-R 51.5 1.33
Ave. Conventional Soybeans 48.4 1.46
Ave. Organic Soybeans 49.8 0.91
*There were no statistically significant differences in yields between systems, P=.05).
Rotations: C-SB Corn-Soybean
C-SB-O Corn-Soybean-Oat (with alfalfa) C-SB-O-A Corn-Soybean-Oat (with alfalfa)-Alfalfa SB-R Soybean with Rye plowdown
Organic oat yields averaged 41 bushels/acre, and 43 square bales of straw/acre. Because of the excessive rainfall during the growing season, the test weight of the oats was less than required for food-grade milling (36 lb/bushel). The organic oats test-weighed 32 lb/bushel before screening (organic farmers usually screen oats to remove unfilled oats and increase test-weight), which reflected averages in the Greenfield area. The protein
Grain Analysis
Corn grain analyses for protein, oil and starch exhibited significant differences only for protein content, with the conventional corn having a higher content. Greater
concentrations could have been due to the relative deficiency of nitrogen in the organic plots, although grain protein averages for the organic corn were similar to 1997 Iowa averages (12). However, it must be noted that 1997 averages were lower than normal. Soybean grain analysis demonstrated no significant differences between conventional and organic systems, with average protein approximately 39%. Again, these levels compared favorably to 1997 averages.
Economical Analysis
Cost of production studies for corn and soybean systems are presented in Tables 2-3. Costs represent actual costs incurred on the project. ISU projected costs of production for similar operations are approximately the same as our costs, despite individual differences in costs of specific operations (e.g., disking). Selling price for organic crops represented 1998 prices (F.O.B. or pick-up on the farm), as is the practice for many organic
marketers (2). Prices also reflect the price obtainable for “certified organic” crops, or crops grown on land without synthetic chemicals for three years prior to harvest. Some of the crops grown at the LTAR site would have qualified for certified organic (on land previously in unsprayed alfalfa), while others would be considered “in transition.” Selling price for transitional soybeans in 1998 averaged $10/bushel.
Table 2. LTAR soybean economic analysis, ISU Neely-Kinyon Farm, 1998.
Production Costs (actual cost per acre)
Organic Conventional
Moldboard Plowing $8.10 $8.10
Disking 4.00 4.00
Field cultivation (pre-plant) 4.00 4.00
Fertilization 0 0 Planting 9.00 9.00 Seed 31.60 22.00 Herbicide 0 10.38 Sprayer 0 2.50 Rotary Hoeing (2x) 4.00 4.00 Row cultivating (2x) 7.00 7.00 Hand-weeding 14.00 14.00 Combining 21.00 21.00
Hauling Grain to Market 0 (FOB per contract) 3.00
Total Cost per Acre $102.70 $108.98
Returns $850.00
50bu/A x $17.00/bu
$312.00
48 bu/A x $6.50/bu
Profit per Acre $747.30
Excluding price of land
$203.02
Excluding price of land Organic Increase in Returns 368%
Table 3. LTAR corn economic analysis, ISU Neely-Kinyon Farm, 1998 Production costs actual cost Organic Conventional Moldboard plowing $8.10 $8.10 Disking 4.00 4.00
Field cultivation (pre plant) 4.00 4.00
Fertilization 8.00 (Manure spreader; compost@150#N/A) 28.80 (Anhydrous ammonia @ 180#N/A) Planting 9.00 9.00 Seed 31.90 31.90 Herbicide 0.00 (Harness@2pts/A) 27.34
Insecticide 0.00 (Force1.5G @9lb/A) 17.91
Sprayer 0.00 2.50
Rotary hoeing (2x) 4.00 4.00
Row cultivating (2x) 7.00 7.00
Hand weeding 88.90 0.00
Combining 23.00 23.00
Hauling grain to market 0.00 7.00
Total Cost Per Acre $187.90 $174.55
Returns $560.00 (140bu/A x $4/bu)
$340.00 (170bu/A x $2.00/bu)
Profit Per Acre $372.10/A
(Excluding price of land)
$165.45/A
(Excluding price of land)
Organic Increase in Returns 227%
Results from the first year at the Neely-Kinyon LTAR site were very promising for organic crops. We expect to see greater differences in the systems, in terms of insect, weed and nematode populations, as rotational effects occur over time. It is also
anticipated that soil quality will improve over time in the organic systems where longer crop rotations, and additions of organic matter from compost and cover crops, occur (8).
References
1. Altieri, M.A. 1995. Agroecology. Westview Press, Boulder, CO.
2. Boes, Jim. 1999. President of Heartland Organic Marketing Cooperative, Greenfield, IA.
3. Blake, G. R. and K.H. Hartge. 1986. Bulk density. p. 363-375. In: A. Klute (ed.) Methods of Soil Analyis. Part 1. 2nd ed. Agron. Monogr. 9. ASA and SSSA, Madison, WI.
4. Blackmer, A.M. and A.P. Mallarino. 1996. Cornstalk testing to evaluate nitrogen management. ISU Pm-1584, Iowa State University, Ames, IA.
6. Cambardella, C. A. 1994. Temporal dynamics of particulate organic matter N and soil nitrate N with and without an oat cover crop. Bull. Ecol. Soc. Am. 75:30. 7. Cambardella, C. A. and E. T. Elliott. 1993. Carbon and nitrogen distribution in
aggregates from cultivated and native grassland soils. Soil Sci. Soc. Am. J. 57:1071-1076.
8. Campbell, C. A. and R. P. Zentner. 1993. Soil organic matter as influenced by crop rotations and fertility. Soil Sci. Soc. Am. Journal 57(4): 1034-1040.
9. Chase, C. and M. Duffy. 1991. An economic comparison of conventional and reduced-chemical farming systems in Iowa. Amer. Jour. Alter. Agri. 6(4): 168-173. 10. Doran, J.W., D.C. Coleman, D.F. Bezdicek, and B.A. Stewart. 1994. Defining Soil
Quality for a Sustainable Environment. Soil Sci. Amer. Spec. Pub. 35, American Society of Agronomy, Madison, WI.
11. Drinkwater, L. E., C. A. Cambardella, J. D. Reeder, and C. W. Rice. 1996. Potentially mineralizable nitrogen as an indicator of biologically active soil nitrogen. p. 217-229.
In: Methods for Assessing Soil Quality. SSSA Spec. Pub. 49. ASA and SSSA, Madison, WI.
12. Hurburgh, C. R. 1997. Quality of corn and soybeans produced in Iowa results of strip-plot sampling, 1997. Iowa Grain Quality Initiative Prog. Iowa State University, Ames, IA.
13. IDALS (Iowa Dept. of Agriculture and Land Stewardship). 1998. Annual Survey on Organic Production, Des Moines, IA.
14. Lal, R. and F.J. Pierce. 1991. Soil Management for Sustainability. Soil and Water Conservation Society, Ankeny, IA.
15. Mehlich, A. 1984. Mehlich No. 3 soil test extractant: A modification of Mehlich No. 2. Commun. Soil Sci. Plan Anal.15:1409-1416.
16. National Research Council. 1989. Alternative Agriculture. National Academy Press, Washington, D.C.
17. OCIA (Organic Crop Improvement Association). 1997. Standards for Organic Certification, OCIA, Linclon, NE.
18. OTA (Organic Trade Association). 1998. OTA Newsletter. OTA, Medford, MA. 19. Parr, J.F., Papendick, R.I., and Colacicco, D. 1986. Recycling of organic wastes for a
sustainable agriculture. In: Lopez-Real, J.M. and R.D. Hodges (eds.), pp. 29-43, The role of microorganisms in a sustainable agriculture. Academic Press, London. 20. Reganold, J.P. 1988. Comparison of soil properties as influenced by organic and
conventional farming systems. Am. J. Alternative Agric. 3:144-145.
21. Roe, N.E., P. J. Stoffella, and D. Graetz. 1997. Composts from various municipal solid-waste feedstocks affect vegetable crops. 2. Growth, yields and fruit quality. J. Amer. Soc. Hort. Sci. 122:433-437.
conductivity for soil quality analysis. In: Methods for Assessing Soil Quality. J. W. Doran and A. J. Jones (eds). Soil Sci. Soc. Am. Publication Number 49. Madison, WI, USA. Pp.169-186.
23. Sparling, G. P. and A. W. West. 1988. A direct extraction method to estimate soil microbial C: Calibration in situ using microbial respiration and 14C-labeled cells. Soil Biol. Biochem. 20:337-343.
24. State of Iowa. 1998. Organic Food Act-Chapter 190C, Iowa Code 1995, Des Moines, IA.
25. Statview. Statistical Software. 1995. Abacus, Inc., Berkeley, CA.
26. Tate, K. R., D. J. Ross, and C. W. Feltham. 1988. A direct extraction method to estimate soil microbial C: Effects of some experimental variables and some different calibration procedures. Soil Biol. Biochem. 20:329-355.
27. USDA 1986. Report and Recommendations on Organic Farming, USDA, Washington, D.C.