EFFECTS OF ORGANOHALOGEN CONTAMINANTS ON STELLER SEA LION SURVIVAL AND FEMALE REPRODUCTION IN THE RUSSIAN FAR EAST
A THESIS
Presented to the Faculty of the University of Alaska Fairbanks
in Partial Fulfillment of the Requirements for the Degree of
MASTER OF SCIENCE
By
Adam Zaleski, M.S.
Fairbanks, Alaska
Abstract
The presence of persistent organohalogen contaminants (OCs) in the habitats of Steller sea lions, Eumetopias jubatus, may influence reproductive rates and possibly survival. The lack of recovery and the reduction in natality for the western stock has no apparent cause and OCs may be potential contributing factors. Among the most common synthetic OCs measured in marine mammal tissues are polychlorinated biphenyls (PCBs),
dichlorodiphenyltrichloroethane (DDT), polybrominated diphenyl ethers (PBDEs), and hexachlorobenzene (HCB). This project’s focus was on the relationship between OCs and the western stock’s lack of recovery. A suite of OCs were quantified from 239
hot-branded pups from 2001 – 2007 at nine Russian Far East rookeries. The use of brand-resighting data provided the opportunity to contrast pup survival, movement,
reproductive success, and age at first reproduction between rookeries and among individuals with varying post-natal loads of OCs. Survival and movement were not affected by OC concentrations, but the estimated probability of survival within the first year was lower than expected at some rookeries. The effects of OCs on reproduction were less clear and no consistent pattern of negative effects emerged. Rookery specific differences indicated that location may be an important variable when considering survival, movement, and reproduction.
Table of Contents
Page
Signature Page ... i
Title Page ... iii
Abstract ... v
Table of Contents ... vii
List of Figures ... x
List of Tables ... xi
List of Appendices ... xiii
Acknowledgements ... xiv
General Introduction ... 1
Contaminants and Toxicity ... 2
Research Objectives ... 6
Chapter 1: The effect of environmental contaminants on western Steller sea lion survival and movement estimated from multi-state mark-recapture methods ... 8
Abstract ... 8 Introduction ... 9 Methods... 13 Sample Collection ... 13 Model Estimates... 15 Results ... 19 Discussion ... 22
Acknowledgements ... 28
Literature Cited ... 29
Tables ... 34
Figures... 38
Chapter 2: Concentrations of post-natal organohalogen contaminants and associations with female reproductive success in western Steller sea lions (Eumetopias jubatus) .. 44
Abstract ... 44 Introduction ... 45 Methods... 49 Sample Collection ... 49 Chemical Analyses... 51 Statistical Analyses ... 53 Results ... 55 Female SSL (n = 25) sampled in 2002 ... 55 Reproductive Success ... 55
Age at First Reproduction ... 56
Female SSL (n = 103) sampled from 2001 – 2007 ... 57
Reproductive Success ... 58
Age at First Reproduction ... 59
Discussion ... 62
Female SSL (n = 25) sampled in 2002 ... 63
Acknowledgements ... 70 Literature Cited ... 71 Tables ... 77 Figures... 99 Appendices ... 102 General Conclusions ... 110 Literature Cited ... 114
List of Figures
Page
Figure 1.1 Map of Steller sea lion range and rookeries ... 38
Figure 1.2 Map showing all 17 resighting locations ... 39
Figure 1.3 The average whole blood OC concentrations for all hot-branded SSL ... 40
Figure 1.4 Estimates for the probability of resighting ... 41
Figure 1.5 Selected movement probabilities for age group 0 ... 42
Figure 1.6 Selected movement probabilities for age group 1-9 (1+) ... 43
Figure 2.1 Map of Steller sea lion rookeries where hot-branding occurred ... 99
Figure 2.2 Mean, with 95% confidence intervals, ∑PCB and ∑DDT concentrations (ng g-1 ww) from whole blood for female SSL hot-branded in 2002 that were never resighted and those observed without and with pups ... 100
Figure 2.3 Range of ∑PCB concentrations (ng mg-1 lw) from blood serum at each natal rookery ... 100
Figure 2.4 Range of ∑DDT and ∑PBDE concentrations (ng mg-1 lw) from blood serum, respectively, at each natal rookery ... 101
List of Tables
Page
Table 1.1 Resighting effort in days, by year, natal rookery, and haulout sites ... 34
Table 1.2 Fits of models in which contaminants are grouped above or below the average OC concentration ... 35
Table 1.3 Fits of models in which contaminants are covariates ... 35
Table 1.4 Estimates for the probability of survival... 36
Table 1.5 Estimates for the probability of movement... 37
Table 2.1 Reproductive success at four natal rookeries for female Steller sea lions branded in 2002... 77
Table 2.2 Reproductive success at nine rookeries for female Steller sea lions branded from 2001 - 2007 ... 77
Table 2.3a Generalized linear mixed effects models and AICc for reproductive success for female SSL (n = 25) ... 78
Table 2.3b Parameter estimations from the generalized linear mixed effects models for reproductive success (Table 2.3a) ... 79
Table 2.4a Linear regression models and AICc for age at first reproduction for female SSL (n = 25) ... 80
Table 2.4b Parameter estimations from the linear regression models for age at first reproduction (Table 2.4a) ... 81
Table 2.5a Generalized linear mixed effects models and AICc for the reproductive success for female SSL (n = 103) ... 82
Table 2.5b Parameter estimations from the generalized linear mixed effects models for reproductive success (Table 2.5a) ... 83 Table 2.6a Linear regression models and AICc for age at first reproduction for female
SSL (n = 103) ... 84 Table 2.6b Parameter estimations from the linear regression models for age at first
reproduction (Table 2.6a) ... 85 Table 2.7a Linear regression models and AICc for age at first reproduction, limited to
female SSL with pups (n = 59) ... 89 Table 2.7b Parameter estimations from the linear regression models for age at first
reproduction, limited to female SSL with pups (Table 2.7a) ... 90 Table 2.8a Linear regression models and AICc for age at first reproduction, limited to
female SSL with no pups (n = 44) ... 94 Table 2.8b Parameter estimations from the linear regression models for age at first
List of Appendices
Page Appendix 2.1 Parameter estimations from Table 2.3a mixed effects models of
reproductive success for female SSL (n = 25). ... 102 Appendix 2.2 Parameter estimations from Table 2.4a linear regression models of age
at first reproduction for female SSL (n = 25). ... 103 Appendix 2.3 Parameter estimations from Table 2.5a mixed effects models of
reproductive success of female SSL (n = 103). ... 105 Appendix 2.4 Parameter estimations from Table 2.7a linear regression models of age
at first reproduction for female SSL with pups (n = 59). ... 108 Appendix 2.5 Parameter estimations from Table 2.8a linear regression models of age
Acknowledgements
I would like to thank my advisor Dr. Shannon Atkinson for all her guidance, patience and friendship. I also thank Dr. Vladimir Burkanov for his invaluable assistance and Dr. Terrance Quinn II and Dr. Sherry Tamone for their numerous edits and thoughtful insights throughout this project.
My graduate fellowship was funded through the Sustainable Ecosystem-Based Management of Living Marine Resources Program at the University of Alaska Fairbanks with funding provided by the National Science Foundation. I am grateful for the funding obtained from the Pollock Conservation Cooperative Research Center and the North Pacific Fisheries Foundation. I would like to thank Dr. Qing Li and Dr. Jun Wang at the University of Hawaii at Manoa and the students at the Molecular Biosciences and Bioengineering lab for all of their help and advice. This project would not have been possible without the collaboration with North Pacific Wildlife Consulting and am indebted to them for providing samples, data, and for an outstanding field season in Russia. I am thankful for all the help and encouragement from UAF and UAS faculty and staff, especially Gabrielle Hazelton, Louisa Hayes, and Lawrence Powers.
Finally I would like to thank my wife Molly Zaleski for her love and support through all the late nights doing statistics homework, writing, and for always being willing to provide advice.
General Introduction
Steller sea lions (Eumetopias jubatus) range from California’s Channel Islands to northern Japan, with the western Steller sea lions (SSL) Distinct Population Segment occurring west of 144° longitude. The newly proposed Asian stock ranges west of 165° East longitude encompassing the majority of the Russian Far East SSL rookeries (Baker et al. 2005).The SSL population has declined by approximately 80% since 1976 and about 70% since 1985 (Myers et al. 2008; Sease et al. 2001; Calkins et al. 1999). The SSL was listed as endangered in 1997 under the Endangered Species Act (62 U.S. Federal Register 24345). The failure of the stock to recover to the levels set forth by the U.S. National Marine Fisheries Service Recovery Plan (NMFS 2008) has caused debate as to what may be preventing the recovery of the SSL. The apparent reduction in natality reported by Holmes et al. (2007) for the SSL was critical to the NMFS determination in the draft Biological Opinion (August 2010) that groundfish fisheries in Alaska may be jeopardizing the SSL recovery. Nonetheless, many researchers have commented on the importance of also looking at contaminants as contributing factors (Wang et al. 2011; Atkinson et al. 2008; Myers et al. 2008; NMFS 2008; Barron et al. 2003). The presence of persistent organohalogen contaminants (OCs) in the habitats of SSL may influence their vital rates, such as survival and reproduction (Noonburg et al. 2010; Huntington 2009; Tanabe 2002).
The effects of both anthropogenic and natural factors may have combined to prevent the successful recovery of the SSL. Anthropogenic-related contamination has not been ruled out as a significant cause of the failure of SSL to recover (Atkinson et al.
2008; Barron et al. 2003). Among the most abundant synthetic toxins measured in the tissues of SSL are OCs, such as polychlorinated biphenyls (PCBs), polybrominated diphenyl ethers (PBDEs), and dichlorodiphenyltrichloroethane (DDT), (Wang et al. 2011; Myers et al. 2008; Barron et al. 2003).
Contaminants and Toxicity
Determining the toxicity of such OCs in marine mammals is based on toxic equivalencies and their corresponding toxic equivalency factors as determined by the World Health Organization (Van den Berg et al. 2006, 1998). To establish the
equivalency factor values, a relative effect potency is determined for individual chemicals by comparing their toxic and biological effects to the reference compound
2,3,7,8-tetrachlorodibenzo-p -dioxin, which was done primarily by laboratory research using mice and mink (Van den Berg et al. 2006, 1998). These values do not establish specific toxic thresholds for individual species, but do provide relative effect potencies and toxic equivalency factors for mammals, birds, and fish, which can help to establish thresholds for a given species. Thresholds will vary depending on what structure or function is being studied, such as reproductive failure, morbidity, carcinoma, and bone deformation. A suggested PCB threshold, expressed as lipid weight (lw) concentration, of 11,000 ng g-1, and a wet weight (ww) concentration of 440 ng g-1, measured in the liver or blood has been proposed for marine mammals (Kannan et al. 2000). There is, however, currently no biological threshold concentration identified for DDT contaminants in marine mammals (Kannan et al. 2004).
Organohalogen contaminants typically bioaccumulate in the food chain, are fat soluble (lipophilic), and resist metabolic and environmental breakdown (Myers et al. 2008; Becker 2000; Lee et al. 1996). The most common use of PCB has been for machinery lubricants and as coolants for electrical equipment, DDT was primarily used for agricultural activities, such as insecticides; however, their use has been banned in most developed countries since the 1970s and 1980s (Myers et al. 2008; Lee et al. 1996). These chemicals are insidious in the Arctic because of atmospheric and oceanic transport from Eurasia and tropical regions, which still utilize a suite of these chemicals (Aguilar et al. 2002; Bard 1999; Iwata et al. 1994, 1993). The transport of OCs to northern latitudes is promoted by atmospheric distillation and cold air sinks that permit these compounds to be deposited in the North Pacific habitats occupied by the SSL (Li et al. 2002; Bard 1999; Iwata et al. 1994, 1993).
The average OC concentrations measured in tissue samples were significantly greater in SSL from the Russian Bering Sea than those from western Alaska, specifically PCBs (Wang et al. 2011; Myers et al. 2008; Lee et al. 1996). In SSL from the western North Pacific, ~55% of the sample population (29 out of 52) had PCB congener concentrations greater than 14 ng g-1 lw of PCB 170 and 43 ng g-1 lw of PCB 180
(Hoshino et al., 2006); these concentrations of PCB congeners were suggested to cause a decrease in the circulating thyroid hormone (T3) in ribbon seals (Phoca fasciata) from the same region (Chiba et al. 2001).
Exposure to OCs has adverse effects on reproduction and endocrine functions in mammals (Van den Berg et al. 2006, 1998). Harbor seals (Phoca vitulina) fed a diet of herring from the Baltic Sea, which in that study was considered contaminated as compared to herring from the Atlantic Ocean, had decreased immune system response than those fed a diet of uncontaminated Atlantic Ocean herring (Ross et al. 1995). Wang et al. (2007a) showed that adult male harbor seals had higher mean levels of OCs than did females and that nursing dams may retain the more toxic non-ortho PCBs, thereby
attenuating some of the toxic effects experienced by pups (Wang et al. 2007a,b). California sea lions (Zalophus californianus) may suffer from increased cancer-related mortality due to high concentrations of PCB contaminants (Ylitalo et al. 2005), and northern fur seal pups (Callorhinus ursinus) from primiparous dams had greater concentrations of OCs than pups from multiparous dams. This resulted in decreased immune system response, putting neonates more at risk of morbidity and mortality (Beckmen et al. 2003, 1999). Hawaiian monk seals (Monachus schauinslandi) accumulated OCs primarily in their blubber with adult males having the highest concentrations, and OCs in blood samples for 12 of 144 animals exceeded the
recommended threshold for the sum of all quantified PCB contaminants, ∑PCB of 8.7 μg g-1 lw (Ylitalo et al. 2008; Wilcox et al. 2004; Kannan et al. 2000). Most recently, DDT was measured in Galapagos sea lion (Zalophus wollebaeki) pups at concentrations known to cause anti-androgenic effects in other vertebrates (Alava et al. 2011). The inability to perform laboratory experiments on most marine mammals, as well as the complexity of
contaminant mixtures, adds to the difficulty of ascertaining a discrete cause and effect relationship between contaminants and biological functions.
In Arctic species, chlorinated contaminants accumulate in fatty tissues (Becker 2000; Watanabe et al. 1999), undergo vertical transfer to offspring (Beckmen et al. 2003, 1999), and increase in concentration at higher trophic levels (Tanabe 2002; Beckmen et al. 1999; Watanabe et al. 1999). The total amount of contaminants in an organism is referred to as body burden. Both PCB and DDT levels, measured in archived marine mammal blubber, were at their highest concentrations during the 1970’s, while DDT levels declined to one thirtieth of the greatest measured value by the 1990’s and PCB levels declined to approximately half of their 1970 levels by the 1980’s and 1990’s (Tanabe et al. 2002). The years with the greatest levels of contaminants correspond with the overall reduction in SSL populations and subsequent US Endangered Species Act listing. Letcher et al. (2010) recommended a general threshold level of 1 ppm (1 ppm = 1000 ng g-1) for any organohalogen contaminant or persistent organic pollutant in any tissue for marine mammals as an indication of high risk for negative biological effects.
Bering Sea SSL were identified as a species with considerable accumulations of OCs (Myers et al. 2008; Lee et al. 1996), for the sum of all quantified PCBs (∑PCB) and the sum of all quantified DDT contaminants (∑DDT). In Russia, ∑DDT in pups averaged approximately 8,364 ng g-1 lw, and for ∑PCB, 29% of Russian and 12% of Alaska pups, measured in whole blood from 2002 (Myers et al. 2008), exceeded the 11,000 ng g-1 lw threshold for ∑PCBs proposed for seals by Kannan et al. (2000), as well as the 1,000 ng
g-1 threshold proposed by Letcher et al. (2010). These concentrations are lower than those reported by Lee et al. (1996) for SSL from Alaska and the Russian Bering Sea, sampled from the late 1970’s – 1981, than those reported by Myers et al. (2008). However, different analytical techniques were used to quantify OCs, so a direct comparison would be inappropriate, but does show that SSL in these regions have considerable
accumulations of OCs. The range of ∑PCB was from 5,700 to 41,000 ng g-1 lw for males and from 570 to 16,000 ng g-1 lw for females; ∑DDT values ranged from 2,800 to 17,000 ng g-1 for males and from 190 to 6,500 ng g-1 lw for females measured in the blubber and liver (Lee et al. 2006).
Male SSL likely experience an increasing body burden of contaminants with age, whereas females tend to show increasing levels followed by a sharp decrease after parturition. It is estimated that approximately 80% of PCBs and 79% of DDTs of female body burden are transferred through lactation (Lee et al. 1996). This suggests that pups of primiparous dams will be exposed to high levels of contaminants, as was demonstrated in northern fur seals (Beckmen et al. 2003, 1999).
Research Objectives
The goal of the present study was to examine the potential relationship between PCBs, DDTs, and PBDEs and the survival, movement, and reproduction of SSL. To address these research objectives the following three hypotheses were tested: H1: There is no difference in pup survival and movement probabilities among rookeries or between pups above and below the mean post-natal OC concentrations, H2: Age at first
reproduction is not associated with post-natal contaminant concentrations, and H3: Breeding success is not associated with post-natal contaminant concentrations. The OCs quantified were 15 PCB congeners (77, 101, 126, 105, 118, 169, 128, 189, 153, 138, 157, 170/194, 156, 180), 6 DDT metabolites (o,p’-DDD, p,p’-DDD, o,p’-DDE , p,p’-DDE, o,p’-DDT, p,p’-DDT), HCB (hexachlorobenzene), and 8 PBDE congeners (3, 15, 28, 47, 99, 154, 153, 183). Whole blood and serum samples analyzed for OCs were taken from 239 hot-branded SSL pups at nine Russian Far East rookeries (Iony Island, Yamsky, Tuleny, Brat Chirpoyev, Srednego, Lovushki, Antsiferov, Kozlova Cape, and Medny Island) from 2001 - 2007. The intensive brand-resight effort conducted on Russian rookeries provided the opportunity to contrast pup survival, movement, reproductive success, and age at first reproduction among individuals with varying post-natal concentrations of OCs. A series of mark-recapture multi-strata models in program MARK were used to estimate survival, resighting, and movement probabilities as a function of contaminant concentration, location, and age. Linear models were used to test for correlations between female reproductive success and age at first reproduction to OCs and natal rookery.
Prepared for submission in: Science of the Total Environment Co-authors: Atkinson S, Quinn II TJ, Burkanov VN
Chapter 1:The effect of environmental contaminants on western Steller sea lion survival and movement estimated from multi-state mark-recapture methods
Abstract
The western Distinct Population Segment of Steller sea lions (Eumetopias jubatus) has experienced dramatic declines since the 1960’s; particularly in the western Alaskan and Asian portions, which have continued to decline or stabilized at low levels. Causes for this decline have not been identified, but may include anthropogenic contamination from organohalogen contaminants (OCs). These include polychlorinated biphenyls (PCBs) and dichlorodiphenyltrichloroethane (DDT), which have not been ruled out as a potential cause for the lack of recovery. The objective of this study was to determine the effects of OCs on survival and movement probabilities estimated in program MARK using
resighting data collected from 2003 -2009. PCBs and DDTs were measured from 136 (74 males and 62 females) individually marked, free-range pups from four Russian Far East rookeries. Survival and movement were most affected by age and location rather than OCs. The lowest estimated probabilities of survival occurred in the first year, ranging from 38% - 74%, but increased for individuals between ages 1 and 9, ranging from 82% - 94%. The greatest emigration occurred from Medny Island west toward the Kamchatka Peninsula (33%) and to Bering Island (18%). The estimated probabilities of resighting
varied by location (48% - 87%), but had greater precision than survival or movement parameters. Survival probabilities were lower than expected within the first year, which may indicate rookery specific dynamics and point to locations at risk of continued declines.
Introduction
Steller sea lions (Eumetopias jubatus) range from California’s Channel Islands to northern Japan, with the western Steller sea lions (SSL) Distinct Population Segment occurring west of 144° longitude. The newly proposed Asian stock ranges west of 165° east longitude encompassing the majority of Russian Far East SSL rookeries (Baker et al. 2005). The SSL population declined by approximately 80% since 1976 and about 70% since 1985 (Myers et al. 2008; Sease et al. 2001; Calkins et al. 1999). The SSL was listed as endangered in 1997 under the Endangered Species Act (62 U.S. Federal Register 24345). The apparent reduction in natality reported by Holmes et al. (2007) for the SSL was critical to the NMFS determination in the draft Biological Opinion (August 2010) that groundfish fisheries in Alaska may be jeopardizing SSL recovery. The failure of the stock to recover to the levels set forth by the U.S. National Marine Fisheries Service Recovery Plan (NMFS 2008) has caused debate as to what may be preventing the recovery of SSL, and many researchers have commented on the importance of
researching contaminants as causative factors (Wang et al. 2011; Atkinson et al. 2008; Myers et al. 2008; NMFS 2008; Barron et al. 2003). The presence of persistent
organohalogen contaminants (OCs) in habitats of the SSL could possibly influence their survival (Noonburg et al. 2010; Huntington 2009; Tanabe 2002).
Anthropogenic-related contamination is being investigated as a potentially significant cause of the failure of SSL to recover (Atkinson et al. 2008; Barron et al. 2003). Among the most abundant synthetic toxins measured in the tissues of SSL are OCs, such as polychlorinated biphenyls (PCBs) and dichlorodiphenyltrichloroethane (DDTs) (Wang et al. 2011; Myers et al. 2008; Barron et al. 2003), and their
concentrations can vary in an individual over time (Myers and Atkinson 2012).
Common uses for PCBs include use as machinery lubricants and as coolants for electrical equipment, and DDTs were commonly used as agricultural insecticides; however, their use has been banned in most developed countries since the 1970s and 1980s (Lee et al. 1996). These chemicals are insidious in the Arctic because of atmospheric and oceanic transport from Eurasia and tropical regions which still utilize a suite of these chemicals (Aguilar et al. 2002; Bard 1999; Iwata et al. 1994, 1993). The transport of OCs to northern latitudes is promoted by atmospheric distillation and cold air sinks that permit these compounds to be deposited in the North Pacific habitats occupied by the SSL (Li et al. 2002; Bard 1999; Iwata et al. 1994, 1993).
When fat soluble (lipophilic) OCs enter the environment they typically bioaccumulate in the food chain and resist metabolic and environmental breakdown (Myers and Atkinson 2012; Myers et al. 2008; Becker 2000; Lee et al. 1996). Both PCB and DDT concentrations measured in archived northern fur seal (Callorhinus ursinus) fat
tissues were highest during the 1970’s (Tanabe et al. 1994). However, concentrations of DDTs declined to one thirtieth of their greatest measured value by the 1990’s and
concentrations of PCBs declined to approximately half of their 1970 levels by the 1980’s and 1990’s (Tanabe 2002). The years with the greatest concentrations of contaminants correspond with the years of overall decline in SSL populations and subsequent U.S. Endangered Species Act listing. A threshold level of 1ppm (1ppm = 1000 ng g-1) for any organohalogen contaminant or persistent organic pollutant in any tissue for marine mammals as an indication of high risk for negative biological effects was recommended by Letcher et al. (2010). Similarly, a PCB threshold, expressed as lipid weight (lw) concentration of 11,000 ng g-1, and a wet weight (ww) concentration of 440 ng g-1, measured in the liver or blood was proposed by Kannan et al. (2000). These values were derived from dead and stranded marine mammals, not including SSL. There is, however, currently no biological threshold concentration identified for DDT contaminants in marine mammals (Kannan et al. 2004).
Exposure to OCs was shown to have adverse effects on reproduction and
endocrine functions in mammals (Van den Berg et al. 2006, 1998). For example, in SSL from the western North Pacific, ~55% of the sample population (29 out of 52) had PCB concentrations greater than 14 ng g-1 lw of PCB 170 and 43 ng g-1 lw of PCB 180
(Hoshino et al. 2006); these concentrations of PCB congeners were suggested to cause a decrease in the circulating thyroid hormone (T3) in ribbon seals (Phoca fasciata) from the same region (Chiba et al. 2001). California sea lions (Zalophus californianus) may suffer from increased cancer-related mortality due to high concentrations of PCB
contaminants (Ylitalo et al. 2005). Blubber and liver samples collected from Alaskan SSL from 1976 – 1978 had PCB concentrations that were one to two orders of magnitude higher than in other Arctic pinnipeds, such as, harp seals (Pagophilus groenlandicus), ringed seals (Phoca hispida), and northern fur seals, and similar results, but overall lower concentrations were measured for DDT (Lee et al. 1996).
The objective of the present study was to use OC measurements from 136 individually marked Steller sea lion pups to determine probabilities of resighting, movement, and survival at four Russian Far East rookeries. A series of mark-recapture multi-strata models in program MARK were used to estimate these probabilities.
Resighting probability was estimated for each location using days of effort as a covariate. The null hypotheses tested were: there is no difference in pup survival and movement probability among rookeries or between pups above and below the mean OC
concentrations. To test these hypotheses, whole blood samples were collected in 2002 from free-ranging SSL pups in the Russian Far East and analyzed for DDT and its
metabolites and a suite of PCB congeners. Contaminant concentrations were measured on a whole blood wet weight basis, which Myers and Atkinson (2012) have suggested is appropriate for quantifying OC levels in SSL. From the resighting data, we estimated survival, movement, and resighting probabilities.
Methods Sample Collection
Field efforts were conducted to individually mark SSL pups, collect blood
samples for health assessments, and survey rookeries in the Russian Far East (Figure 1.1). The study area encompassed a segment of the endangered western and newly proposed Asian SSL stocks. In late June to early July 2002, whole blood samples were collected for contaminant analysis from 136 hot-branded free-ranging SSL pups approximately one month old (Myers et al. 2008). Samples were collected from four rookeries: Iony Island (females n=12, males n=14), Kozlova Cape (females n=17, males n=21), Medny Island (females n=21, males n=18), and Yamsky (females n=13, males n=20).
The procedure for individually marking SSL pups followed the methods of
Merrick et al. (1996) for applying unique alphanumeric hot-brands on SSL, which remain legible for at least 7 years (Merrick et al. 1996). Prior to hot-branding, individuals were anesthetized using mobile isoflurane following the protocols of Hastings et al. (2009) and Heath et al. (1996). All samples and corresponding data were collected during the 2002 field season and were maintained by North Pacific Wildlife Consulting in collaboration with the National Marine Mammal Laboratory (Myers et al. 2008).
Blood samples were drawn from a rear flipper or caudal-gluteal vein and stored at -80 oC for later chemical analyses as described in Myers et al. (2008). Quantification of 15 PCBs (77, 101, 105, 118, 126, 128, 138, 153, 156, 157, 169, 170/194, 180, 189) and six chlorinated contaminants (o,p’-DDD, p,p’-DDD, p,p’-DDE, o,p’-DDT, p,p’-DDT,
hexachlorobenzene), were measured using high-performance liquid
chromatography/photodiode array; these concentrations were previously published in Myers et al. (2008). The total concentration of PCBs was calculated by summing all 15 PCB congener concentrations (∑PCB), and similarly for ∑DDT. Total lipid quantities in each whole blood sample were measured by thin layer chromatography with flame
ionization detection (Myers et al. 2008). The present study is an extension of the Myers et al. (2008) research. This project uses the OC measurements from Myers et al. (2008) and incorporates the resighting data from those SSL pups to determine survival, movement, and resighting probabilities.
Resighting histories of 136 hot-branded SSL pups born in 2002 were obtained by photo-documentation during June – December from 2003 – 2011. Resighting effort was conducted at major rookeries and haulout sites across the Russian Far East during boat-based surveys (Table 1.1). Branded SSL were photographed from small boats, land-boat-based vantage points, and field camps at Kozlova Cape, Medny Island, Tuleny, and Antsiferov rookeries. Kozlova Cape and Medny Island used remote video and still camera systems maintained by personnel at nearby field camps. The remote monitoring systems at these locations were described in a previously published study (Burdin et al. 2009). Only those resightings accompanied by a confirmed image of the brand were used as confirmed animal sightings by North Pacific Wildlife Consulting.
Model Estimates
Probability estimates for survival, resighting, and movement were calculated in program MARK, version 6.1, using a multi-state live recaptures model. This project used resighting histories from 136 hot-branded SSL pups from four natal rookeries (Iony Island, Kozlova Cape, Medny Island, and Yamsky) that were identified at up to 13 different locations within the study region from 2003 – 2011. Within a single survey year some individuals were seen at up to four different locations. Therefore, resighting
locations were grouped into four different regions, or strata, that included up to two of the four natal rookeries (Figure 1.2). We used four different strata in our analyses by using the locations at which SSL were resighted based on their natal rookeries. Iony Island and Yamsky were included in stratum A, which also included Tuleny and Antsiferov
rookeries, being the two other locations SSL born on Iony Island or Yamsky were resighted; Kozlova Cape is stratum B, which includes five haulout locations along the west coast of the Kamchatka Peninsula at which SSL born on Kozlova Cape were resighted; Bering Island is stratum C, which includes a total of four haulout locations without a rookery; and Medny Island is stratum D, which includes a rookery and two haulout locations. Resighting effort, measured in days, was summed across all locations within each stratum from 2003 – 2011 and used as a covariate for recapture probability. Capture histories for 10 occasions (2002 – 2011), for all SSL, were created using binary coding (0 = not resighted, 1 = resighted). Multiple observations of an individual within a year were considered as one observation based on time observed at each location, where
the location that the individual was observed the most was considered the resighting location. This was done for computational ease in the model analyses.
“Apparent survival”, (ɸ), was estimated for each stratum, as well as for those animals above and below the group mean OC level within and between each stratum. In program MARK apparent survival is estimated as survival multiplied by the probability of that individual remaining in the study area, such that if animals move outside of the study area, a biased survival estimate results; therefore we calculated “apparent survival” and not true survival (Cooch and White, 2011). Contaminants (∑PCB & ∑DDT) were used as covariates for estimating survival probability in alternate models. The probability of recapture (p) for a marked SSL was determined by that individual surviving, ɸ, from time t t + 1 and being encountered. The probability of movement (Ψ) was dependent on the marked individual surviving, transitioning between strata, and being encountered (Cooch and White, 2011). The formula considering all three of these parameters for a marked SSL from stratum a at time t transitioning to, and being encountered in, stratum b at time t + 1 is ɸb,t+1 = ɸa,t Ψa-b,t pb,t+1. The assumptions in multi-state models are that survival from time t to t +1 does not depend on the strata at time t +1, that individuals make transitions at the same time, and that the distribution of transitions is known (Cooch and White, 2011). For the purposes of this study we accepted the first assumption of non-dependent survival at time t +1 and that animals were making transitions at similar times within the summer breeding season. By using locations from resighting histories, we know the distribution of their transitions, which were included in the strata framework of the models.
A stepwise modeling approach was used to determine interactions between contaminants survival and movement. We allowed survival (ɸ) to be constant across strata or to vary by age, strata, and mean OC concentration. We also varied the movement parameter (Ψ) by two age groups (0, 1+), age 0 is the initial capture and hot-branding year in 2002 and age 1+, wherein resighting ranged from 2003 – 2011. The age variable was separated into the same two groups for estimating survival and movement
probabilities. Contaminants were included in the models as groups, determined by pups having OC concentrations greater or less than the overall mean OC concentrations. This approach gave us eight reasonable models to compare and to test the hypothesis that there was no difference in pup survival among rookeries or between pups above and below the mean OC concentrations. Grouping SSL above and below the mean OC concentrations was determined by separately calculating the mean for ∑PCB and ∑DDT and using that mean to define SSL as being above or below that value. There was one SSL that was below the group mean for ∑PCB but above for ∑DDT and five SSL that were below the group mean for ∑DDT but above for ∑PCB. Because these SSL were above the mean concentration for at least one of the contaminants they were classified as being above the group mean OC concentrations.
An alternative set of models was used to test for differences between either ∑PCB or ∑DDT on survival because of a strong correlation between ∑PCB and ∑DDT (r = 0.88). Each model tested included recapture probability with resighting effort in days as a covariate for each stratum. However, stratum C in our design was not a natal rookery where pups were branded, so ɸ was not estimated for this region. Alternatively, stratum C
survival estimates were set constant (ɸ = 0.66 for age 0 and 0.86 for age group 1+), which was a reasonable average probability for SSL in that region at age 0 and 1- 9, respectively (Burkanov, unpublished results). However, both movement and resighting probability can be estimated for stratum C based on resighting history over the last nine years.
Model comparison and selection were determined using AICc (Akaike
Information Criterion, second order) and the difference (Δ) between AICc for a given model and the model with the lowest AICc. Model support is based on the Kullback-Leibler distance between models represented as ΔAICc, where the larger the Δ the less support there is that the model adequately explains variation in the data (Burnham and Anderson, 2002). A Δ range from 0 – 2 provides strong support for the model being the best model, Δ 2 – 4 indicates weak support for the model not being best model, Δ 4 – 7 indicates moderate support for the model not being the best model. If the model
considered has a Δ 7 – 10 then it provides strong evidence that the model is not the best model and a Δ > 10 very strongly indicates that the model is not the best model and fails to adequately explain a considerable amount of variability (Burnham and Anderson, 2002).
For the primary analysis, the survival parameters were separated into two age groups; however, a suite of models were also tested using multiple age-varying scenarios. The models that tested alternate age scenarios resulted in ΔAICc > 1000 and a deviance two to six times greater than models where age was grouped into age 0 and age 1+.
Models were of the form, ɸ (a,s,c), p (s,eff), and Ψ (a,c), for which a is age, s is stratum, and c is mean OC concentration. There were 14 biologically meaningful models tested; 10 that used OC concentrations to group SSL above or below the group mean for ∑PCB and ∑DDT (Table 1.2), and four that analyzed OCs as individual covariates on survival (Table 1.3).
Results
The average whole blood concentration for ∑PCB was 4.25 ± 5.12 ng g-1 ww (n = 136). For SSL grouped above the aggregate mean the average concentration was 9.25 ± 6.55 ng g-1 ww (n = 44), and below the aggregate mean it was 1.86 ± 0.89 ng g-1 ww (n = 92) (Figure 1.3). The average whole blood concentration for ∑DDT was 3.22 ± 4.28 ng g-1 ww. For SSL grouped above the aggregate mean the average concentration was 7.65 ± 5.21 ng g-1 ww, and below the aggregate mean it was 1.11 ± 0.65 ng g-1 ww (Figure 1.3). For the one SSL that was above for ∑DDT and not ∑PCB, the concentrations were 3.6 ng g-1 ww and 3.1 ng g-1 ww, respectively. For the five SSL that were above for ∑PCB and not ∑DDT, the average concentrations were 4.62 ± 0.19 ng g-1
ww and 2.80 ± 0.29 ng g-1 ww, respectively.
Model comparison statistics, such as AICc, are shown in Table 1.2 for the models considered to estimate survival, resighting, and movement probabilities. These include models where SSL were grouped by being either above or below the overall average OC concentration and age was grouped by age 0 and age 1+ SSL. Model 4 results are
presented to illustrate that OCs have an equivocal affect on both the survival and movement parameters.
The probability of survival was also estimated where ∑PCB and ∑DDT were used as covariates (Table 1.3). Models 15 and 16 show two alternate age-varying models, such that age in model 15 was separated into two groups, from birth to two years of age and from two to nine years of age and age in model 16 the two groups were from birth to three years of age and from three to nine years of age. The ΔAICc (> 10) for these models indicates that less model variability is explained when compared to models 11- 14. The ΔAICc (< 2) between model 11, which includes all OCs as covariates, and model 13, which has no OC covariates, indicates that including OCs does not explain any more variability in the data.
Estimations for the probability of survival from model 4 did not clearly indicate that OC concentrations above (cg) or below (cl) the average concentration affect SSL
differently (Table 1.4). Overall, survival was most different between strata and age groups. The greatest difference within a stratum and age group was for age 0 SSL in stratum B (Kozlova Cape) with estimated survivals ɸ (0, B, cg)= 0.74, with a 95%
confidence interval (0.56, 0.86) and standard error of 0.08, andɸ (0, B, cl)= 0.56, with a
95% confidence interval (0.49, 0.63) and standard error of 0.04. Kozlova Cape is also the site of the highest overall OC concentrations of the four strata (Myers et al. 2008).
Stratum A had the lowest survival estimates for age 0, ɸ (0, A, cg) = 0.38 and ɸ (0, A, cl)
0.87, were nearly equal to those for age 1+ for stratum D, ɸ (1+, D, cg) = 0.90 and ɸ (1+,
A, cl) = 0.83. The lowest survival probabilities in each stratum occurred at age 0, ranging
from 0.38 ± 0.07 in stratum A to 0.74 ± 0.08 in stratum B.
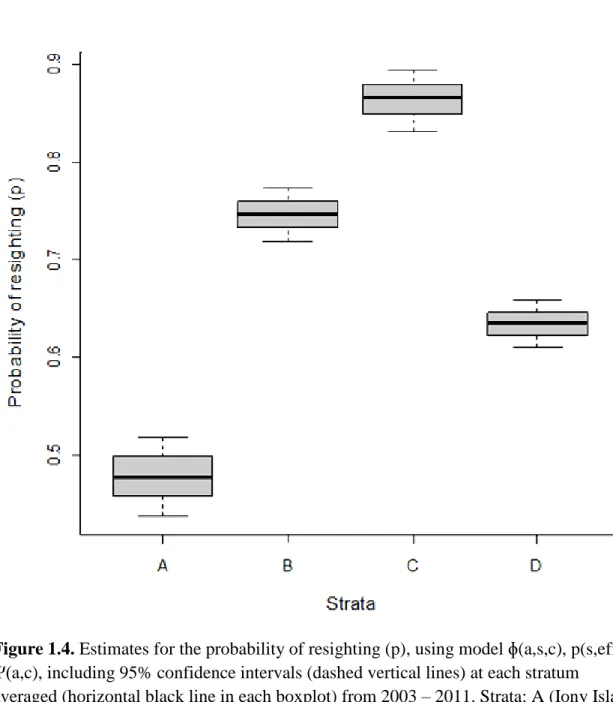
The probabilities of resighting were estimated with greater precision than survival probabilities indicated by reduced standard errors, 1% - 2%, and narrower confidence intervals (Figure 1.4). The greatest probability of resighting was for stratum C (p = 0.87) followed by stratum B (p = 0.75), D (p = 0.63), and A (p = 0.48). The wide confidence interval for stratum A (0.44, 0.52) is likely due to multiple years of no resighting effort on Yamsky and Iony Island rookeries.
The greatest probabilities of movement occurred between strata B, C, and D in the eastern portion of the study region (Figures 1.5, 1.6). Movement from stratum A to other strata was minimal for any age group, with a maximum Ψ = 0.02 for Ψ (1+, A C, cl), data not shown. The probabilities of movement for age 0 SSL (Figure 1.5) were from their natal rookery to all locations in Figure 1.2. Steller sea lions from stratum D had a greater probability of moving to stratum B (Ψ = cg 0.33, cl 0.13) than to any other
location and SSL from stratum B were seen less in other strata (Ψ = cg 0.04, cl 0.11)
(Figure 1.5).
For age 1+ SSL there was less movement between strata B and D, but greater movement to and from stratum C (Figure 1.6) when compared to age 0 SSL. The probabilities of movement for age 1+ SSL were from their natal rookery to all locations shown in Figure 1.2. The most frequent movements occurred from stratum C to D (Ψ = cg
0.40, cl 0.31) and to stratum B (Ψ = cg 0.19, cl 0.40) (Figure 1.5). Movement between
strata B and D for age 1+ SSL (Ψ range = 0.01 - 0.07) was less compared to the age 0 SSL, but had increased probabilities of movement from stratum C to A (Ψ range = 0.04 - 0.40) (Figure 1.5). Contaminant concentrations failed to explain any differences in movement probabilities between groups above or below average OC concentrations (Table 1.5).
Discussion
The results for model ɸ (a,s,c), p (s,eff), Ψ (a,c) were presented to show the absence of a detected effect of contaminants on survival (ɸ) and movement (Ψ) in terms of those individuals above and below mean contaminant concentrations. The ΔAICc between model 4 and model 1, which had the best fit was 10.74 (Table 1.2), which strongly suggests that model 4 is not likely to be the best model (Burnham and Anderson, 2002). Parameter estimates compared between these models, but excluding contaminants, resulted in survival and resighting probability estimates within 5% of each other, except for survival at stratum B (0, B, cg), which was ~15% lower in the better fit model 1. This
estimate had a high standard error and wide confidence interval, suggesting no
contaminant effect. The estimates of movement probability changed more dramatically when the OC group was excluded, as in model 1 (Table 1.2), resulting in a reduced AICc with six fewer parameters estimated for survival (ɸ) and 14 fewer parameters estimated for movement (Ψ). For all models the overdispersion parameter, > 1, indicated
being greater than expected from a binomial model with independence among individuals (Burnham and Anderson, 2002). This result can be expected for a biological model with a sample size of n = 136, with each individual having a highly variable encounter history.
All model estimates indicated that SSL survival is influenced more by age and location than by contaminant load. The greatest risk of mortality for all rookeries
occurred within the first year but decreased by age nine. The lowest survival probabilities were seen in stratum A (Iony Island, Yamsky, Tuleny, Antsiferov) for both age groups with the exception of age 1+ SSL when compared to the lower estimate in stratum D (Medny Island) of age 1+ SSL below mean OC level. However, the estimates for stratum A were likely underestimated due to poor resighting effort on Iony Island and Yamsky rookeries. Both Kozlova Cape and Medny Island rookeries had the greatest estimated survival for age 0 SSL and their populations appeared to have stabilized at depressed levels with some signs of increase (Burkanov et al. 2011, 2005).
Results did not consistently show that those pups with more contaminants had a lower probability of survival. The stratum B age 0 group with lower contaminant concentrations had a much lower survival probability at age 0 when compared to the more contaminated group (Table 1.4); however, the less contaminated group had half the standard error and a confidence interval nearly half the range of that of the more
contaminated group. This suggests that apparent differences between the ɸ (0, B, cg) and ɸ (0, B, cl) estimates could be an artifact due to variability in parameter estimation. There was a similar relationship for the stratum D age 1+ group. The more contaminated SSL
had a probability of survival ~7% higher than those with less contamination (Table 1.4). This result suggests that SSL with more contaminants had a greater probability of survival at age 1+, which also occurred in stratum B for age 0 SSL. Since it is unlikely that OCs had a positive effect on survival, there is likely a missing explanatory variable needed to understand the difference between the two contaminant groups at strata B and D. Additional data that could broaden our understanding of this contradiction could come from longitudinal blood sampling from the same individual or from adults to better establish baseline OC concentrations and fluctuations over time.
The SSL pups in our study each had OC concentrations lower than the suggested contamination threshold, likely resulting in no effect of OCs on the probability of survival or movement. The greatest concentration measured in our study was 36 ng g-1 ww measured at Kozlova Cape in a male pup resighted the year after branding in 2003 and from 2007 – 2011. This OC value is much lower than the reported threshold value of 440 ng g-1 ww (Kannan et al. 2002), which is expected to have negative biological effects, such as decreased immune system function (Beckmen et al. 2003; Ross et al. 1995). However, this is a single measurement taken during a vulnerable stage in pup development, and in a pup that was still suckling and continued to be exposed to its mother’s contaminants until weaned. Pups that are receiving nutrients only from suckling may receive up to 79% of PCBs and 80% DDTs of the female’s total body burden of contaminants (Lee et al. 1996) and some SSL pups may continue to suckle periodically for up to 4 years (Mamaev and Burkanov, 2004).
Estimates for the probability of resighting were calculated with greater precision than those for survival and movement, evidenced by narrower confidence intervals and smaller standard errors (Figure 1.3). Steller sea lions from stratum D (Medny Island) frequently used stratum C as a haulout location as well as SSL from stratum B (Kozlova Cape) but less often. This resulted in stratum C having the highest resight probability (p = 0.87) despite not being a natal rookery. Both strata B and D used remote monitoring systems, which increased the probability of sighting a SSL. The populations at strata B and D appearred to be stabilized at a low level (Burkanov et al. 2005), where pup production can be highly variable between years, but dams do show strong site fidelity (Burkanov, personal communication). This suggests that if an individual was alive, it was likely to be resighted during its lifetime.
Resighting probability for stratum A (Yamsky, Iony Island, Tuleny, and
Antsiferov) had wider confidence intervals than other strata due to poor resighting effort on Yamsky and Iony Island (Figure 1.3). Yamsky and Iony Island are at the extreme northern end of observed rookeries in the Sea of Okhotsk, such that lack of funding and personnel has limited access to those areas. This has resulted in large variability in
encounter histories for SSL born on Yamsky and Iony Island rookeries due to low sample sizes. Because of the inclusion of Tuleny and Antsiferov in stratum A the estimates for probability of resighting were likely biased higher for pups branded on Yamsky and Iony Island then were they to be estimated separately from Tuleny and Antsiferov.
To estimate the probability of movement and to avoid inestimable results between strata where there was little to no movement, a range of parameter values were set to zero. The movement parameters set to zero and not estimated were from stratum A to B, and for age 0 from stratum A to C and D, from stratum B to C and D, from stratum C to A, B, and D, and from stratum D to A. These specific Ψ parameters had to be set to zero because of standard errors that included 0 or 1, unreasonably small probability estimates (10-24), and a ΔAIC > 10 when compared to the same model in which the Ψ parameters were set constant to zero. Age 0 animals did not have limited movement in all cases; there was an estimated 33% probability of age 0 SSL born on stratum D (Medny Island) moving to stratum B (Kozlova Cape) within their first year. The greatest estimated probabilities of movement occurred along the east coast of Kamchatka from stratum C (Bering Island) to B and D for age 1+ SSL (Figure 1.4). The lowest estimated
probabilities were for stratum A (Iony Island and Yamsky), which was at the northern most extent of SSL rookeries in Russia (Burkanov et al. 2011). Stratum B was the most traveled to location by SSL from all other strata presumably because it included a rookery and five haulout locations along the Kamchatka Peninsula. In contrast, stratum D was the location, which includes a rookery, which had the most emigration. This location is part of the Commander Islands and considered part of the endangered and declining western stock.
Model results indicate that including OCs as a variable for estimating Ψ (movement probabilities) did not reduce AICc and thus has little to no effect on an individual’s ability to transition to other locations. If OCs were at or above threshold
concentrations, then a reduced level of fitness may have been detected, possibly affecting an individual’s ability to migrate.
The model estimates presented here must be interpreted with caution for several reasons. First, resighting effort varied by location, year, and method. However, we have attempted to account for some of this variability by using resighting effort as a covariate in our models. Additionally, some biasing certainly occurred between regions using different techniques for obtaining resighting data. Second, sample size was small (n = 136), so that many parameter estimates were imprecise. Third, contaminant concentrations represented only a single whole blood measurement that is being used to investigate relationships with survival, resighting, and movement probabilities over nine years. Therefore, our results only represented an initial step to uncovering the relationship of organohalogen contaminants on SSL survival, resight, and movement probabilities. Additional research should focus on obtaining multiple blood samples from individuals throughout their lifetime to measure changes in contaminant concentrations in conjunction with long term brand monitoring.
Acknowledgements
This project is an extension of the research of the late Dr. Matthew Myers. Support for this project was provided by a graduate fellowship from the National Science Foundation through the Sustainable Ecosystem-Based Management of Living Marine Resources program at the University of Alaska Fairbanks School of Fisheries and Ocean Sciences. The Pollock Conservation Cooperative Research Center provided additional fellowship funds to complete this research. Samples and resighting data were provided by the National Marine Mammal Laboratory and North Pacific Wildlife Consulting. Assistance with MARK analyses were provided by Suzie Teerlink. Assistance with the study area map was provided by Dr. Jason Waite. We thank Gina Ylitalo and Peggy Krahn who provided contaminant analysis and data assistance. We are grateful to Dr. Sherry Tamone for her input and edits throughout this project. All samples were collected under NMFS permits #782-1523 and #881-1668.
Literature Cited
Aguilar A, Borrell A, Reijnders PJ. Geographical and temporal variation in levels of organochlorine contaminants in marine mammals. Mar Environ Res 2002;53(5), 425–52.
Alava JJ, Ross PS, Ikonomou MG, Cruz M, Jimenez-Uzcátegui G, Dubetz C, et al. DDT in endangered Galapagos sea lions (Zalophus wollebaeki). Mar Pollut Bull
2011;62(4), 660–71.
Atkinson S, Demaster DP, Calkins DG. Anthropogenic causes of the western Steller sea lion Eumetopias jubatus population decline and their threat to recovery. Mamm Rev 2008;38, 1–18.
Baker AR, Loughlin TR, Burkanov VN, Matson CW, Trujillo RG, Calkins DG, et al. Variation of mitochondrial control region sequences of Steller sea lions: The three-stock hypothesis. J Mamm 2005;86(May), 1075–1084.
Bard SM. Global Transport of Anthropogenic Contaminants and the Consequences for the Arctic Marine Ecosystem. Mar Pollut Bull 1999;38(5), 356–379.
Barron MG, Heintz R, Krahn MM. Contaminant exposure and effects in pinnipeds: implications for Steller sea lion declines in Alaska. Sci Total Environ 2003;311(1-3), 111–33.
Becker PR. Concentration of chlorinated hydrocarbons and heavy metals in Alaska arctic marine mammals. Mar Pollut Bull 2000;40(10), 819–829.
Beckmen KB, Blake JE, Ylitalo GM, Stott JL, O’Hara TM. Organochlorine contaminant exposure and associations with hematological and humoral immune functional assays with dam age as a factor in free-ranging northern fur seal pups (Callorhinus ursinus). Mar Pollut Bull 2003;46(5), 594–606.
Beckmen KB, Ylitalo GM, Towell RG, Krahn MM, O’Hara TM, Blake JE. Factors affecting organochlorine contaminant concentrations in milk and blood of northern fur seal (Callorhinus ursinus) dams and pups from St. George Island, Alaska. Sci Total Environ; 1999;231(2-3), 183–200.
Burdin AM, Hennen DR, Calkins DG, VN, Nikulin VS, Lisitsina TY. Can we see a cohort effect on survival of Steller sea lions (Eumetopias jubatus) at Kozlova Cape rookery (eastern Kamchatka, Russia)? Mar Mamm Sci 2009;25(4), 888–901.
Burkanov V, Gurarie E, Altukhov A, Mamaev E, Permyakov P, Trukhin A, et al. Environmental and biological factors influencing maternal attendance patterns of Steller sea lions (Eumetopias jubatus) in Russia. J Mamm 2011;92(2), 352–366. Burkanov VN, Loughlin TR. Distribution and Abundance of Steller Sea Lions ,
Eumetopias jubatus, on the Asian Coast , 1720’s – 2005. Mar Fish Rev 2005;67(2), 11- 51.
Burnham K, Anderson D. Model selection and multimodel inference: a practical information-theoretic approach (2nd ed.). New York, NY: Springer; 2002. p. 23 - 26, 50 - 80.
Calkins DG, McAllister DC, Pitcher KW. Steller sea lion status and trend in southeast Alaska : 1979-1997. Mar Mamm Sci 1999, April 15; 462–477.
Chiba I, Sakakibara A, Goto Y, Isono T, Yamamoto Y, Iwata H, et al. Negative
correlation between plasma thyroid hormone levels and chlorinated hydrocarbon levels accumulated in seals from the coast of Hokkaido, Japan. Environ Toxicol 2001;20: 1092-1097.
Cooch E, White G. Program MARK: a gentle introduction. (10th edition); 2011. p. 1 - 93, 185 - 232.
Hastings KK, Gelatt TS, King JC. Postbranding Survival of Steller Sea Lion Pups at Lowrie Island in Southeast Alaska. J Wildl Manage 2009;73(7), 1040–1051. Heath RB, Calkins D, Mcallister D, Taylor W, Spraker T. Telazol and isoflurane field
anesthesia in free-ranging Steller’s sea lions. J Zoo Wildl Med 1996;35–43.
Holmes EE, Fritz LW, York AE, Sweeney K. Fecundity declines in Steller sea lion birth rate in the Gulf of Alaska suggests new conservation and research priorities. Ecol Appl 2007;17(8): 2214-2232.
Hoshino H, Fujita S, Isono T, Ishinazaka T, Burkanov V, Sakurai Y. Organochlorines in Steller sea lions (Eumetopias jubatus) from the western North Pacific. In Sea Lions of the World. Alaska Sea Grant College Program (Ed. by A.W. Trites, S.K. Atkinson, D.P. DeMaster, L.W. Fritz, T.S. Gelatt, L.D. Rea, K.M. Wynne). Alaska Sea Grant College Program, Fairbanks, Alaska, USA; 2006. p. 1 - 11. Huntington HP. A preliminary assessment of threats to arctic marine mammals and their
Iwata H, Tanabe S, Sakai N, Nishimura A, Tatsukawa R. Geographical distribution of persistent organochlorines in air, water and sediments from Asia and Oceania, and their implications for global redistribution from lower latitudes. Environ Pollut 1994;85(1), 15–33.
Iwata H, Tanabe S, Sakai N, Tatsukawa R. Distribution of persistent organochlorines in the oceanic air and surface seawater and the role of ocean on their global transport and fate. Environ Sci Technol 1993;27(6), 1080–1098.
Kannan K, Kajiwara N, Le Boeuf BJ, Tanabe S. Organochlorine pesticides and
polychlorinated biphenyls in California sea lions. Environ Pollut 2004;131(3), 425– 34.
Kannan K, Blankenship AL, Jones PD, Giesy JP. Toxicity reference values for the toxic effects of polychlorinated biphenyls to aquatic mammals. Hum Ecol Risk Assess 2000;6(1), 181-201.
Lee JS, Tanabe S, Umino H, Tatsukawa R, Loughlin TR, Calkins DG. Persistent
organochlorines in Steller sea lion (Eumetopias jubatus) from the bulk of Alaska and the Bering Sea, 1976–1981. Mar Pollut Bull 1996;32(7), 535–544.
Letcher RJ, Bustnes JO, Dietz R, Jenssen BM, Jørgensen EH, Sonne C, et al. Exposure and effects assessment of persistent organohalogen contaminants in arctic wildlife and fish. Sci Total Environ 2010;408(15), 2995–3043.
Li YF, Macdonald RW, Jantunen LMM, Harner T, Bidleman TF, Strachan WMJ. The transport of β-hexachlorocyclohexane to the western Arctic Ocean: a contrast to α-HCH. Sci Total Environ 2002;291(1-3), 229–246.
Mamaev EG, Burkanov VN. How Long Do Steller Sea Lions Drink Milk? Sea Lions of the World: Conservation and Research in the 21st Century; Anchorage, Alaska, USA; 2004. p. 7.
Merrick RL, Loughlin TR, Calkins DG. Hot Branding : A Technique for Long-term Marking of Pinnipeds. U.S. Dep. Commer., NOAA Tech. Memo., (December). NMFS-AFSC-68; 1996. 21p.
Myers MJ, Atkinson S. Temporal variability in organochlorine contamination in blood and blubber of captive Steller sea lions (Eumetopias jubatus). Mar Mamm Sci 2012; 28(1), 105–123.
Myers MJ, Ylitalo GM, Krahn MM, Boyd D, Calkins D, Burkanov V, et al.
Organochlorine contaminants in endangered Steller sea lion pups (Eumetopias jubatus) from western Alaska and the Russian Far East. Sci Total Environ 2008;396(1), 60–9.
NMFS (National Marine Fisheries Service). Endangered Species Act – Section 7 Consultation Biological Opinion. National Marine Fisheries Service, Alaska Region. 2010. p. 1 - 385.
NMFS (National Marine Fisheries Service). Recovery Plan for the Steller Sea Lion (Eumetopias jubatus). Revision of original version 1992. NMFS. National Marine Fisheries Service, Silver Spring, MD, USA. 2008. p. 113 - 116.
Noonburg EG, Nisbet RM, Klanjscek T. Effects of life history variation on vertical transfer of toxicants in marine mammals. J Theor Biol 2010;264(2), 479–89. Phillips CD, Gelatt TS, Patton JC, Bickham JW. Phylogeography of Steller sea lions:
relationships among climate change, effective population size, and genetic diversity. J Mamm 2011;92(5), 1091–1104.
Ross PS, De Swart RL, Reiinders PJH, Van H, Vos JG, Osterhaus ADME. Contaminant-related suppression of delayed-type hypersensitivity and antibody responses in harbor seals fed herring from the Baltic Sea. Environ Health Perspect 1995;103(2), 162 - 167.
Sease JL, Taylor WP, Loughlin TR, Pitcher KW. Aerial and land-based surveys of Steller sea lions (Eumetopias jubatus) in Alaska, June and July 1999 and 2000. U.S. Dep. Commer., NOAA Tech. Memo. NMFS-AFSC-122; 2001. 52p.
Tanabe S. Contamination and toxic effects of persistent endocrine disrupters in marine mammals and birds. Mar Pollut Bull 2002;45(1-12), 69–77.
Tanabe S, Sung JK, Choi DY, Baba N, Kiyota M, Yoshida K, et al. Persistent
organochlorine residues in northern fur seal from the Pacific coast of Japan since 1971. Environ Pollut 1994;85(3), 305–314.
US Federal Register 62 1997. Threatened Fish and Wildlife; Change in listing status of Steller sea lions under the Endangered Species Act. 62 National Marine Fisheries Service. US Federal Register. 24345.
Van den Berg M, Birnbaum LS, Denison M, De Vito M, Farland W, Feeley M, et al. The 2005 World Health Organization reevaluation of human and Mammalian toxic equivalency factors for dioxins and dioxin-like compounds. Toxicol Sci 2006;93(2), 223–41.
Van den Berg M, Birnbaum L, Bosveld ATC, Brunström B, Cook P, Feeley M, et al. Toxic equivalency factors (TEFs) for PCBs, PCDDs, PCDFs for humans and wildlife. Environ Health Perspect 1998;106(12), 775–92.
Wang D, Atkinson S, Hoover-Miller A, Lee SE, Li QX. Organochlorines in harbor seal (Phoca vitulina) tissues from the northern Gulf of Alaska. Environ Pollut
2007a;146(1), 268–80.
Wang D, Atkinson S, Hoover-Miller A, Li QX. Polychlorinated naphthalenes and coplanar polychlorinated biphenyls in tissues of harbor seals (Phoca vitulina) from the northern Gulf of Alaska. Chemosphere 2007b;67(10), 2044–57.
Wang J, Hülck K, Hong SM, Atkinson S, Li QX. Accumulation and maternal transfer of polychlorinated biphenyls in Steller Sea Lions (Eumetopias jubatus) from Prince William Sound and the Bering Sea, Alaska. Environ Pollut 2011;159(1), 71–7. Watanabe M, Tanabe S, Miyazaki N, Petrov EA, Jarman WM. Contamination of
tris(4-Chlorophenyl) methane and tris(4-tris(4-Chlorophenyl) methanol in marine mammals from Russia and Japan: Body distribution, bioaccumulation and contamination status. Mar Pollut Bull 1999;39(1-12): 393-398.
Wilcox MK, Woodward LA, Ylitalo GM, Buzitis J, Atkinson S, Li QX. Organochlorines in free-ranging Hawaiian monk seal (Monachus schauinslandi) from French Frigate Shoals, North Pacific Ocean. Sci Total Environ 2004;322: 81-93. Ylitalo GM, Myers M, Stewart BS, Yochem PK, Braun R, Kashinsky L, et al.
Organochlorine contaminant in endangered Hawaiin monk seals from four
subpopulations in the Northwester Hawaiin Islands. Mar Pollut Bull 2008;56, 231– 244.
Ylitalo GM, Stein JE, Hom T, Johnson LL, Tilbury KL, Hall AJ, et al. The role of organochlorines in cancer-associated mortality in California sea lions (Zalophus californianus). Mar Pollut Bull 2005;50(1), 30–39.
Tables
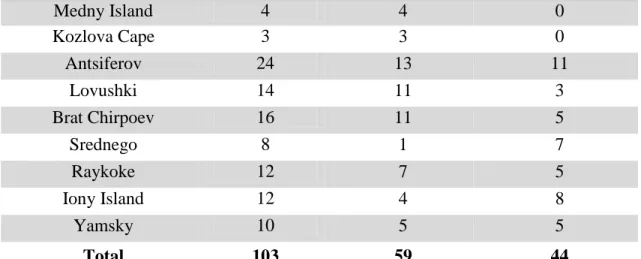
Table 1.1 Resight effort, in days, by year, natal rookery, and haulout sites. The total column reflects the sum of effort over nine years beginning the year after initial branding in 2002. 2003 2004 2005 2006 2007 2008 2009 2010 2011 Total Natal Rookeries Iony Is. 0 0 0 2 0 0 10 0 2 14 Kozlova Cape 56 53 101 78 63 3 26 77 79 536 Medny Is. 85 72 90 80 87 76 79 128 79 776 Yamsky 0 0 33 48 53 1 0 0 2 137 Haulout Sites
Medny Is. Group 1 5 0 0 0 1 4 1 1 13
Tuleny 44 38 41 41 37 0 52 45 73 371 Avacha Bay 0 0 0 5 0 4 40 21 0 70 Kamesity Cape 0 0 0 0 0 1 0 0 0 1 Kekurny Cape 3 0 8 8 0 1 1 0 0 21 Shipunsky Cape 0 0 0 0 0 1 0 0 0 1 Zheleznaya Cape 0 0 2 0 0 1 0 0 0 3 Antsiferov 54 57 50 61 47 45 40 56 48 458 Bering Is. Group 10 74 44 45 40 18 72 53 43 399
Table 1.2. Fits of models in which contaminants are grouped above or below the average OC concentration. Models are identified based on the probability of survival (ɸ), capture (p), and movement (Ψ). For ɸ parameters: a = age (0, 1+), s = strata (A, B, C, D), and c = combined contaminants (PCB, DDT). Estimates of survival for stratum C are fixed, ɸ [C0 = 0.66, C1+ = 0.86]. For p parameters: eff = resighting effort at each strata. K is the number of parameters; AICc, Akaike Information Criterion measuring model fit; ΔAICc, difference between AICc and the lowest model AICc; Deviance, measure of model fit; -ln L, log likelihood.
Model K AICc ΔAICc Deviance -ln L
1. ɸ(a,s), p(s,eff), Ψ(a) 22 5320.52 0.0 2712.84 5275.98 2. ɸ(a,s,c), p(s,eff), Ψ(a) 28 5324.32 3.80 2704.31 5267.45 3. ɸ(a,s), p(s,eff), Ψ(a,c) 36 5327.32 6.80 2690.74 5253.88 4. ɸ(a,s,c), p(s,eff), Ψ(a,c) 42 5331.26 10.74 2682.17 5245.30 5. ɸ(a,c), p(s,eff), Ψ(a) 20 5368.37 47.85 2764.78 5327.92 6. ɸ(a), p(s,eff), Ψ(a) 19 5372.64 52.12 2771.10 5334.23 7. ɸ(a), p(s,eff), Ψ(a,c) 32 5373.13 52.60 2774.85 5307.99 8. ɸ(a,c), p(s,eff), Ψ(a,c) 34 5375.28 54.76 2742.86 5306.00 9. ɸ(.), p(s,eff), Ψ(a) 17 5580.18 259.65 2982.71 5545.85 10. ɸ(.), p(s,eff), Ψ(a,c) 31 5585.98 265.46 2959.77 5522.91
Table 1.3. Fits of models in which contaminants are covariates. Models are identified based on the probability of survival (ɸ), capture (p), and movement (Ψ). For ɸ
parameters: a = age (0, 1+) and PCB and DDT contaminants both individually and jointly. For p parameters: eff = resighting effort at each strata and s = strata (A, B, C, D). K is the number of parameters; AICc, Akaike Information Criterion measuring model fit; ΔAICc, difference between AICc and the lowest model AICc; Deviance, measure of model fit; -ln L, log likelihood.
Model K AICc ΔAICc Deviance -ln L
11. ɸ(a,PCB,DDT), p(s,eff),Ψ(a) 22 1214.25 0.0 1167.74 1167.74 12. ɸ(a,DDT), p(s,eff), Ψ(a) 20 1215.17 .92 1173.10 1173.10 13. ɸ(a), p(s,eff), Ψ(a) 18 1215.44 1.19 1177.76 1177.76 14. ɸ(a,PCB), p(s,eff), Ψ(a) 20 1217.34 3.08 1175.26 1175.26 15. ɸ(a), p(s,eff), Ψ(a) 17 2572.42 1358.16 2536.92 2536.92 16. ɸ(a), p(s,eff), Ψ(a) 14 6604.96 5390.71 6575.94 6575.94
Table 1.4. Estimates for the probability of survival including 95% confidence intervals (in parentheses) and standard error using Model 4: ɸ(a,s ,c), p(s,eff), Ψ(a,c). Stratum C ɸ estimates are fixed at [C0 = 0.66, C1+ = 0.86] so are omitted below. Notation is such that A0, cg = stratum A, age 0, above mean OC concentration and A1+, cl = stratum A, age 1+,
below mean OC concentration.
Strata Probability of survival (ɸ) Standard Error ɸA0, cg 0.38 (0.25, 0.52) 0.07 ɸA1+, cg 0.89 (0.81, 0.94) 0.03 ɸA0, cl 0.41 (0.34, 0.48) 0.03 ɸA1+, cl 0.87 (0.84, 0.90) 0.02 ɸB0, cg 0.74 (0.56, 0.86) 0.08 ɸB1+, cg 0.91 (0.85, 0.94) 0.02 ɸB0, cl 0.56 (0.49, 0.63) 0.04 ɸB1+, cl 0.94 (0.92, 0.96) 0.01 ɸD0, cg 0.72 (0.55, 0.85) 0.08 ɸD1+, cg 0.90 (0.81, 0.95) 0.04 ɸD0, cl 0.73 (0.62, 0.82) 0.05 ɸD1+, cl 0.83 (0.76, 0.88) 0.03
Table 1.5. Estimates for the probability of movement including 95% confidence intervals (in parentheses) and standard error, SE, using model ɸ(a,s ,c), p(s,eff), Ψ(a,c).
Probabilities are shown for Age 0 and Age 1+ above the mean (cg) and below the mean
(cl ) OC concentration.
Strata Strata Age 0, cg SE Age 0, cl SE
B A 0.04 (0.01, 0.24) 0.04 0.11 (0.06, 0.20) 0.03 D B 0.33 (0.18, 0.53) 0.09 0.13 (0.07, 0.24) 0.04 D C 0.05 (0.01, 0.27) 0.05 0.02 (0.00, 0.12) 0.02
Strata Strata Age 1+, cg SE Age 1+, cl SE
A C 0.02 (0.00, 0.07) 0.01 0.02 (0.01, 0.04) 0.01 A D 0.02 (0.00, 0.07) 0.01 0.00 (0.00, 0.02) 0.00 B A 0.01 (0.00, 0.05) 0.01 0.02 (0.01, 0.04) 0.01 B D 0.03 (0.01, 0.08) 0.01 0.03 (0.02, 0.05) 0.01 C A 0.14 (0.03, 0.41) 0.09 0.04 (0.01, 0.14) 0.03 C B 0.19 (0.06, 0.46) 0.10 0.40 (0.27, 0.54) 0.07 C D 0.40 (0.19, 0.65) 0.13 0.31 (0.20, 0.45) 0.07 D A 0.01 (0.00, 0.09) 0.01 0.01 (0.00, 0.05) 0.01 D B 0.01 (0.00, 0.09) 0.01 0.07 (0.04, 0.13) 0.02 D C 0.10 (0.05, 0.19) 0.03 0.19 (0.13, 0.26) 0.03
Figures
Figure 1.1. Map of Steller sea lion range and rookeries. Circle shows Russian Far East region study area. Adapted from NMFS, Alaska Fisheries Science Center
(www.afsc.noaa.gov/stellers/range.htm) and Phillips et al. 2011. Asian
Population 1650E
39 Figure 1.2. Map showing all 17 resighting locations. Triangles represent stratum A with natal rookeries Iony Is. and Yamsky, circles represent stratum B with natal rookery Kozlova Cape, open diamonds represent stratum C with no natal rookery, and squares represent stratum D with Medny being the natal rookery.
Figure 1.3. The average whole blood OC concentrations for all hot-branded SSL (n = 136) and for those in the above (n = 44) and below (n = 92) mean concentration groups, including standard error bars. The top panel shows the values for ∑PCB and the bottom panel shows the values for ∑DDT.
0 2 4 6 8 10 12
All (n=136) Above (n=44) Below (n=92)
∑ P C B ( ng g -1 ww) 0 1 2 3 4 5 6 7 8 9
All (n=136) Above (n=44) Below (n=92)
∑ DD T (ng g -1 ww) Contaminant Group
Figure 1.4. Estimates for the probability of resighting (p), using model ɸ(a,s,c), p(s,eff), Ψ(a,c), including 95% confidence intervals (dashed vertical lines) at each stratum
averaged (horizontal black line in each boxplot) from 2003 – 2011. Strata: A (Iony Island and Yamsky), B (Kozlova Cape), C (Bering Island), and D (Medny Island).
Figure 1.5. Selected movement probabilities (Ψ) for age group 0 using model ɸ(a,s,c), p(s,eff), Ψ(a,c). Results for SSL above (black text) and below (italic gray text) mean OC concentration group, including standard error (in parentheses) are shown.