RESOURCE PARTITIONING AMONG SYMPATRIC STELLER SEA LIONS AND NORTHERN FUR SEALS ON LOVUSHKI ISLAND, RUSSIA
A
DISSERTATION
Presented to the Faculty o f the University o f Alaska Fairbanks
in Partial Fulfillment o f the Requirements for the Degree o f
DOCTOR OF PHILOSOPHY
By
Jason N. Waite, M.S.
Fairbanks, Alaska
UMI Number: 3451174
All rights reserved
INFORMATION TO ALL USERS
The quality o f this reproduction is dependent upon the quality o f the copy submitted. In the unlikely event that the author did not send a com plete manuscript and there are missing pages, these will be noted. Also, if material had to be removed,
a note will indicate the deletion.
UMI
Dissertation PublishingUMI 3451174
Copyright 2011 by ProQuest LLC.
All rights reserved. This edition of the work is protected against unauthorized copying under Title 17, United States Code.
A ®
uest
ProQuest LLC789 East Eisenhower Parkway P.O. Box 1346
RESOURCE PARTITIONING AMONG SYMPATRIC STELLER SEA LIONS AND NORTHERN FUR SEALS ON LOVUSHKI ISLAND, RUSSIA
RECOMMENDED:
APPROVED:
By Jason N. Waite
Dr. Russel Andrews, Advisory Committee Co-Chair
Dr. Katrin Iken
Head, Program in Marine Science and Limnology
Dr. Michael Castellini
Dean, School o f Fisheries and Ocean Sciences
f. Lawrence Duffy, Deamof^he Graduate School o
Abstract
The competitive exclusion principle maintains that one o f two non-interbreeding species occupying the same ecological niche and geographical territory will be displaced if population growth is not the same between species. Steller sea lions (Eumetopias jubatus; SSL) and northern fur seals (Callorhinus ursinus; NFS) breed sympatrically on
four rookeries in the Russian Far East, creating the potential for inter-specific
competition for limited prey resources. Approximately 1,000 SSL and 14,000 NFS breed on Lovushki Island in the Kuril Island chain. An additional 13,000-14,000 juvenile NFS are present during the breeding season.
The partitioning o f forage resources among breeding SSL and both breeding and non-breeding NFS from 2003-2008 was examined through analysis o f prey remains recovered from scats and spews, stable isotope (SI) analysis o f vibrissae, fatty acid (FA) analysis o f blubber, and analysis o f foraging behavior through satellite-linked telemetry. Analysis o f prey remains indicated a biologically significant overlap in the prey species and size selection o f SSL and juvenile NFS and significant differences between the diets o f SSL and breeding NFS. SSL fed primarily on Atka mackerel, while breeding NFS fed primarily on cephalopods and northern smoothtongue. SI analysis indicated significant differences in the trophic level and relative foraging location. SSL foraged at a higher trophic level, nearshore, and benthically, while NFS foraged at a lower trophic level, offshore, and pelagically. Analysis o f FA signatures also suggested significant
differences in the relative diets o f breeding NFS and SSL. Foraging behavior analysis also indicated that SSL foraged nearshore and benthically and breeding NFS foraged offshore and pelagically. The combination o f these four methodologies suggests breeding NFS and SSL partition their forage resources by prey type and prey size, as well as spatially. This partitioning o f resources between breeding animals currently allows both species to coexist within the same geographical region and likely reflected the differences in foraging abilities and provisioning strategies o f the adults, as well as the fasting
abilities o f their pups. However, continued growth o f the non-breeding NFS population on Lovushki Island may lead to the competitive exclusion o f SSL due to inter-specific competition for food resources.
Signature P a g e ... i
Title P a g e ...ii
A bstract...iii
Table o f C ontents...v
List o f Figures... viii
List o f T ab les... x
Acknowledgem ents...xiii
General Introduction...1
C h a p te r 1. A nalysis o f scats and sp ew s... 11
Introduction... 11
M ethods...13
Sample collection and processing...13
Statistical analysis... 15
R esults... 19
Genetic analysis...19
F ur seal diet...20
Sea lion d ie t...28
Niche overlap and diet diversity...31
D iscussion...36
Inter-specific com petition...36
V
Table of Contents
Intra-specific com petition...40
Study b ia se s...41
C onclusions...45
C h a p te r 2. B iochem ical analyses o f vibrissae and b lu b b e r... 47
Introduction...47 M ethods... 52 Sample collection... 52 Laboratory analyses...53 Statistical a n a lyses...55 R esults...57 Stable isotopes... 57 Fatty a c id s... 63 D iscussion...74 Stable isotopes... 74 Fatty a c id s... 79 C onclusions...85
C h a p te r 3. A nalysis o f anim al m ovem ent and dive b e h a v io r ... 87
Introduction...87 M ethods... 89 R esults... 94 D iscussion...99 C onclusions... 110 vi
General C onclusions... 112
M ethodologies...112
Resource partitioning pa ttern s... 116
Literature C ite d ... 122
Figure 1. Photographs o f sympatric northern fur seals (dark brown) and Steller sea lions (light brown) on Lovushki Island in 2008 (upper panel) and Tuleny
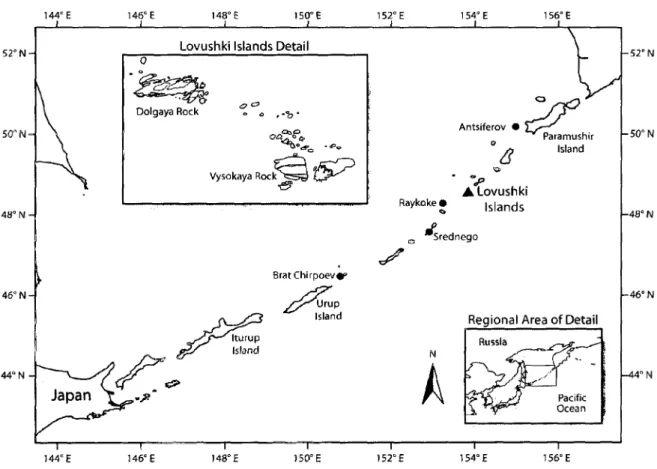
Island in 2004 (lower panel)... 5 Figure 2. Location o f the Lovushki Islands study site (filled triangle)... 8 Figure 3. Frequency o f occurrence and numerical abundance o f prey items found in
scats and spews o f Steller sea lions and northern fur seals collected from Lovushki Island, Russia, during the breeding seasons o f 2003, 2005, 2007, and 2 0 0 8 ... 21 Figure 4. Clustering dendrograms o f prey groups found in Steller sea lion and
northern fur seal scats collected on Lovushki Island, Russia, during the
breeding seasons o f 2003, 2005, 2007, and 2008... 29 Figure 5. Sizes o f prey items consumed by non-breeding northern fur seals (black)
and breeding Steller sea lions (grey) during the breeding seasons o f 2003, 2005, 2007, and 2008... 34 Figure 6. Mean (± SEM) 8,5N and S13C values for vibrissal roots o f northern fur
seals and Steller sea lions collected during the breeding seasons o f 2007
and 2008 on Lovushki Island, Russia...58 Figure 7. Relative concentrations o f saturated (SFA), monounsaturated (MUFA), and
polyunsaturated (PUFA) fatty acids found in northern fur seal (NFS) and Steller sea lion (SSL) blubber in 2007 and 2008... 67
List of Figures
Figure 8. Plot o f PC I and PC2 from principle components analysis on fatty acid composition o f blubber o f northern fur seals (NFS, circles) and Steller sea lions (SSL, triangles) collected in 2007 (open shapes) and 2008 (filled
shapes)...69 Figure 9. Plot o f P C I, PC2, and PC3 from principle components analysis on fatty
acid composition o f blubber o f northern fur seals (NFS, circles) and Steller sea lions (SSL, triangles) collected in 2007 and 2008 ... 71 Figure 10. Results o f classification and regression tree analysis on the fatty acid
composition o f northern fur seal (NFS) and Steller sea lion (SSL) blubber sam ples... 73 Figure 11. Plot o f typical foraging trips made by two northern fur seals in 2007 (red)
and 2008 (yellow )...97 Figure 12. Plot o f typical foraging trips made by two Steller sea lions in 2007 (red)
and 2008 (yellow )...98 Figure 13. Locations o f northern fur seal foraging bouts combined for 2007 and 2008
(red dots)... 101 Figure 14. Locations o f Steller sea lion foraging bouts combined for 2007 and 2008
(red dots)... 102 Figure 15. Rose diagrams o f northern fur seal (top) and Steller sea lion (bottom) bout
location bearings from Lovushki Island in 2007 and 2 0 0 8 ... 103 Figure 16. Time-depth trace o f typical Steller sea lion (upper) and northern fur seal
Table 1. M inimum number o f individual prey items consumed (MNI), percent numerical abundance (NA), and percent frequency o f occurrence (FO) o f prey taxa found in scats and spews from total (breeding and non-breeding) northern fur seals collected on Lovushki Island during the breeding seasons o f 2003, 2005, 2007, and 2008 ... 22 Table 2. M inimum number o f individual prey items consumed (MNI), percent
numerical abundance (NA), and percent frequency o f occurrence (FO) o f prey taxa found in scats and spews from breeding northern fur seals collected on Lovushki Island during the breeding seasons o f 2003, 2005,
2007, and 2008...23 Table 3. M inimum number o f individual prey items consumed (MNI), percent
numerical abundance (NA), and percent frequency o f occurrence (FO) o f prey taxa found in scats and spews from non-breeding northern fur seals collected on Lovushki Island during the breeding seasons o f 2003, 2005,
2007, and 2008...24 List of Tables
Page
Table 4. Results o f logistic regression models comparing occurrence o f prey species found in Steller sea lion (SSL) scats and northern fur seal (NFS) scats and spews. Odds ratios (OR) indicate relative magnitude o f relationship...26
XI
Table 5. Summary o f adjusted numerical abundance (NA*) based on prey- and size- specific numerical correction factors applied to the minimum number o f
individuals consumed for the five most commonly occurring prey types...26 Table 6. Summary o f the comparison o f minimum number o f individual prey items
consumed between northern fur seals (NFS) and Steller sea lions (SSL)... 27 Table 7. Minimum num ber o f individual prey items consumed (MNI), percent
numerical abundance (NA), and percent frequency o f occurrence (FO) o f prey taxa found in scats and spews from breeding Steller sea lions collected on Lovushki Island during the breeding seasons o f 2003, 2005, 2007, and
2008... 30 Table 8. Summary o f Pianka’s niche overlap indices calculated using three different
measures o f numerical abundance for breeding (B) and non-breeding (NB) northern fur seals (NFS) and Steller sea lions (SSL)... 33 Table 9. Summary o f Shannon's index o f diversity calculated for breeding (B) and
non-breeding (NB) Steller sea lions (SSL) and northern fur seals (NFS) using numerical abundance o f prey remains calculated from all samples
(NA) and from scat samples only (NAS)... 35 Table 10. Least-square mean (± SEM) 815N values for vibrissal roots o f northern fur
seals and Steller sea lions collected during the summer o f 2007 and 2008
Table 11. Least-square mean (±SEM) 5 C values for vibrissal roots o f northern fur seals and Steller sea lions collected during the summer o f 2007 and 2008
on Lovushki Island, Russia... 61 Table 12. 8 15N and 8 13C values o f vibrissal roots from northern fur seal (NFS) and
Steller sea lion (SSL) mother-pup pairs...62 Table 13. Change in 8 15N and 813C values over time for repeated samplings o f
vibrissal roots from recaptured northern fur seals and Steller sea lions... 64 Table 14. Mean relative concentration (±SEM) o f the 22 fatty acids quantified in
northern fur seal (NFS) and Steller sea lion (SSL) blubber from 2007 and
2008... 66 Table 15. Loadings from principle component analyses o f fatty acid profiles from
northern fur seals and Steller sea lions...70 Table 16. Summary o f instrument deployments for northern fur seals (NFS) and
Steller sea lions (SSL) in 2007 and 2008...91 Table 17. Summary o f dive depth and duration for northern fur seals (NFS) and
Steller sea lions (SSL) in 2007 and 2008...95 Table 18. Summary o f foraging trip durations and distances for northern fur seals
(NFS) and Steller sea lions (SSL) in 2007 and 2008... 96 Table 19. Summary o f dive bouts and bout ending criteria (BEC) for northern fur
seals (NFS) and Steller sea lions (SSL) in 2007 and 2008... 100
Acknowledgements
This project would not have been possible without the assistance o f many individuals. In particular, I would like to thank J. Albers, A. Altukhov, B. Bernhardt, A. Bishop, J. Gilding, S. Norberg, J. O ’Quin, O. Shpak, T. Shulezhko, J. Skinner, B. Smith, and A. Tretiyakov for their assistance in the collection and processing o f scat, vibrissae, and blubber samples and B. W alker and J. Thomason for their assistance with squid beak identification. Additional field assistance was provided by A. Aderholt, T. Goldstein, I. Hill, D. Holley, P. Olivier, N. Pavlov, D. Pasenyuk, S. Purtov, O. Savenko, V.
Vertyankin, and many others. I thank P. Rivera for her assistance in the processing o f vibrissae samples, K. Young and S. Quinn for processing blubber samples and assisting in fatty acid profile determination, J. Skinner for assistance in the analysis o f the
telemetry data, E. Gurarie for assistance with figures, and M. Short, J. McIntyre, and Z. Zhang for their advice on statistical analyses. Finally, I would especially like to thank V. Burkanov and D. Calkins o f North Pacific Wildlife Consulting, LLC, for their invaluable logistical support throughout the course o f the study.
Funding for this project was provided primarily through grants from The National Oceanographic and Atmospheric Administration (NOAA) issued to the Alaska SeaLife Center (ASLC). Fatty acid analysis for blubber samples collected in 2007 and vibrissae analytical preparation were partially supported through NOAA Grant
#NA08NMF4390544 to L. Rea and Alaska Department o f Fish and Game. Blubber fatty acid analysis for samples collected in 2008 was provided by S. Trumble and the
Laboratory o f Ecological and Adaptational Physiology at Baylor University. All work was conducted under permits from the Russian regional permitting agency
SakhalinVetSanNadzor and was approved by the ASLC Institutional Animal Care and Use Committee (IACUC), approved protocol numbers 06-004 and 07-001. All biological samples were imported into the United States under National M arine Fisheries Service permit #881-1724 issued to the ASLC under the authority o f the United States Marine Mammal Protection Act.
1
GENERAL INTRODUCTION
The competitive exclusion principle originally postulated by Gause (1934)
maintains that one o f two non-interbreeding species occupying the same ecological niche and the same geographical territory will be displaced if population growth is not the same between species. Therefore, as population growth between natural populations is never identical, competition between sympatrically occurring species will result in the absolute exclusion o f one o f those species unless it is able to modify how it exploits the available resources (Hardin 1960). For most animals, the resource that is most often limiting is the available food base. To reduce inter-specific competition and minimize the risk of competitive exclusion or displacement, food resources may be partitioned based on the type or size o f prey items consumed, or by spatially or temporally partitioning the foraging grounds.
Different methods o f resource partitioning have been documented in a variety o f animals. One o f the most commonly documented means o f dietary resource partitioning is by prey type. Zaret and Rand (1971) found that a decreased food supply during the dry season increases competition between nine species o f sympatric freshwater fish in
Panama, which results in a shift from widely overlapping diets during the wet season to specific, unique diets among the fish species during the dry season. Kitchen et al. (1999) found that swift foxes ( Vulpes velox) and coyotes (Canis latrans) coexist in parts o f Colorado due to partitioning o f dietary resources based on prey type and size, where the foxes and coyotes prey primarily on smaller items such as rodents or on larger items such
2
as lagomorphs, respectively. Sympatrically occurring Anolis lizards on South Bimini Island also partition based on prey type, with some species foraging almost exclusively on ants while others supplement their diet with more fruit (Schoener 1968).
Morphologically different insectivorous bats (Microchiroptera) in South Africa that forage in the same spatial locations have been shown to partition their prey items based on size (Aldridge and Rautenbach 1987), with larger bats taking larger specimens o f beetles than smaller bats. Two species o f sympatric mouse-eared bats (Myotis spp.) in Switzerland, nearly identical morphologically, were shown to partition their prey resources by specializing on grass- and ground-dwelling insects, respectively (Arlettaz
1999). Spatial partitioning o f habitat has been found to occur in three species o f
sympatric orb-weaving spiders that spin their webs at different heights in the vegetation (Brown 1981) and by nine species o f forest squirrels in Gabon that make use o f different vertical layers o f the rain forest vegetation (Emmons 1980). Temporal partitioning o f foraging grounds has also been documented. Where spatial habitats overlap, Rocky Mountain elk (Cervus elaphus nelsoni) and Rocky Mountain mule deer (Odocoileus hemionus hemionus) partition their available resources temporally through avoidance within a 7-day period (Stewart et al. 2002), thus reducing competitive interactions.
Dietary resource partitioning is also common among sympatrically occurring marine species. Partitioning based on prey type is common and has been documented to occur between cod {Gadus morhua) and minke whales (Balaenoptera acustorostrata) in the Barents Sea (Sivertsen et al. 2006), between bearded (Erignathus barbatus), ringed (Phoca hispida), ribbon (Phoca fasciata), and spotted (Phoca largha) seals in the Bering
3
Sea (Cooper et al. 2009), between New Zealand (Arctocephalus fo rsteri) and Australian (Arctocephalus pusillus) fur seals in southern Australia (Page et al. 2005), and many others. Sympatric ringed and ribbon seals in the Barents Sea partition their prey based on size (Wathne et al. 2000). Spatial partitioning o f foraging grounds is also common in marine mammals. Sympatric Antarctic (Arctocephalus gazella) and Subantarctic (Arctocephalus tropicalis) fur seals in the Crozet Islands forage in distinctly different areas from one another (Bailleul et al. 2005). Humpback (Balaenoptera musculus) and minke whales in the Antarctic both feed on krill (Euphausia superba) but segregate their foraging locations based on depth and water temperature (Friedlaender et al. 2009). Similar resource partitioning strategies have also been documented in species such as southern elephant seals (Mirounga leonina) and New Zealand fur seals to reduce intra specific competition among age, sex, and reproductive classes (Field et al. 2005, Page et al. 2005).
Competitive exclusion due to inter-specific competition has been shown to affect the geographic distribution o f ecologically equivalent species o f salamanders (Jaeger
1971), chipmunks (Brown 1971), foxes (Hersteinsson and M acdonald 1992), and mud snails (Race 1982, Brenchley and Carlton 1983), and the presence o f domestic cattle results in the competitive displacement o f Rocky M ountain elk in Colorado (Stewart et al. 2002). Competitive exclusion has been demonstrated between R isso’s dolphins {Grampus griseus) and short-finned pilot whales {Globicephala macrorhynchus), two delphinid species o f similar size with similar diets (Shane 1995). Bearzi (2005) suggests that distribution o f bottlenose dolphins {Tursiops truncates), short-beaked common
4
dolphins (Delphinus delphis), and long-beaked common dolphins (Delphinus capensis) o ff the coast o f Southern California is a consequence o f inter-specific competition for prey that results in the competitive exclusion o f two o f these species from the specific habitat occupied by the other. Heithaus (2001) suggested that when prey resources are limited, inter-specific competition between sharks (order Selachii) and dolphins (suborder Odontoceti) with similar diets in South Africa leads to niche divergence.
Steller sea lions (SSL, Eumetopias jubatus) breed sympatrically with northern fur seals (NFS, Callorhinus ursinus) on four rookeries in the Russian Far East: Medny Island (54.8667° N, 167.3667° E) in the Commander Island group, Srednego (47.5797° N, 152.9083° E) and Lovushki (48.5436° N, 153.6736° E) Islands in the Kuril Island chain, and Tuleny Island (48.5° N, 144.6334° E) in the western Sea o f Okhotsk (Figure 1). Approximately 46% o f the total SSL breeding population and approximately 43% o f the total SSL pup production in Russian waters occurs on these rookeries (Burkanov and Loughlin 2005). Ship-based surveys conducted between 2002 and 2005 estimated a range-wide SSL population o f 62,000-74,000 animals (Burkanov and Loughlin 2005, Pitcher et al. 2007) with approximately 16,000 (22-25% ) located along the coastal waters o f Russia and northern Japan (Burkanov and Loughlin 2005). As in North American waters, the Asian subpopulation o f SSL experienced a dramatic decline and has been unstable for the past 4 decades (Loughlin et al. 1992, Burkanov and Loughlin 2005). In
1994, the SSL was listed as an endangered species in the Russian Red Book. On Lovushki Island, the abundance o f non-pup SSL dropped from approximately 4,000 in
5
Figure 1. Photographs of sympatric northern fur seals (dark brown) and Steller sea lions (light brown) on Lovushki Island in 2008 (upper panel) and Tuleny Island in 2004 (lower panel).
6
increase, the population has remained at an average o f 1,039 SSL from 1995 through 2005 (Burkanov and Loughlin 2005).
Prior to being eradicated due to unregulated harvesting in the late 19th century, the non-pup population o f NFS in the Kuril Islands was estimated to have been at least
15,000 (Snow 1897). A slow re-establishment o f breeding colonies occurred in the early 20th century, and surveys conducted in 1955-56 counted approximately 2,000 fur seals on Lovushki Island and an additional 800-900 on Srednego Island (Klumov 1957). The non pup population in this region continued to grow at 19.9% per year until 1978 and then remained relatively stable at an average o f 8,063 for the next decade (Kuzin 1999). A rapid increase in NFS population numbers ensued during the early 21st century with pup counts on Lovushki Island increasing to approximately 12,180 pups by 2006 (Burkanov et al. 2007). Using a method o f estimating total abundance wherein pups are considered to be an average o f 30% o f the total population (Kuzin 1999), the total non-pup NFS population in 2006 on Lovushki Island alone was estimated at 28,420.
SSL and NFS are both piscivorous, sexually dimorphic pinnipeds with similar
ecological requirements and life history traits. The mass o f adult male SSL is up to 1,120 kg and females to 350 kg (Loughlin et al. 1987) while the mass o f adult male NFS is up to 320 kg and females to 71 kg (Scheffer and Wilke 1953). The foraging behavior o f NFS and SSL is similar, with variations resulting from differences in prey availability, season, and local bathymetric and oceanographic conditions. NFS and SSL have similar diets, typically consuming species such as walleye pollock (Theragra chalcogramma), Atka mackerel (Pleurogrammus monopterygius), salmon (Oncorhynchus spp.), cephalopods,
7
and a variety o f forage fish such as capelin (Mallotus villosus), herring (Clupea pallasi), and northern smoothtongue (Leuroglossus schmidti) (Sinclair et al. 1994, Merrick et al.
1997, Waite and Burkanov 2006, Zeppelin and Ream 2006, M cKenzie and Wynne 2008). SSL typically forage at depths <30 m during the evening, night, and early morning hours but are known to forage at >250 m, especially during the day (M errick et al. 1994, M errick and Loughlin 1997, Loughlin et al. 1998). Pelagically foraging NFS also
typically dive to depths <30 m during the night, but NFS that feed either benthically or on non-vertically migrating prey will dive to depths >75 m throughout the day (Gentry et al.
1986a). With overlapping breeding periods (M ay-A ugust) the adults o f both species become highly territorial and males vigorously defend harems o f breeding females, and with a 2-3 month overlap in pup nursing, foraging also becomes competitive because adult females o f both species are central place foragers, alternating between periods o f foraging at sea and nursing their pups on land (Mathisen et al. 1962, Pitcher and Calkins
1981, Gentry and Kooyman 1986, Gentry 2002).
Kuzin et al. (1977) hypothesized that NFS competitively displace SSL on Kuril Island rookeries during periods o f increased NFS population size and Loughlin and M iller (1989) suggested the potential for a similar response on B ogoslof Island, Alaska. Therefore, the goal o f this project was to examine the resource partitioning among sympatrically occurring SSL and NFS on Lovushki Island, Russia (Figure 2), in order to assess the potential for the competitive exclusion o f SSL during a period when the rapidly expanding NFS population has reached a historic high. To accurately assess the level o f
8 52° N 50" N 48° N 46° N 44“ N 144° E 146° E 148° E 150° E 152° E 1 54° E 156“ E
dietary overlap and potential for inter-specific competition, four different techniques were used to estimate the diet composition and foraging locations o f both predator
species at different temporal scales. In Chapter 1, the diet composition o f breeding female SSL, breeding female NFS, and non-breeding juvenile NFS is estimated through the analysis and identification o f undigested prey remains recovered from scats and spews collected on Lovushki Island during the breeding seasons o f 2003, 2005, 2007, and 2008. Differences in the prey species, minimum number o f individual prey items consumed, and the relative sizes o f the prey items consumed are examined. Genetic analyses were performed on samples collected from portions o f the rookery where substantial mixing o f species occurs to determine the species o f origin. The analysis o f samples from a single collection effort provides information on prey consumed during the anim al’s most recent meal. M ultiple collections were made during each breeding season so that an estimate o f diet composition representative o f the entire breeding season could be made.
In Chapter 2, resource partitioning based on prey type and foraging location is
examined through biochemical analyses o f samples collected in 2007 and 2008. Ratios o f stable carbon and nitrogen isotopes in the roots o f vibrissae collected from adult female SSL and NFS and their pups are used to estimate trophic level and relative foraging location and reflect the diet integrated over the previous 2 weeks. Differences in dietary composition are also examined through the analysis o f fatty acid profiles o f blubber collected from both predator species. These samples represent the diet integrated over the previous 30 days. While specific prey items could not be determined using either o f these two methods, general dietary differences could be inferred.
The spatial partitioning o f the foraging grounds is examined through the use o f time- depth recorders and satellite telemetry in Chapter 3. The movements and diving behavior o f adult female NFS and SSL were monitored over a period o f 4 -4 4 days in 2007 and 2008. Differences in dive depth and duration, foraging trip distance and duration, and the location o f foraging bouts were examined and the results are compared to the diet
composition and foraging location estimates inferred from the analysis o f scats and spews, vibrissal roots, and blubber.
This study is the first to examine the resource partitioning o f two sympatrically occurring animals through the simultaneous use o f all four o f these methodologies. This is also the first study which applies molecular techniques to examine dietary differences between sympatrically occurring SSL and NFS.
11
CHAPTER 1. ANALYSIS OF SCATS AND SPEWS
INTRODUCTION
Historic data on the diet o f SSL and NFS in Russian waters are sparse. Based on analyses o f stomach contents, the diets o f NFS and SSL on their allopatric sites in the Kuril Islands were similar in the 1950s and 60s (Panina 1964, Belkin 1966, Panina 1966, Kuzin et al. 1977) with walleye pollock (Theragra chalcogramma) accounting for the majority o f the NFS and SSL diet. Rockfish (Sebastodes sp.), Okhotsk Atka mackerel (Pleurogrammus azonus), sandlance (Ammodytes hexapterus), and cephalopods were also predominant (Belkin 1966). Kuzin et al. (1977) described a partitioning o f diet between the two pinniped species in the early 1970’s on sympatric rookeries in the Kuril Islands: the frequency o f occurrence o f prey remains recovered from stomachs o f NFS was 75.8% Commander squid (Berryteuthis magister), 27.6% Japanese flying squid (Todarodes pacificus), and 3.4% pollock, while stomachs o f SSL contained 70.7% pollock, 26.8%
Octopoda, 31.7% Commander squid, 12.1% Japanese flying squid, and 7.3% Hexagrammidae. During this period, the population o f NFS was relatively low and outnumbered SSL at less than 2.5:1 (Kuzin et al. 1977), compared with the 28:1 ratio in 2006.
The N orth Pacific and Bering Sea experienced oceanographic regime shifts in 1976-1977 and 1989 that resulted in marked changes in the abundance and distribution o f the primary prey o f both SSL and NFS (Anderson and Piatt 1999, Benson and Trites
2002, Conners et al. 2002). There are no data to suggest that the changes experienced in the North Pacific and Bering Sea affected the prey abundance and distribution in Russian waters. Waite and Burkanov (2006) presented the most recent data on SSL prey selection on allopatric sites throughout the majority o f their Russian range and suggested that while pollock had been one o f the major prey items, it had been replaced by salmon and Atka mackerel (Pleurogrammus monopterygius) as the dominant prey items o f SSL on rookeries in the Kuril Islands.
Recent studies on NFS diet in Russian waters are extremely limited; however, data from other regions o f the northern Pacific Ocean indicate some dietary overlap between the two species. Stomachs from juvenile and adult NFS captured off the Pacific coast o f northern Japan in 1997-98 contained primarily squid, smelt, anchovy,
headlightfish (Diaphus sp.), and lampfish (Myctophidae) (Yonezaki et al. 2003). Prey items found in SSL scats collected on haul-outs in the southern Kuril Islands near Japan were similar, consisting o f large numbers o f anchovy, gadids, and squid (Waite and Burkanov 2006). W alleye pollock and Atka mackerel were important prey items for both NFS and SSL in the Aleutian and Pribilof Islands from 1981-2005 (Sinclair et al. 1994, M errick et al. 1997, Zeppelin and Ream 2006, M cKenzie and Wynne 2008).
Antonelis et al. (1997) found that NFS on Medny Island in 1988 consumed primarily squid and relatively little Atka mackerel while Waite and Burkanov (2006) found that SSL on M edny Island in 2001 consumed exclusively Atka mackerel (n = 12). There are no known published studies containing recent data on SSL or NFS diets on the remaining three sympatric rookeries, primarily due to difficulties in distinguishing
between the scats o f the two species. Therefore, very little is known regarding prey selection trends, diet diversity, or level o f competition for prey resources with
commercial fisheries over the last several decades for a substantial portion o f the SSL and NFS population. Similar life history traits and ecological requirements, along with recent growth in the local population o f both species, increase the potential for elevated inter specific competition for food resources. This study combines the identification o f predator scat using fecal DNA and the analysis o f undigested prey remains to examine the use o f prey resources by SSL and NFS on Lovushki Island, one o f four rookeries in the Russian Far East where these two species breed sympatrically (Figure 2).
METHODS
Sample collection and processing
During the breeding seasons o f 2003, 2005, 2007, and 2008 (June through August) we collected a total o f 495 scats and 44 spews from both the breeding and non breeding portions o f the rookery at Lovushki Island. We obtained an additional six fecal samples via enema (Yonezaki et al. 2004), five fecal samples via normal defecation, and two stomach content samples via gastric lavage (Antonelis et al. 1987) from breeding female fur seals while they were restrained during concurrent research projects.
Scat and spew samples were collected opportunistically when the rookery was disturbed for concurrent research projects. On the most densely populated portions o f the
rookery breeding SSL segregate into groups, which were usually surrounded by groups o f breeding NFS. These areas were visually monitored by field observers present on the rookery for the duration o f the breeding season. Only fresh scats were collected in these areas to maximize the likelihood that we could positively identify which species had deposited the fecal samples. Because the boundaries o f these groups are plastic, scats collected near the edges were sub-sampled for genetic analysis and species verification (n = 51). In locations where significant species mixing occurs, each scat was sub-sampled for genetic analysis before removal from the substrate (n = 63). Samples collected in these areas were considered to be primarily from breeding animals. The remainder o f the samples collected from non-breeding portions o f the rookery and outlying rocks inhabited exclusively by NFS were considered to be from non-breeding NFS.
The genetic sub-samples were collected and stored according to Murphy et al. (2002) wherein 1-2 ml o f fecal material per scat was collected, placed in 95% ethanol at a 4:1 (ethanol:feces) ratio by volume, and stored either at room temperature or at -80°C. Fecal genetic samples were analyzed at the University o f Idaho (Moscow, Idaho) according to Waite et al. (In press) to determine the species o f origin.
Each scat was placed in a separate plastic bag and processed onboard a support vessel. The plastic bags were filled with water and a mild detergent and allowed to soak for 24-48 hours while being agitated by the movement o f the vessel. The resulting slurry was rinsed through a series o f three nested mesh sieves (1.000 mm, 0.710 mm, and 0.500 mm). Solid fecal material was gently manipulated with a soft brush and rinsed with water until it passed through the sieves (Treacy and Crawford 1981).
Prey species were enumerated and identified to the lowest possible taxonomic group by Pacific Identifications, Inc. (Victoria, British Columbia) from the dried hard parts. All identifiable skeletal structures (versus only otoliths) were used to reduce the problems associated with differential digestion o f smaller or more delicate prey items (Browne et al. 2002, Tollit et al. 2006). The minimum number o f individuals (MNI) consumed for each prey type was estimated by counting a variety o f key diagnostic structures. Prey size was estimated and grouped into species-specific size categories based on an extensive reference collection o f skeletal remains.
Statistical analysis
For general diet descriptions, data from scats and spews were pooled to accurately assess frequency o f occurrence, prey size, and total number o f prey. Pooling scat and spew data also reduces the biases associated with analyzing scat or spew separately (Page et al. 2005, Gudmundson et al. 2006), as spews often contain prey remains too large to pass through the pyloric sphincter and increased numbers o f cephalopod beaks that had accumulated in the folds o f the stomach lining (Jobling and Breiby 1986, Harvey and Antonelis 1994). For comparisons between scats and spews, enema samples were grouped with scats and stomach samples were grouped with spews. The relative importance o f each prey type was calculated using (1) simple frequency o f occurrence
FO; =
16
x 100
(1)
where «, is the number o f samples containing prey type i and nt is the total number o f samples examined; and (2) percent numerical abundance (NAi), a measure o f dominance:
NA. =r M N I ' x 100 (2)
MNI,
where MNI; is the minimum number o f individuals o f prey type / consumed and MNIt is the minimum number o f all prey items consumed. NAi was calculated for spew and scat samples combined and for scat samples only (NA% An adjusted MNI, (MNI*) was calculated for each prey type by applying numerical correction factors (NCF) published for Steller sea lions (Tollit et al. 2007) to scat samples to account for species-specific differences in complete prey digestion. Adjusted NA, values (NA f) and 95% confidence intervals were computed. Size-specific NCFs were applied when available (Tollit et al. 2007). There are currently no published prey-specific correction factors available for NFS.
Binary logistic regression models were used to determine if the occurrence o f prey varied by predator species, reproductive group, or sample type. The presence or absence o f each prey type was modeled as a binary response variable with species- reproductive group (SSL breeding, NFS breeding, and NFS non-breeding), sample type (scat or spew), and the interaction between group and sample type as explanatory variables. If a significant interaction term was added to the model, sample types within each group were compared.
17
Fligner-Policello tests were performed to test for differences in number o f prey species and M7V7, found in individual samples between scats and spews, predator species, and reproductive groups. The Fligner-Policello statistic tests for differences in central tendency among samples with unequal variances and was selected due to its robustness concerning violations o f the assumption o f symmetrical distributions (Fligner and Policello II 1981).
To quantify the dietary overlap among reproductive and species groups, we calculated Pianka’s niche overlap index (0,*) (Pianka 1973):
where p tJ and p tk are the percent numerical abundance (NA) o f the zth prey type for the predator groups j and k being compared. The index Ojk ranges from 0 to 1 where 0 indicates no dietary resource sharing between the two groups and 1 indicates a complete overlap in their diet. A value greater than 0.6 is considered to be a “biologically
significant” overlap (Zaret and Rand 1971, M athur 1977, Wallace 1981). The niche overlap index for each pair o f groups was calculated based on NAi, NA], and NA f.
Pearson’s chi-square contingency table analyses were performed to test for differences in the size o f prey items consumed between predator groups with a biologically significant niche overlap index. W hen a contingency table contained a cell size o f < 5,p-values were computed for a M onte Carlo test using 1000 replicates (Hope 1968). Contingency table tests were only perform ed for prey species that occurred in >5% o f scats.
The diversity o f the diet o f each species and reproductive group was calculated using Shannon’s index o f diversity:
H = P jln Pi (5)
1=1
where p, is the numerical abundance o f the zth prey type (NA,), and k is the number o f prey types.
Associations between prey types found in individual samples were examined by calculating Pearson partial correlation coefficients for each pair o f prey types within each predator species and reproductive group. Partial correlation takes into account the
interactions o f other prey types on the two species under consideration. Correlations between prey species were illustrated with a dendrogram produced through an
agglomerative hierarchical cluster analysis. Clustering method was set to “average” and the distance between prey types was set to 1 minus the Pearson partial correlation coefficient o f those two items (McGarigal et al. 2000).
Unless otherwise noted, all statistical analyses and calculation o f indices were performed using five prey groups, which consisted o f species that occurred in >5% o f all samples: Atka m ackerel, salmon, walleye pollock, cephalopods, and northern
smoothtongue. Scats that were without hard parts or remains that could not be identified to at least family level were not included in the analyses. Sample size was considered to be insufficient to test for differences between years based on analyses by Trites and Joy (2005). Simple bootstrapping was used to estimate 95% confidence intervals (Cl) around the overlap and diversity indices. Differences between the bootstrapped confidence
intervals were calculated to test for differences in indices among groups. All means are reported ±SEM. Statistical analyses were performed using R version 2.9.2 (The R Foundation for Statistical Computing) and SAS version 9.1 (SAS Institute Inc, Cary, North Carolina).
RESULTS
Genetic analysis
O f the 114 fecal subsamples genetically analyzed to determine species, 28 were determined to be from fur seals and 78 from sea lions. A total o f 10 samples could not be identified to species due to problematic DNA extractions or amplification failure, and were not included in the analyses. O f the 51 scat samples that were collected near the boundary between groups o f SSL and NFS, approximately 12% (n = 6) had been incorrectly identified in the field based on collection location but correctly identified using molecular techniques, emphasizing the importance o f genetic testing.
20
Fur seal diet
O f the 242 scats and 45 spews collected from NFS, 198 scats (81.8%) and 43 spews (95.5%) contained prey remains that could be minimally identified to the family level. No prey remains were found in 13 (5.4%) o f the scats. The remaining scats (12.8%) and spews (4.5%) contained unidentifiable prey remains. A total o f 21 different prey types were identified with nine identified to species. Overall, the most common prey items, in order o f frequency o f occurrence, were Atka mackerel (50.0%), salmon (37.6%), cephalopods (28.5%; primarily Gonatopsis sp. cf. G. borealis), walleye pollock (26.3%), and northern smoothtongue (17.5%). The most dominant prey items, in order o f
numerical abundance, were cephalopods (27%), northern smoothtongue (25.8%), Atka mackerel (19.2%), walleye pollock (12.6%), and salmon (8.7%) (Figure 3, Table 1).
Diet composition varied between reproductive groups; salmon (FO = 43.4%), cephalopods (FO = 41.4%), and Atka mackerel (FO = 31.7%) were the most frequently occurring taxa in the breeding NFS diet; however, northern smoothtongue (NA = 40.9%) and cephalopods (NA = 31.5%) were the most numerically abundant (Table 2). The most frequently occurring taxa in the non-breeding NFS diet (Table 3) were Atka mackerel (FO = 69.1%), pollock (FO = 36.0%), and salmon (FO = 31.6%); however, cephalopods (NA = 23%) were more numerically abundant than salmon (NA = 7.9%). Based on frequency o f occurrence, breeding NFS consumed significantly more cephalopods (x2 = 29.76,/? < 0.001), northern smoothtongue (x2 = 20.41,/? < 0.001), and salmon (x2 = 6.70, p = 0.010) than non-breeding NFS. Non-breeding NFS consumed
21
Breeding Sea Lions Breeding Fur Seals Non-Breeding Fur Seals
0 O 3 O O O o c 0 3 O' 0 I I 0 O c CO ~oc 3 < 0 O ‘u 0 E 3
A tka Pol Sal Ceph NST Atka Pol Sal Ceph NST A tka Pol Sal Ceph NST
Figure 3. Frequency o f occurrence and dominance o f prey items found in scats and spews o f Steller sea lions and northern fur seals collected from Lovushki Island, Russia, during the breeding seasons of 2003, 2005, 2007, and 2008. Atka = Atka mackerel, Pol = Walleye pollock, Sal = Salmon, Ceph = Cephalopods, NST = northern smoothtongue.
Table 1. Minimum number of individual prey items consumed (MNI), percent numerical abundance (NA), and percent frequency of occurrence (FO) o f prey taxa found in scats and spews from total (breeding and non-breeding) northern fur seals collected on Lovushki Island during the breeding seasons o f 2003, 2005, 2007, and 2008. The total number o f samples collected and the total number o f samples with prey remains are in parentheses. Grouped totals are in bold._____________________________________________________________________________________________________
Prey Type (n MNI 2003 = 42/35) NA FO (n MNI 2005 = 48/48) NA FO (n MNI 2007 = 105/98) NA FO (n MNI 2008 = 93/93) NA FO (n = MNI Total = 288/274) NA FO Fish 112 85.5 97.1 220 71.4 95.8 254 89.4 98.0 330 66.9 93.5 916 73.0 96.0 Unidentified fish 6 4.6 17.1 5 1.6 10.4 23 8.1 23.5 15 3.0 16.1 49 3.9 17.9 Hexagrammidae 34 26.0 57.1 37 12.0 37.5 82 28.9 52.0 89 18.1 51.6 242 19.3 50.0 Atka m ackerel 34 26.0 57.1 37 12.0 37.5 82 28.9 52.0 88 17.8 51.6 241 19.2 50.0 Rock greenling 1 0.2 1.1 1 0.1 0.4 Gadidae 2 1.5 5.7 1 0.3 2.1 40 14.1 28.6 118 23.9 46.2 161 12.8 27.0 Unidentified gadid 1 0.3 2.1 1 0.2 1.1 2 0.2 0.7 W alleye pollock 2 1.5 5.7 40 14.1 28.6 116 23.5 45.2 158 12.6 26.3 Pacific cod 1 0.2 1.1 1 0.1 0.4 Salmon 18 13.7 48.6 37 12.0 75.0 26 9.2 25.5 28 5.7 26.9 109 8.7 37.6 N. sm oothtongue 26 19.8 17.1 140 45.5 39.6 81 28.5 7.1 77 15.6 17.2 324 25.8 17.5
Other fish species 26 19.8 34.3 2 0.7 2.0 3 0.6 2.2 31 2.5 5.8
Sculpin 12 9.2 14.3 12 1.0 1.8 Irish lord 1 0.8 2.9 1 0.1 0.4 H erring 1 0.8 2.9 1 0.1 0.4 Lam pfish 1 0.4 1.0 1 0.1 0.4 High cockscom b 1 0.4 1.0 1 0.2 1.1 2 0.2 0.7 Prickleback 2 0.4 1.1 2 0.2 0.4 Sand lance 2 1.5 2.9 2 0.2 0.4 Snailfish 2 1.5 2.9 2 0.2 0.4 Stone cockscom b 8 6.1 22.9 8 0.6 2.9 Cephalopods 19 14.5 25.7 88 28.6 41.7 30 10.6 14.3 201 40.8 37.6 338 27.0 28.5 U nidentified ceph. 1 0.8 2.9 46 14.9 20.8 6 2.1 5.1 40 8.1 14.0 93 7.4 10.6 Squid 18 13.7 22.9 42 13.6 37.5 24 8.5 11.2 160 32.5 30.1 244 19.5 23.7 Octopus 1 0.2 1.1 1 0.1 0.4 Other Prey* 2 5.7 83 33.3 3 3.1 11 9.7 99 10.9 Bird 1 2.9 1 0.4 Polychaete worm 1 2.9 83 33.3 3 3.1 11 9.7 98 10.6
* Polychaete worms and birds were considered to be secondary or incidental prey items and therefore not included in the calculations o f percent numerical abundance.
Table 2. Minimum number o f individual prey items consumed (MNI), percent numerical abundance (NA), and percent frequency of occurrence (FO) of prey taxa found in scats and spews from breeding northern fur seals collected on Lovushki Island during the breeding seasons of 2003, 2005, 2007, and2008^T hetotaO ium berofsam £les_c^lectedanddretotahuuriberofsam £le^
Prey Type (n MNI 2003 = 12/11) NA FO (» MNI 2005 = 36/36) NA FO (n MNI 2007 = 48/46) NA FO (n MNI 2008 = 51/51) NA FO (" MNI Total = 148/145) NA FO Fish 46 71.9 90.9 167 69.6 100.0 140 83.8 95.7 144 57.8 88.5 497 65.6 93.8 Unidentified fish 2 3.1 18.2 5 2.1 13.9 15 9.0 32.6 12 4.8 21.2 34 4.5 22.8 Hexagrammidae 2 3.1 18.2 5 2.1 13.9 26 15.6 41.3 31 12.4 38.5 64 8.4 31.7 A tka mackerel 2 3.1 18.2 5 2.1 13.9 26 15.6 41.3 30 12.0 38.5 63 8.3 31.7 Rock greenling 0.0 1 0.4 1.9 1 0.1 0.7 Gadidae 1 1.6 9.1 4 2.4 8.7 27 10.8 36.5 32 4.2 16.6 U nidentified gadid 0.0 0.0 1 0.4 1.9 1 0.1 0.7 W alleye pollock 1 1.6 9.1 4 2.4 8.7 26 10.4 34.6 31 4.1 15.9 Salmon 7 10.9 63.6 29 12.1 77.8 14 8.4 30.4 17 6.8 26.9 67 8.8 43.4 N. sm oothtongue 25 39.1 45.5 128 53.3 36.1 80 47.9 13.0 77 30.9 30.8 310 40.9 27.6
Other fish species 9 14.1 36.4 1 0.6 2.2 1 0.4 1.9 11 1.5 4.1
High cockscomb 0.0 1 0.6 2.2 1 0.1 0.7 Irish lord 1 1.6 9.1 1 0.1 0.7 Prickleback 0.0 2 0.8 1.9 2 0.3 0.7 Sculpin 2 3.1 18.2 2 0.3 1.4 Snailfish 2 3.1 18.2 2 0.3 1.4 Stone cockscom b 4 6.3 36.4 4 0.5 2.8 Cephalopods 18 28.1 72.7 73 30.4 36.1 27 16.2 26.1 121 48.6 51.9 239 31.5 41.4 U nidentified ceph. 1 1.6 9.1 41 17.1 22.2 3 1.8 6.5 35 14.1 19.2 80 10.6 15.2 Squid 17 26.6 63.6 32 13.3 33.3 24 14.4 23.9 86 34.5 42.3 159 21.0 35.9 Other Prey* 2 18.2 55 33.3 2 4.3 11 17.3 70 17.2 Bird 1 9.1 1 0.7 Polychaete worm 1 9.1 55 33.3 2 4.3 11 17.3 69 16.6
* Polychaete worms and birds were considered to be secondary or incidental prey items and therefore not included in the calculations of percent numerical abundance.
KJ U>
Table 3. Minimum number o f individual prey items consumed (MNI), percent numerical abundance (NA), and percent frequency of occurrence (FO) o f prey taxa found in scats and spews from non-breeding northern fur seals collected on Lovushki Island during the breeding seasons of 2003, 2005, 2007, and 2008. The total number o f samples collected and the total number o f samples with prey remains are in parentheses. Grouped totals are in bold. Prey Type (n MNI 2003 = 25/31) NA FO (n MNI 2005 = 16/16) NA FO (n MNI 2007 = 56/52) NA FO (n MNI 2008 = 43/43) NA FO (n = MNI Total = 157/136) NA FO Fish 66 98.5 100.0 95 66.9 100.0 114 97.4 100.0 164 67.2 97.7 439 77.0 99.3 U nidentified fish 4 6.0 16.0 1 0.7 6.3 8 6.8 15.4 3 1.2 7.0 16 2.8 11.8 Hexagrammidae 32 47.8 72.0 35 24.6 100.0 56 47.9 61.5 58 23.8 65.1 181 31.8 69.1 A tka mackerel 32 47.8 72.0 35 24.6 100.0 56 47.9 61.5 58 23.8 65.1 181 31.8 69.1 Gadidae 1 1.5 4.0 1 0.7 6.3 36 30.8 46.2 90 36.9 55.8 128 22.5 36.8 Unidentified gadid 1 0.7 6.3 1 0.2 0.7 W alleye pollock 1 1.5 4.0 36 30.8 46.2 90 36.9 55.8 127 22.3 36.0 Pacific cod 1 0.4 2.3 1 0.2 0.7 Salmon 11 16.4 40.0 11 7.7 68.8 12 10.3 21.2 11 4.5 25.6 45 7.9 31.6 N. sm oothtongue 1 1.5 4.0 47 33.1 56.3 1 0.9 1.9 49 8.6 8.1
Other fish species 17 25.4 32.0 1 0.9 1.9 1 0.4 2.3 19 3.3 7.4
Sculpin 10 14.9 12.0 10 1.8 2.2 H erring 1 1.5 4.0 1 0.2 0.7 Lampfish 1 0.9 1.9 1 0.2 0.7 High cockscom b 1 0.4 2.3 1 0.2 0.7 Sand lance 2 3.0 4.0 2 0.4 0.7 Stone cockscom b 4 6.0 16.0 4 0.7 2.9 Cephalopods 1 1.5 4.0 47 33.1 62.5 3 2.6 3.8 80 32.8 18.6 131 23.0 15.4 Unidentified ceph. 23 16.2 25.0 3 2.6 3.8 5 2.0 7.0 31 5.4 6.6 Squid 1 1.5 4.0 24 16.9 56.3 74 30.3 11.6 99 17.4 11.0 Octopus 1 0.4 2.3 1 0.2 0.7 Other Prey* 29 31.3 1 1.9 30 4.4 Bird 0 0.0 Polychaete worm 29 31.3 1 1.9 30 4.4
* Polychaete worms and birds were considered to be secondary or incidental prey items and therefore not included in the calculations of percent numerical abundance.
significantly more Atka mackerel (%2 = 39.13,/? < 0.001) and pollock (x2 = 10.18,/? = 0.001) than breeding NFS.
Diet composition varied between scats and spews (Table 4). The occurrence o f
9 9
pollock (x = 1 1 .1 8, p < 0.001) and cephalopods (x = 5.58, p = 0.018) was significantly 'y
higher in spews than in scats. Atka mackerel (x = 4.38,p = 0.036) and northern
'y
smoothtongue (x = 4.43, p = 0.039, Fisher’s exact test) occurred more frequently in scats than in spews. The application o f numerical correction factors to the scat MNI values resulted in a change in dominance ranks (Table 5).
Scats from breeding and non-breeding NFS contained a mean o f 2.1 ± 0 .1 and 1.7 ± 0.1 prey species and 5.2 ± 0.8 and 2.7 ± 0.3 individual prey items, respectively. Neither difference was significant (p > 0.05, Fligner-Policello tests). Nearly identical percentages (49.1%) o f the scats from breeding NFS and non-breeding (48.8%) NFS contained only 1 prey species. The majority o f scats from breeding NFS (80.9%) contained < 5 individual prey items and 7.2% contained between 20 and 53 individual prey items. The majority o f scats from non-breeding NFS (87.2%) contained < 3 individual items with a maximum number o f individual items in a single scat equaling 15. The num ber o f prey species contained in spews from breeding (3.4 ± 0.2) and non-breeding (2.3 ± 0.1) NFS was not significantly different, nor were there significant differences in the num ber o f prey species found in scats from breeding (2.6 ± 0.1) and non-breeding NFS (3.1 ± 0.1, p > 0.05, Fligner-Policello tests).
The M N I o f prey items differed between scats and spews (Table 6). The M NI o f Atka mackerel (U = -3.15 ,p = 0.002), cephalopods (U = -3.99, p < 0.001), and pollock
Table 4. Results o f logistic regression models comparing occurrence o f prey species found in Steller sea lion (SSL) scats and northern fur seal (NFS) scatsjmdsjreN^^Oddsjjatios^OR^mdicaterelativejn^^ NFS-B vs NFS-NB NFS-B vs SSL NFS-NB vs SSL NFS Scats vs Spews Prey____________x2 P OR y2 p OR______ y2 p OR x2 P OR Atka Mackerel 39.13 <0.001 0.14 94.91 < 0.001 0.06 7.53 0.006 0.39 4.38 0.036 2.22 Cephalopods 29.76 < 0.001 6.64 55.94 <0.001 8.50 0.54 0.463 1.32 5.58 0.018 0.39 N. Smoothtongue 20.41 <0.001 6.47 22.02 <0.001 120.00 7.49 0.006 18.55 4.43a 0.039 Pollock 10.18 0.001 0.38 1.17 0.280 0.733 6.26 0.012 1.95 11.18 <0.001 0.306 Salmon 6.70 0.010 1.98 34.07 < 0.001 3.99 7.89 0.005 2.01 __b
aNot analyzed in logistic regression model due to quasi-separation of the data. Pearson’s chi-square with Fisher’s exact test reported here. 'N ot included in the final model due to lack of significance.
Table 5. Summary o f adjusted numerical abundance (NA*) based on prey- and size-specific numerical correction factors applied to the minimum number of individuals consumed for the five most commonly occurring prey types. Each prey type is ranked based on frequency of occurrence (FO), numerical abundance based on scats only (NA), and adjusted numerical abundance._______________________________________________________
Prey type Atka mackerel Cephalopods Northern Smoothtongue Pollock Salmon
Northern fur seals Breeding NAS 9.9 27.4 48.4 3.6 10.8 NA* (95% Cl) 11.7 (9.1, 15.5) 18.1 (17.7, 18.6) 55.1 (46.7, 67.7) 3.9 (2.2, 6.4) 11.2 (8.2, 17.7) Rank FO / NAS / NA* 3 / 4 / 3 2 / 2 / 2 4 / 1 / 1 5 / 5 / 5 1 / 3 / 4
Northern fur seals Non-breeding NAS 48.7 9.1 6.0 23.3 12.9 NA* (95% Cl) 53.0 (41.1.70.2) 5.4 (5.4, 5.7) 6.4 (5.4, 7.7) 22.9 (13.6.38.3) 12.3 (9, 19.5) Rank FO / NAS / NA* 1 / 1 / 1 4 / 4 / 5 5 / 5 / 4 2 / 2 / 2 3 / 3 / 3 NAS 76.8 3.9 0.3 10.9 8.2
Steller sea lions
NA* Rank (95% Cl) 79.5 (62.0, 100.0) 2.3 (2.2, 2.3) 0.3 (0.2, 0.3) 10.4 (6.2, 18.0) 8.2 (5.4,11.7) FO / NAS / NA* 1 / 1 / 1 4 / 4 / 4 5 / 5 / 5 2 / 2 / 2 3 / 3 / 3 ON
Table 6. Summary of the comparison o f minimum number o f individual prey items consumed between northern fur seals (NFS) and Steller sea lions Prey Spew NFS Scat Total SSL Total Fligner-Policello test
NFS scat vs NFS scat vs NFS total vs spew SSL scat SSL scat
Atka mackerel 2.9 ± 0.5 1.5 ±0.1 1.8 ± 0.1 2.5 ±0.1 U =-3.15 U =-6.21 U =-5.68 (1,9) (1,6) (1,9) (1, 10) p = 0.002 p < 0 . 0 0 1 p < 0 . 0 0 1 Cephalopod 8.2 ±2.5 2.9 ± 0 .4 4.2 ± 0.7 1.3 ± 0.2 U = -3.99 U = 5.66 U = 8.01 (1,35) (1,23) (1,35) (1,5) p < 0 . 0 0 1 p < 0 . 0 0 1 p < 0 . 0 0 1 N. Smoothtongue 1.3 ±0.3 7.4 ± 1.6 6.8 ± 1.5 2.0 ± 0.0 U = 2.60 X T /A X T /A 0 , 2 ) (1,53) (1,53) (2, 2) p = 0.009 I N / A I N / A Pollock 3.3 ± 0 .6 1.6 ± 0.3 2.2 ± 0.3 1.6 ±0.2 U =-4.56 U =-0.98 U = 1.30 (1,11) (1, 12) (1, 12) 0 , 5 ) p < 0 . 0 0 1 p = 0.328 p = 0.195 Salmon 1.0 ± 0 .0 1.1 ±0.1 1.1 ±0.1 1.2 ±0.1 U = 1.88 U =-2.29 U = -2.45 (1,1) (1,3) 0 , 3 ) (1,3) p = 0.060 p = 0.022 p = 0.014 K> -j
(U = -4.56, p < 0.001) consumed were significantly higher in spews than in scats. Scats
A
contained a significantly higher number o f northern smoothtongue than spews (U = 2.60,
A
p = 0.009). There was no difference in salmon M N I between scats and spews (U = 1.88,/? = 0.060). Atka mackerel was the prey type found in 71.4% o f scats from non-breeding NFS that contained only one species, while scats from breeding NFS that contained only one prey type were more likely to contain salmon (40.7%) than any other taxon.
In samples from breeding NFS, the occurrence o f A tka mackerel was significantly negatively correlated with the occurrence o f cephalopods (r = -0.23, to.os(3),i24 = -2.58, p =
0.010; Figure 4) and salmon (r = -0.26, to.o5(3),i24 = -2.94, p = 0.003), and positively
correlated with pollock {r = 0.24, to.os(3),i24 = 2.67, p = 0.008). In samples from non
breeding NFS, Atka mackerel was negatively correlated with pollock {r = -0.43, to.o5(3),ii8
= -5.02 , p < 0.001). Northern smoothtongue was positively correlated with cephalopods in samples from both breeding (r = 0.30, to.os(3),i24 = 3.38, p = 0.001) and non-breeding
NFS (r = 0.24, to.o5(3),i22 = 2.68,/? = 0.007).
Sea lion diet
O f the 271 scats collected from SSL, 247 (91.1%) contained prey remains that could be minimally identified to the family level. A total o f 14 different prey were identified with six to species. The most common prey items (Table 7), in order o f both frequency and abundance, were Atka mackerel {FO = 87.1%, NA = 71.8%), walleye pollock {FO = 19.6%, NA = 10.2%) salmon {FO — 19.2%, NA = 7.8%), and cephalopods
29
Breeding Sea Lio ns Breeding Fur Seals Non-Breeding Fur Seals
Walleye pollock Atka mackerel Northern smoothtongue Cephalopods Salmon Northern smoothtongue Cephalopods Salmon Atka mackerel Walleye pollock i---1--- 1---1--- 1 2.0 1.5 1.0 0.5 0.0 I 1.5 I 0.5 l 0.0 1.5 —I--- i---1 1.0 0.5 0.0
Distance between clusters 1.0
Figure 4. Clustering dendrograms of prey groups found in Steller sea lion and northern fur seal scats collected on Lovushki Island, Russia, during the breeding seasons o f 2003, 2005, 2007, and 2008.
Table 7. Minimum number o f individual prey items consumed (MNI), percent numerical abundance (NA), and percent frequency o f occurrence (FO) o f prey taxa found in scats and spews from breeding Steller sea lions collected on Lovushki Island during the breeding seasons o f 2003, 2005, 2007,
and^ZOOS^he^ofcdnumbeijtfsamgles^collect^ Prey Type (n MNI 2003 =32/32) NA FO (n MNI 2005 = 53/53) NA FO (n MNI 2007 = 111/111) NA FO (n MNI 2008 = 75/75) NA FO (n MNI Total =271/271) NA FO Fish 73 98.6 100.0 170 97.1 100.0 308 98.1 100.0 216 91.9 100.0 767 96.4 99.6 Unidentified fish 4 5.4 12.5 2 1.1 3.8 8 2.5 7.2 8 3.4 10.8 22 2.8 8.1 Hexagrammidae 57 77.0 84.4 118 67.8 77.4 245 78.0 91.0 154 65.5 90.5 574 72.1 87.1 A tka mackerel 56 75.7 84.4 118 67.8 77.4 244 77.7 91.0 154 65.5 90.5 572 71.9 87.1 G reenling sp. 1 1.4 3.1 1 0.3 0.9 2 0.3 0.7 Gadidae 5 6.8 12.5 18 10.3 26.4 24 7.6 13.5 42 17.9 32.4 89 11.3 21.0 U nidentified gadid 1 0.4 1.4 1 0.1 0.4 W alleye pollock 3 4.1 9.4 16 9.2 24.5 24 7.6 13.5 38 16.2 29.7 81 10.2 19.6 Pacific cod 2 2.7 3.1 2 1.1 3.8 4 1.7 5.4 8 1.0 2.6 Salmon 5 6.8 15.6 29 16.7 41.5 24 7.6 18.9 4 1.7 5.4 62 7.8 19.2 N. sm oothtongue 2 0.9 1.4 2 0.3 0.4
Other fish species 2 2.7 3.1 3 1.7 5.7 7 2.2 5.4 7 3.0 9.5 19 2.4 6.3
Antlered sculpin 1 0.3 0.9 1 0.1 0.4 Sculpin sp. 1 0.4 1.4 1 0.1 0.4 Herring 1 1.4 3.1 1 0.1 Irish lord sp. 1 0.6 1.9 1 0.3 0.9 1 0.4 1.4 3 0.4 1.1 Flatfish sp. 1 1.4 3.1 2 0.9 2.7 3 0.4 1.1 N. Lampfish 1 0.6 1.9 2 0.9 2.7 3 0.4 1.1 Lampfish sp. 1 0.3 0.9 1 0.1 0.4 Prickleback sp. 1 0.6 1.9 1 0.3 0.9 1 0.4 1.4 3 0.4 1.1 Sand lance 1 0.3 0.9 1 0.1 0.4 Snailfish sp. 2 0.6 1.8 2 0.3 0.7 Cephalopods 1 1.4 3.1 5 2.9 9.4 6 1.9 5.4 17 7.2 14.9 29 3.6 8.5 U nidentified ceph. 4 2.3 7.5 2 0.6 1.8 4 1.7 5.4 10 1.3 3.7 Squid sp. 1 1.4 3.1 1 0.6 1.9 4 1.3 3.6 12 5.1 9.5 18 2.3 4.8 Octopus sp. 1 0.4 1.4 1 0.1 0.4 Other Prey* 1 3.1 3 3.8 5 2.7 9 2.2 Bird sp. 1 0.9 1 0.4 Polychaete worm 1 3.1 3 3.8 4 1.8 8 1.8
* Polychaete worms and birds were considered to be secondary or incidental prey items and therefore not included in the calculations o f percent numerical abundance.
31
{FO = 8.5%, NA = 3.8%). The primary squid species consumed was Gonatopsis sp. cf. G. borealis.
Scats from SSL contained a mean o f 1.6 ± 0.06 prey species and 3.1 ± 0.14
individual prey items. Over h alf (57.7%) o f the scats contained only 1 prey species and of these, 94.1% contained Atka mackerel. The majority o f scats (89.4%) contained < 5 individual prey items. The occurrence o f Atka mackerel was significantly negatively correlated with the occurrence o f pollock (r = -0.29, to.os(3),256 - -4.86, p < 0.001; Figure
4), salmon (r = -0.30, to.o5(3), 2S6 = -5.06, p < 0.001) and northern smoothtongue {r = -0.56, to.os(3), 256 = -10.66, p < 0.001). Northern smoothtongue was significantly correlated with
pollock (r = 0.21, to.os(3), 256 = 3.40,p = 0.001) and salmon (r = 0.18, to.o5(3), 256 = 2.87, p =
0.004).
Niche overlap and diet diversity
SSL consumed significantly more Atka mackerel than both breeding (% = 94.91, p < 0.001) and non-breeding {% = 7.53, p = 0.006) NFS. Breeding NFS consumed
7 7
significantly more cephalopods {% = 55.94, p < 0.001), northern smoothtongue (x = 22.02, p < 0.001), and salmon (x2 = 34.07,/? < 0.001) than SSL. Non-breeding NFS
2 2
consumed significantly more smoothtongue (x = 7.49,/? = 0.006) and salmon (x = 7.89, p = 0.005) than SSL (Table 4).
Pianka’s niche overlap index for breeding and non-breeding fur seals based on scats and spews combined was 0.468. Based on N AS and NA*, breeding and non-breeding
NFS had a niche overlap index o f 0.385 and 0.359, respectively. The niche overlap index was 0.230 for SSL and breeding NFS based on scats alone and 0.947 for SSL and non breeding NFS. These two overlap index values were significantly different (p < 0.05). All overlap indices differed only slightly when based on NA instead o f NA* (Table 8).
The sizes o f prey items occurring in >5% o f scats did not differ between SSL and non-•y
breeding NFS when only scats were considered (Atka mackerel: x =4.47, p = 0.502; pollock: x2 =1.12,/? = 0.812; salmon: x2 =3.60,/? = 0.152). The sizes o f Atka mackerel consumed by SSL and non-breeding NFS were significantly different when both scats and spews were considered (x2 = 11.77,/? = 0.035), with SSL consuming a higher
proportion o f small (16-20 cm) Atka mackerel (x2 = 6.46,/? = 0.011) and NFS consuming •y
a higher proportion o f medium-large (29-35 cm) Atka mackerel (x = 5.86,/? = 0.015).
2 2
There were no differences in sizes o f salmon (x =3.23,/? = 0.219) or pollock (x = 2.54,/? = 0.519) consumed when both scats and spews were considered (Figure 5).
Shannon’s diet diversity index for breeding and non-breeding NFS, based on scats and spews, was 1.321 and 1.378 respectively. Overall, NFS had a diet diversity index o f 3.085 based on scats and spews. Based on scats alone, breeding and non-breeding NFS had a diet diversity index o f 1.296 and 1.341, respectively. The overall diet diversity index for NFS based on scats alone was 3.389. SSL had a diet diversity index o f 0.794, which was significantly different from both the breeding and non-breeding NFS diet diversity indices (Table 9).
33
Table 8. Summary o f Pianka’s niche overlap indices calculated using three different measures o f numerical abundance for breeding (B) and non-breeding (NB) northern fur seals (NFS) and Steller sea lions (SSL).
Niche overlap index (Ojk)
(95% Cl)
Groups (/, h)__________NA___________NAS__________ NA*
SSL, NFS 0.539 0.539 0.520 (0.324, 0.650) (0.324, 0.650) (0.324, 0.696) SSL, NFS-B 0.218 0.227 0.230 (0.124, 0.305) (0.107, 0.330) (0.086, 0.352) SSL, NFS-NB 0.831 0.937 0.947 (0.710,0.974) (0.877, 1.000) (0.896, 1.000) NFS-B, NFS-NB 0.468 0.385 0.359 (0.287, 0.673) (0.228, 0.529) (0.293, 0.679)
P e rc e n t co n s u m e d 34 Atka mackerel
Scat and spews
Small (8-15) (16-20) Small Large (3640) (21-28) (29-35) Large (41-50) Atka m ackerel Scats only Small (8-15) (16-20) Small Large (3640) (21-28) (29-35) Large (41-50) W alleye pollock
Scat and spews
Large (30-34) Very Large (35-54) Salm on
Scat and spews
Medium-Sm all Medium-Large (3 0 4 0 ) (>40)
Size Class (range, cm)
Figure S. Sizes o f prey items consumed by non-breeding northern fur seals (black) and breeding Steller sea lions (grey) during the breeding seasons of 2003, 2005, 2007, and 2008. Asterisks (*) indicates a significant difference.
35
Table 9. Summary o f Shannon's index o f diversity calculated for breeding (B) and non-breeding (NB) Steller sea lions (SSL) and northern fur seals (NFS) using numerical abundance of prey remains calculated Jromjilljjamgles^^NA^jindfrom jscatsam glesm
Diet diversity (H) (95% Cl) G roup NA NAS SSL 0.794 0.794 (0.698, 0898) (0.698, 0898) NFS 3.085 3.389 (2.310, 5.000) (2.333, 5.000) NFS-B 1.321 1.296 (1.255, 1.434) (1.213, 1.432) NFS-NB 1.378 1.341 (1.277, 1.542) (1.200, 1.527)
36
D ISC U SSIO N
Intersp ecific competition
This study found significant differences between the diets o f breeding NFS and SSL such that breeding SSL consumed primarily Atka mackerel, while breeding NFS consumed prim arily northern smoothtongue and cephalopods. This difference in prey selection between NFS and SSL is likely reflective o f the different diving abilities and provisioning strategies o f the two species, as well as the fasting abilities o f their dependent young (Costa et al. 2005).
Larger diving animals have greater oxygen stores and lower mass-specific rates o f oxygen consumption, and therefore make longer and deeper dives than smaller divers. A model by Mori (2002) predicts that, to forage optimally, smaller divers should seek prey at shallower depths. Additionally, small pinnipeds are adapted to exploiting locally abundant and predictable sources o f prey while larger pinnipeds are more adapted to exploiting more dispersed prey (Costa 1993). Thus, NFS that prey on abundant prey species such as cephalopods and northern smoothtongue that aggregate in large numbers near the surface at night may be optimizing their foraging strategy, leaving non-schooling prey items that occur at deeper depths, such as Atka mackerel, to the larger SSL.
To maximize their fitness, central place foragers must maximize their energy intake while minimizing their energy expenditure in order to deliver the maximum amount o f nutrients and energy to their dependent pups (Pyke et al. 1977). However,