Adaptive Algorithms for Real-World
Transactional Data Mining
Edward Tersoo Apeh
A thesis submitted in partial fulfillment of the requirements of Bournemouth University for the degree of Doctor of Philosophy
October 2012
Copyright Statement
This copy of the thesis has been supplied on condition that anyone who consults it is understood to recognise that its copyright rests with its author and due acknowledgement must always be made of the use of any material contained in, or derived from, this thesis.
Abstract
The accurate identification of the right customer to target with the right product at the right time, through the right channel, to satisfy the customer’s evolving needs, is a key performance driver and enhancer for businesses. Data mining is an analytic process designed to explore usually large amounts of data (typically business or market related) in search of consistent patterns and/or systematic relationships between variables for the purpose of generating explanatory/predictive data models from the detected patterns. It provides an effective and established mechanism for accurate identification and classifica-tion of customers. Data models derived from the data mining process can aid in effectively recognizing the status and preference of customers - individually and as a group. Such data models can be incorporated into the business market segmentation, customer tar-geting and channelling decisions with the goal of maximizing the total customer lifetime profit. However, due to costs, privacy and/or data protection reasons, the customer data available for data mining is often restricted to verified and validated data, (in most cases, only the business owned transactional data is available). Transactional data is a valu-able resource for generating such data models. Transactional data can be electronically collected and readily made available for data mining in large quantity at minimum extra cost. Transactional data is however, inherently sparse and skewed. These inherent charac-teristics of transactional data give rise to the poor performance of data models built using customer data based on transactional data. Data models for identifying, describing, and classifying customers, constructed using evolving transactional data thus need to effec-tively handle the inherent sparseness and skewness of evolving transactional data in order to be efficient and accurate. Using real-world transactional data, this thesis presents the findings and results from the investigation of data mining algorithms for analysing, de-scribing, identifying and classifying customers with evolving needs. In particular, methods for handling the issues of scalability, uncertainty and adaptation whilst mining evolving transactional data are analysed and presented. A novel application of a new framework for integrating transactional data binning and classification techniques is presented alongside an effective prototype selection algorithm for efficient transactional data model building. A new change mining architecture for monitoring, detecting and visualizing the change in customer behaviour using transactional data is proposed and discussed as an effec-tive means for analysing and understanding the change in customer buying behaviour over time. Finally, the challenging problem of discerning between the change in the cus-tomer profile (which may necessitate the effective change of the cuscus-tomer’s label) and the change in performance of the model(s) (which may necessitate changing or adapting the model(s)) is introduced and discussed by way of a novel flexible and efficient architecture for classifier model adaptation and customer profiles class relabeling.
Contents
Contents ii
List of Figures vi
List of Tables x
1 Introduction 1
1.1 Thesis Goal and Scope . . . 2
1.2 Summary of Contributions . . . 3
1.3 List of Publications . . . 3
1.4 Roadmap . . . 4
2 Background Knowledge and Research Challenges 6 2.1 Overview of Data Mining . . . 7
2.1.1 Stages of the Data Mining Process . . . 7
2.1.2 Data Mining Tasks . . . 11
2.1.3 Data Mining Tasks covered in this Thesis . . . 14
2.2 The Problem of Mining Transactional Data . . . 14
2.2.1 Issues Encountered when Mining Transactional Data . . . 16
2.2.2 Scalability . . . 17
2.2.3 Uncertainty . . . 20
2.2.4 Adaptation . . . 22
2.3 Summary . . . 26
3 Transactional Data Description and Preprocessing 27 3.1 Description of Screwfix’s Transactional Database . . . 28
3.1.1 Description of Screwfix’s Customers and Trade-types . . . 29
3.1.2 Description of Products . . . 32
3.2 Exploration of Screwfix’s Customer Transactional Data using Clustering Algorithms . . . 35
3.2.1 Hierarchical Clustering of Screwfix Transactional Data . . . 35
3.2.2 K-means Clustering of Screwfix Transactional Database . . . 40
3.3 Effect of Conventional Sampling Data Mining Algorithms’ Predictability . 41 3.4 Summary of Exploratory Analysis and Conclusion . . . 50
4 Customer Profile Classification 53 4.1 Overview of Customer Profile . . . 53
4.1.1 Customer Profile Construction Methods . . . 54
4.2.1 Problem Statement . . . 55
4.3 Background Knowledge and Related Work . . . 56
4.4 Customer Profile Classification using Transactional Data . . . 57
4.4.1 Overview of Data Binning . . . 58
4.4.2 The K-means Algorithm as a Prototype Selection Tool . . . 60
4.4.3 Solution for Multi-class classification . . . 62
4.5 Two-Class Classification Experiments and Analysis of Results . . . 62
4.5.1 Bin Evaluation using the AUC score . . . 64
4.5.2 Discussion of Experiment Results . . . 64
4.6 Multi-class Classification Experiments and Analysis of Results . . . 68
4.6.1 Experiment Methodology and Results . . . 68
4.6.2 Discussion of Results . . . 71
4.7 Summary and Conclusion . . . 73
5 Change Mining of Customer Profile Classifications 75 5.1 Background Overview of Change Mining and Related Work . . . 76
5.2 Proposed Approach for Change Mining of Transactional Data . . . 78
5.2.1 Change Mining System . . . 79
5.2.2 Training Phase . . . 79
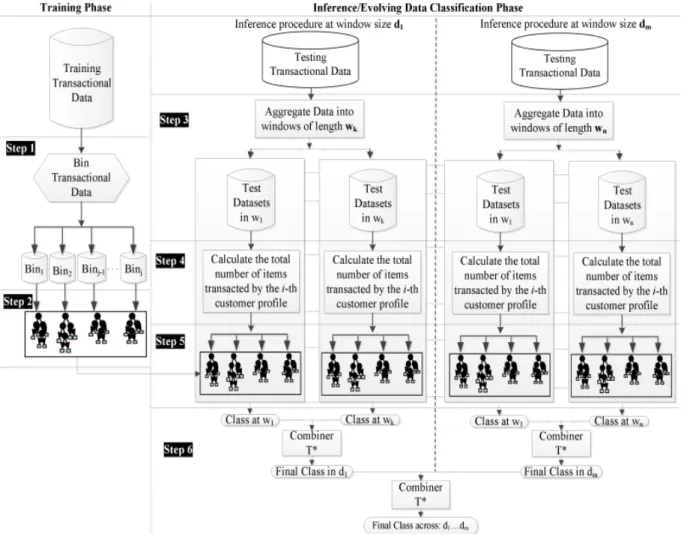
5.2.3 Inference/Evolving Data Classification Phase . . . 81
5.2.4 Measurement of Classifier Stability Over Time . . . 84
5.3 Experimental Evaluation . . . 85
5.3.1 Objective of Experiments . . . 85
5.3.2 Experimental approach and Analysis of Results . . . 85
5.4 Summary and Conclusion . . . 92
6 Customer Profile Classification: To Adapt Classifiers or To Relabel Cus-tomer Profiles? 93 6.1 Concept Drift and Customer Profile Class Switching Problem. . . 94
6.2 Adaptive Customer Profile Classification . . . 95
6.2.1 Overview of Adaptive Systems . . . 96
6.2.2 Related Work . . . 99
6.3 Relabeling as a Solution to the Customer Profile Class Switching Problem 99 6.4 Proposed Classifier Model Adaptation and Relabeling for Customer Profile Classification . . . 100
6.4.1 Pre-processing Training Data Phase . . . 100
6.4.2 Inference/Evolving Data Classification Phase . . . 100
6.5 Experiment Setting, Results and Evaluation . . . 102
6.5.1 Effect of Window Length on Classification Accuracy . . . 103
6.5.2 Stability of Customer Profile Classification Over Time . . . 103
6.5.3 Effects of Combiners on the Customer Profile Classification Over Time . . . 106
6.6 Conclusion . . . 106
7 Thesis Summary, Conclusion and Proposed Direction for Future Work.110 7.1 Summary and Conclusion . . . 110
7.2 Suggestions for Future Research . . . 112 7.2.1 Relational Data Mining as an alternative to Attribute-Value Data
7.2.2 Proposed Application of Relational Data Mining Approach to Clus-tering Transactional Data . . . 114 7.2.3 Proposed Future Research on Sampling and Search Strategies for
Handling Scalability and Reducing Uncertainty . . . 115 7.2.4 Proposed Research of Adaptive Mechanism(s) for Transactional Data117 7.2.5 Design and implement user-friendly interfaces of advanced
mod-elling software for non-expert users . . . 117
Appendices 119
A
Figures showing the discrepancies between the trade-type
information provided and the verified trade-type.
120B
Figures showing the proportion of items transacted by the
verified trade-type.
124C
Tables detailing the numerical composition of the
discrepan-cies between categorized and verified Electrician and
Plumb-Heat Trade-types
126D
Figures showing the distributions of classess uniformly
sam-pled from Screwfix’s 2007 and 2008 transactional data.
134E
Tables of Screwfix’s Transactional Data Attributes
138F
Classification of Sampled Screwfix’s Data Experiments
Mat-lab Code
143F.1 Classification: Cross-Validation Experiment Code . . . 143
G
SLIGRO Categories Data Description Table
145H
Figures Showing the Distribution of the Top 10 Products
Transacted by the Electricians and PlumbHeaters in the
Training and Test Datasets in the 3, 6, 9 and 12 Months
Sliding Windows.
147I
Figures Showing Comparative Performance of Adaptation
Strategies on Ensembles of Decision Trees (J48), Naive Bayes,
Linear Regression and Support Vector Machines for the 3,
6, 9 and 12 Months Sliding Windows.
150J
Figures Showing Comparative Customer Profile
Classifica-tion Stability for the Decision Trees (J48), Naive Bayes,
Linear Regression and Support Vector Machines for the 3,
6, 9 and 12 Months Sliding Windows.
153K
Tables Illustrating the Changing Classifications of an
Elec-trician and a PlumberHeater by Decision Trees (J48), Naive
Bayes, and Support Vector Machines for the 3, 6, 9 and 12
L
Figures Illustrating the Changing Stability of Two
Electri-cians and Two PlumberHeaters obtained from using the
ma-jority, weighted mama-jority, weighted average majority and
minority voting combiners for Decision Trees (J48), Naive
Bayes, and Support Vector Machines in the 3, 6, 9 and 12
Months Sliding Windows.
162List of Figures
1.1 Graphical Representation of the Thesis Structure . . . 5 2.1 A Visual Guide to CRISP-DM Methodology [CRISP-DM.org and Leaper,
2009] . . . 10 2.2 Plot depicting the distribution of items per transaction (Basket size) of a
typical transactional dataset sourced from Screwfix Limited . . . 15 2.3 Plot showing the projection of the first two principal components of
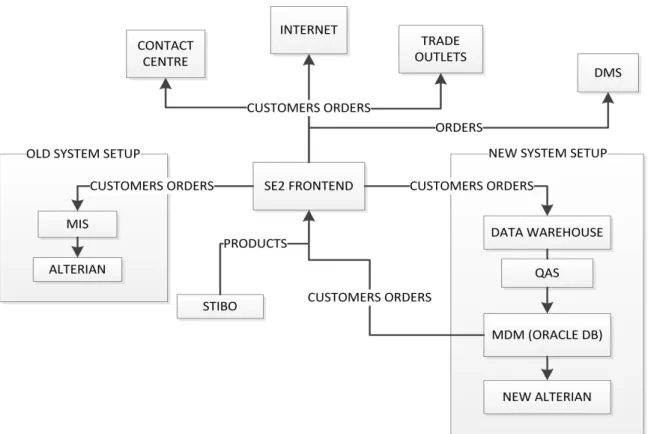
Cus-tomer Profiles based on the transactional data of Screwfix’s Electricians and PlumbHeaters. . . 16 2.4 One-to-Many Customers Purchases . . . 18 2.5 Model Management Cross Section of CRISP-DM . . . 24 3.1 Screwfix’s Systems Architecture framework, showing the old and new
sys-tems set-up . . . 29 3.2 Total number of the customers categorized into Trade-Types that made at
least one (1) order during the period between the 1st quarter of 2007 and the 2nd quarter of 2009 . . . 30 3.3 Total number of the Customers whose Trade-Types were verified with a
third-party . . . 31 3.4 View of Screwfix’s Defined Product Items. ∗The reduced set of
transac-tions is obtained by aggregating the total individual transactransac-tions made per customer in the full set of transactions. . . 32 3.5 Plot showing transaction patterns of the Topics (normalized by scaling the
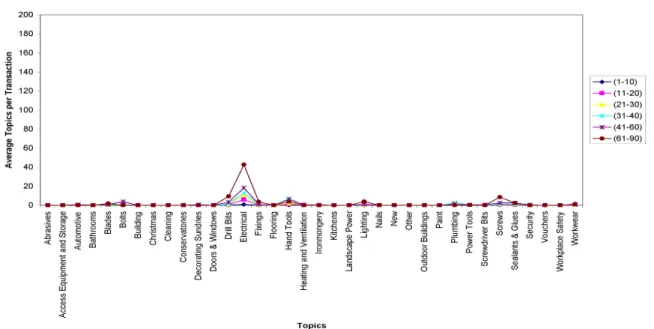
aggregated total number of item topic bought in the range [0.0, 1.0]) for the unverified customer trade-types. . . 33 3.6 Plot showing the average Topics transacted per transaction for the
unveri-fied customers’ trade-types. . . 33 3.7 Plot showing the average Topics transacted per transactions by the verified
Electrician trade-type. . . 34 3.8 Plot showing the average Topics transacted per transactions by the verified
PlumbHeat trade-type. . . 34 3.9 Plot showing the positive skewness of topics transacted by the verified
Electrician . . . 35 3.10 Plot showing the positive skewness of topics transacted by the verified
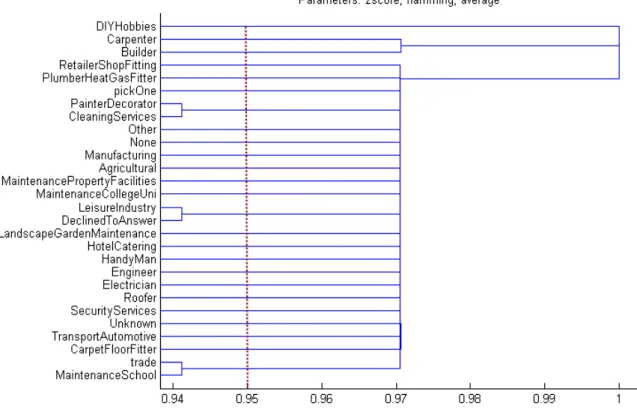
PlumbHeat trade-type . . . 36 3.11 Best Dendrogram (with a cophenetic correlation coefficient of 1) of the
3.12 This figure, shows the plot of the standardized fusion levels. The ’elbow’ in the curves indicates that no less than 3 clusters are reasonable for grouping the Trade-types. . . 38 3.13 The dendrogram shows the results of Topics purchased together by the
Trade-types obtained using Spearman distance and centroid linkage on the Topics transactional data for 2007. . . 38 3.14 This figure, shows the plot of the Topics standardized fusion levels. The
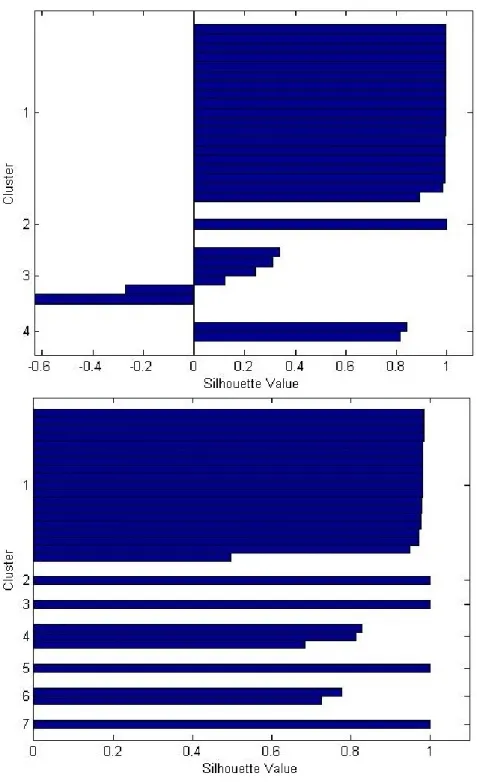
’elbow’ in the curves indicates that four clusters is reasonable for the topics transactions data. However, the other ’elbows’ at 8 might provide interest-ing clusters, too. . . 39 3.15 The silhouette plots for k = 4 and k = 7 clusters for the Trade-types in
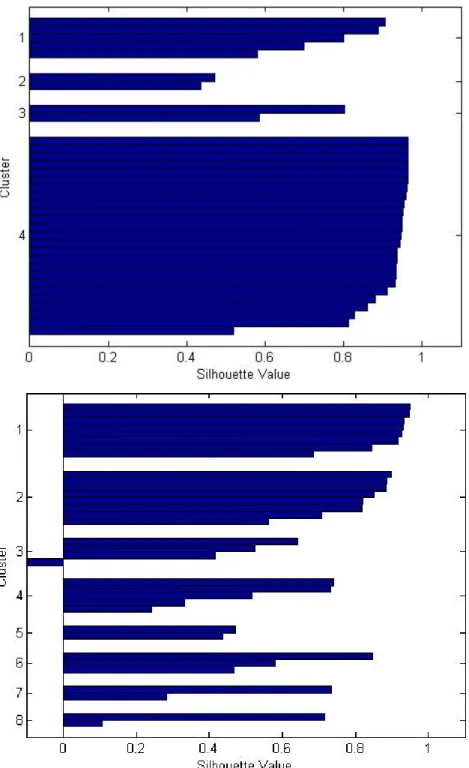
Screwfix’s transactional data. . . 42 3.16 The silhouette plots for k = 4 and k = 8 clusters for the Topics in Screwfix’s
transactional data. . . 43 3.17 Plots showing the three (3) trade-type clusters found by K-means and
hi-erarchical clustering techniques. . . 44 3.18 Plots showing the results obtained from clustering the absolute values of
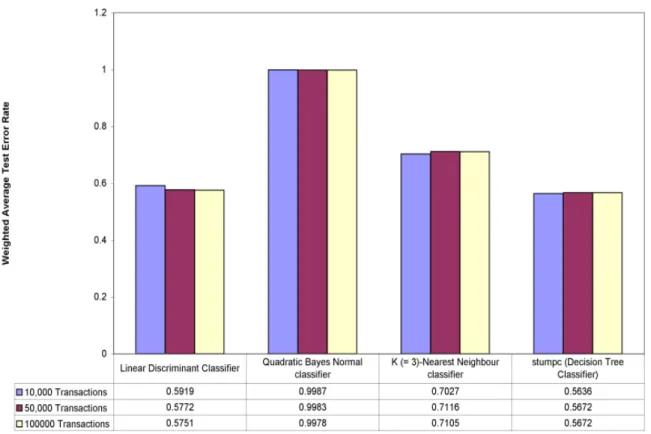
transactional data as well as those obtained from applying the Min-Max normalization method on the individual customer profile transactions (row-wise), on the items transacted (column-(row-wise), and on the entire transac-tional data. It can be seen that due to the sparseness of the transactions per customer normalization has little effect on separability as would otherwise be expected from the clustering process. . . 47 3.19 Plots showing the performance of ldc, qdc, 3-Nearest Neighbour and
Deci-sion Tree Classifiers on Sampled Screwfix’s Transactional Data . . . 49 4.1 Stacked Bar graphs showing the contribution of the individual items topics’
to the total number of items topics transacted over the 30 months period. . 65 4.2 Plots showing the two-class 10 fold cross-validation classification
perfor-mance of Decision Tree, Naive Bayes, Linear Discriminant, and Support Vector Machine on the selected SLIGRO prototypes of customer profiles based on transactional data. . . 67 4.3 Plot showing the distribution of Items per Transaction (Basket size) of
SLIGRO’s Transactional Dataset . . . 69 4.4 Plots showing the Mean, Standard Deviation, and Maximum number of
items purchased in a Transaction. . . 70 4.5 Plots showing the comparative multi-class classification performance of
De-cision Tree, Naive Bayes, Logistic Regression, and Support Vector Machine on the selected SLIGRO prototypes of customer profiles based on transac-tional data. . . 72 5.1 Architecture for change mining a classifier ensemble over time. The
high-lighted steps are described in Sections 5.2.2 and 5.2.3 . . . 80 5.2 Plots showing the prediction stability of the Decision Tree Ensemble models
within the 3, 6, 9 and 12 months sliding windows. . . 88 5.3 Plots showing the distribution of prediction stability over time for the
mi-6.1 Framework of a typical adaptive system . . . 96 6.2 Architecture for adapting classifier models and relabeling misclassified
cus-tomer profiles. The highlighted steps are described in Section 6.4. . . 102 A.1 Pie of Pie Chart showing the discrepancies in the number of Customers
who were categorized as “Electrician” and were verified to be “Electrician” (63%); and those made by Customers who were categorized as belonging to one of the other 11 trade-types and were verified to be “Electrician” (34%).121 A.2 Pie of Pie Chart showing the discrepancies in the number of Customers
who were categorized asPlumbHeatand were verified to be under Plumb-Heat (64.3%); those made by Customers who were categorized as belong-ing to one of the other 11 trade-types and were verified to bePlumbHeat
(35.7%) . . . 121 A.3 Pie of Pie Chart showing the discrepancies in the Orders made by the
Customers who were categorized as “Electrician” and were verified to be “Electrician” (61.5%); and those made by Customers who were categorized as belonging to one of the other 11 trade-types and were verified to be “Electrician” (38.5%). . . 122 A.4 Plot showing the discrepancies between Customers who were categorized
as Electrician and were verified to be Electrician; and those who were categorized as belonging to one of the other 11 trade-types and were verified to be Electrician; segmented in terms of the number of items they bought. 122 A.5 Plot showing the discrepancies between Customers who were categorized
under PlumbHeatand were verified to be underPlumbHeat; and those who were categorized as belonging to one of the other 11 trade-types and were varified to be PlumbHeat; segmented in terms of the number of items they bought. . . 123 A.6 Pie of Pie Chart showing the discrepancies in the Orders made by the
Customers who were categorized asPlumbHeatand were verified to be under PlumbHeat (71.4%); those made by Customers who were catego-rized as belonging to one of the other 11 trade-types and were verified to be PlumbHeat (28.6%) . . . 123 B.1 Plots showing the proportions of topics transacted by the verified
Plumb-Heat trade-types . . . 124 B.2 Plots showing the proportions of topics transacted by the verified
Electri-cian trade-types . . . 125 D.1 Distribution of Classes of the Sampled 10000 Screwfix’s Transactions for
2007 . . . 135 D.2 Distribution of Classes of the Sampled 50000 Screwfix’s Transactions for
2007 . . . 135 D.3 Distribution of Classes of the Sampled 100000 Screwfix’s Transactions for
2007 . . . 136 D.4 Distribution of Classes of the Sampled 10000 Screwfix’s Transactions for
2008 . . . 136 D.5 Distribution of Classes of the Sampled 50000 Screwfix’s Transactions for
D.6 Distribution of Classes of the Sampled 100000 Screwfix’s Transactions for 2008 . . . 137 H.1 Plots showing the Top 10 Products Transacted in Training Datasets by the
Electricians and the PlumbHeaters in the 3, 6, 9 and 12 Months Sliding Windows. . . 148 H.2 Plots showing the Top 10 Products Transacted in Test Datasets by the
Electricians and the PlumbHeaters in the 3, 6, 9 and 12 Months Sliding Windows. . . 149 I.1 Plots showing the Comparative Performance of Decision Trees, Naive Bayes,
Linear Regression and Support Vector Machines classifiers in the Three (3) Months Sliding Windows. . . 150 I.2 Plots showing the Comparative Performance of Decision Trees, Naive Bayes,
Linear Regression and Support Vector Machines classifiers in the Six (6) Months Sliding Windows. . . 151 I.3 Plots showing the Comparative Performance of Decision Trees, Naive Bayes,
Linear Regression and Support Vector Machines classifiers in the Nine (9) Months Sliding Windows. . . 151 I.4 Plots showing the Comparative Performance of Decision Trees, Naive Bayes,
Linear Regression and Support Vector Machines classifiers in the Twelve (12) Months Sliding Windows. . . 152 J.1 Plots showing the comparative customer profiles classifications stability for
the Decision Trees, Naive Bayes, Linear Regression and Support Vector Machines classifiers in the Three (3) Months Sliding Windows. . . 154 J.2 Plots showing the comparative customer profiles classifications stability for
the Decision Trees, Naive Bayes, Linear Regression and Support Vector Machines classifiers in the Three (3) Months Sliding Windows. . . 155 J.3 Plots showing the comparative customer profiles classifications stability for
the Decision Trees, Naive Bayes, Linear Regression and Support Vector Machines classifiers in the Three (3) Months Sliding Windows. . . 156 J.4 Plots showing the comparative stability of customer profiles classifications
for the Decision Trees, Naive Bayes, Linear Regression and Support Vector Machines classifiers in the Twelve (3) Months Sliding Windows. . . 157 L.1 Plots showing the stability of customer profiles classifications using the
majority voting combiner for the Decision Trees, Naive Bayes, Linear Re-gression and Support Vector Machines Ensembles. . . 163 L.2 Plots showing the stability of customer profiles classifications using the
weighted majority voting combiner for the Decision Trees, Naive Bayes, Linear Regression and Support Vector Machines Ensembles. . . 164 L.3 Plots showing the stability of customer profiles classifications using the
weighted average voting combiner for the Decision Trees, Naive Bayes, Lin-ear Regression and Support Vector Machines Ensembles. . . 165 L.4 Plots showing the stability of customer profiles classifications using the
Minority Voting Combiner for the Decision Trees, Naive Bayes, Linear Re-gression and Support Vector Machines Ensembles. . . 166
List of Tables
2.1 Example of a Table of Customer Transactions . . . 18
2.2 Example of a Table of Customer-Details Transactions . . . 19
3.1 Screwfix’s Trade-Types . . . 30
3.2 Verified Trade-Types and their Professional Bodies . . . 30
3.3 Description of 9 Clusters of Topics from Hierarchical Clustering. . . 39
3.4 K-means and Hierarchical Clustering Techniques’ Cluster Groupings of Screwfix’s Trade-Types . . . 45
3.5 Screwfix’s Topics K-means and Hierarchical Clustering Techniques Cluster Groupings . . . 46
4.1 Customer Profile Data . . . 63
66table.caption.51 4.3 Baseline Classification Performance on Randomly Sampled Customer Profiles 68 4.4 Identified Data Bins in SLIGRO’s Transactional Data. . . 69
4.5 Number of Selected Prototype per Category per Identified Data Bins in SLIGRO’s Transactional Data. . . 71
4.6 Top 10 Product Code Purchased by Category Code 100 (Supermart/rij-dende winkel) per Identified Data Bins in SLIGRO’s Transactional Data. . 73
4.7 Top 10 Product Code Purchased by Category Code 310 (Cafetaria/shoar-ma/fastfood) per Identified Data Bins in SLIGRO’s Transactional Data. . 74
5.1 Customer Profile Data . . . 85
5.2 Identified Data Bins . . . 86
5.3 C4.5 Decision Tree Classification (10-fold Cross Validation) Performance on Identified Bin . . . 86
5.4 An example illustrating the Classifications of an Electrician and a Plumb-Heater over Time by the Decision Tree Ensemble outlined in Figure 5.1 . . 87
5.5 Individual Classifier Average Prediction Stability and Average Misclassifi-cation Rate Over Time . . . 88
5.6 Typical Examples of Prediction Stability Distribution Over Time . . . 89
5.7 An illustration of the typical data bin allocation and classification perfor-mance over time of the Decision Tree Ensemble outlined in Figure 5.1 on two Electricians and two PlumbHeaters. . . 90
5.8 Combiners’ Average Prediction Stability and Average Misclassification Rate Over Time . . . 91
6.2 Comparative Classification Performance of 4 Classifiers in 4 Sliding Time
Window Sizes . . . 104
6.3 Comparative Customer Profiles Classifications Stability for the 4 Classifiers in the 4 Sliding Time Window Sizes . . . 105
6.4 Tables illustrating the comparative stability of an Electrician (E1) and a PlumbHeater(P1) customer profiles classifications by the Linear Regression Ensemble over time . . . 107
6.5 Comparative Customer Profiles Classifications Stability for Four (4) Com-biners . . . 108
C.1 Table showing the segmented numerical discrepancies between the catego-rized and verified Electrician trade-type . . . 126
C.2 Table showing the segmented numerical discrepancies between the catego-rized and verified PlumbHeat trade-type . . . 127
C.3 Number of Items by Topics Transacted Per Trade-Type . . . 128
C.4 Average ’Items by Topics’ Transacted Per Trade-Type . . . 129
C.5 Table showing the segmented numerical proportions of the Items by Topics transacted by the verified Electrician trade-type . . . 130
C.6 Table showing the segmented proportions (averaged by number of orders) of the Items by Topics transacted by the verified Electrician trade-type . . 131
C.7 Table showing the segmented proportions of the Items by Topics transacted by the verified PlumbHeat trade-type . . . 132
C.8 Table showing the segmented proportions (averaged by number of orders) of the Items by Topics transacted by the verified PlumbHeat trade-type . . 133
E.1 List of Trade-types Identified in Screwfix’s Transactional Database . . . 138
E.2 List of Screwfix’s Topics . . . 139
E.3 Number of Screwfix’s Topics Transacted in 2007 . . . 140
E.4 List of Screwfix’s Topics Transacted in 2008 . . . 141
E.5 Cross-section of Sampled Screwfix’s Transactional Data . . . 142
E.6 Cross-section of Computed Screwfix’s Electrician and PlumbHeat Profiles. 142 G.1 Number of Transactions and Number of Items Transacted by SLIGRO Cat-egories in the 3 Years Period . . . 145
K.1 Tables illustrating the comparative stability of the Electrician (E1) and PlumbHeater(P1) customer profiles classifications for the Decision Tree En-semble . . . 159
K.2 Tables illustrating the comparative stability of the Electrician (E1) and PlumbHeater(P1) customer profiles classifications for the Naive Bayes En-semble . . . 160
K.3 Tables illustrating the comparative stability of the Electrician (E1) and PlumbHeater(P1) customer profiles classifications for the Support Vector Machine Ensemble . . . 161
Acknowledgements
I wish to start by expressing my deep gratitude to God for the wonder of Computa-tional Intelligence that can inspire endless interest and a quest for knowledge discovery.
Formula 1, Football, And Basketball are Teams Sports - and so is
Undertaking a Ph.D. My aspiration to pursue this research would not have seen the
light of day without the valuable contributions of a number of supportive people, to whom I will always be grateful.
I am profoundly grateful for the guidance and support of my supervisor, Prof. Bogdan C. Gabrys. Bogdan’s insightful comments and timely professional and personal advice made my entire time at Bournemouth University an enthralling and enriching experience. I thank Bogdan for his support, for sharing his endless supply of ideas and feedback, and for his friendship. I could not have had a better advisor. Many thanks, Bogdan, for your tireless work and ceaseless encouragement. Thank you B!
I am also grateful to the remainder of my thesis committee: Prof. Trevor Martin of Bristol University, Dr. Amanda Schierz of the Institute of Cancer Research, Dr. Michael Barker of Screwfix Limited and Dr. Indr˙e ˇZliobaite of the INFER project at Bournemouth University. They were all generous with their time and provided me with useful insights and help with research and in preparing this thesis.
My gratitude also go to Kevin Loader, Rob Josling, and Paul Belshaw all of Screwfix Limited as well as Hugo Jaspers of Sligro Food Group N.V., for their time and for pro-viding me with their data and domain knowledge without which the key research findings of this thesis will not have been substantiated. I am particularly grateful to Dr. Mykola Pechenizkiy of Eindhoven University of Technology for liberality with his profound re-search insight and help in getting the permission to use SLIGRO’s data.
I must also extend my gratitude to my fellow researchers and the support staff at: the SMART Technology Research Centre, the school of Design, Engineering and Computing, and the entire Bournemouth University community, with whom I shared many coffee breaks, lunches around campus, laughs over the mundane issues of life, and many other ups and downs of being a Ph.D. researcher.
Lastly, but certainly not least, I must extended a great deal of love and appreciation to all my friends and family outside of the Bournemouth University community who have helped me along in my life. Special thanks are in order for my parents and siblings who always pushed me to achieve. To my late mother Caroline for recognizing and cultivating my interest and abilities in science and math at such an early age. To my father Joseph for providing an example of how hard work and patience can reap rewards. To my stepmother Magdalene for the continuous prayers, encouragement and support. Many thanks too to Sue Burt, Laurence and Gabrielle Hodge, Rob and Margaret Averill, Mike and Diane Reynolds, Steve and Mallin Ambore, and Jacqueline Msoma for their continuous support and friendship over the years.
Finally, I would like to thank Akin Sulaimon and Joyce Feese for being such great friends; and always having faith in my abilities and inspiring me to seek out my passions in work and life. Thank you all.
Declaration
The thesis is entirely my own work, and, except where otherwise stated, describes my own research.
Chapter 1
Introduction
Data mining algorithms have now gained prominence as core business profit enhancing tools, with enterprise database software systems now incorporating them as standard. A recent survey by Gartner [Herschel, 2008] and Forester Research [Kobielus, 2008] attribute the increased dependence and usage of data mining tools to businesses becoming more “information-driven”.
This is more so, given that we currently live in a world where information overload is a pertinent issue. Data mining algorithms have proven to be invaluable tools for discovering hidden/unknown patterns in data, for predictive or descriptive purposes. For instance, the discovered patterns can be used by a product retailer to answer questions like “Who is likely to buy a certain product in the next six months?”; “What are the characteristics of these likely buyers?”
In order to adequately utilize the discovered patterns and respond to changing market forces or market growth, businesses tend to constantly change their processes with a resultant deterioration of the data mining models performance due to their becoming obsolete as soon as the business process they model changes.
To discover the hidden/unknown patterns, data mining algorithms employ statistical methods which operate on the data to produce statistical conclusions for specific patterns in the data. Huge transactional datasets containing millions of training examples with a large number of attributes (tall fat data) are relatively easy to gather for such data mining purposes [Raykar, 2005].
However, the inherent sparseness of transactional datasets and its constant chang-ing nature makes the data minchang-ing process challengchang-ing; even more so for data minchang-ing algorithms which do not make any assumptions on the constantly changing form of the underlying function generating the data.
This seriously restricts the use of these data mining algorithms in the context of mining transactional datasets.
Interfacing the data mining algorithms with transactional databases as an integral part of an organization’s data management plan is also made difficult as workarounds are
often required to deal with the issue of sparse transactional datasets.
1.1
Thesis Goal and Scope
This thesis presents the analysis, design and implementation of data mining algorithms that discover hidden/unknown patterns in transactional data and generate models that are adaptive to the change and uncertainty inherent in transactional data.
It presents investigations on how data mining techniques have been and can be used for knowledge discovery in transactional data. It proposes approaches that will make it easier for organisations to apply data mining to transactional data sets.
In particular, using data from Screwfix - a leading UK retail outfit, and SLIGRO Food Group N.V. - a group of food-retail and food-service companies selling to the Dutch food and beverages market as case studies, this thesis describes the application of robust adap-tive data mining algorithms to real-world transactional datasets and the down-streaming of advanced modelling results to non-expert users.
Screwfix and Sligro have large quantities of customer and order data. The data is heavily sparse and in constant flux in that many of the customers purchase few items per transaction and constantly change their buying behaviour at different time points. For example, many Screwfix customers tend to buy different items depending on the job they are undertaking at a particular time, e.g. gardening in the spring and building in the summer.
The constantly changing buying behaviour of the customers complicates the process involved in identifying significant correlation between the different buying behaviour time points, making the analytical characterization of the customers challenging. Furthermore, sparseness and skewness of transactional data is compounded by the similarity of few items bought by the customers which makes predictability and distinction of the customers based on their buying behaviour challenging.
Data mining algorithms which can effectively handle the inherent sparseness and skew-ness of transactions to identify behaviour of customers over time, can thus be used to aid in the decision support process.
Screwfix and SLIGRO are examples of the type of data rich organisations that need to build data mining and analysis skills to be able to improve on how they use their data in their marketing and sales departments. Recent attempts by Screwfix and SLIGRO to analyse their transactional data have failed due to sparsity and the constantly changing nature of transactional data.
This thesis presents investigations of methods for adapting and changing data mining models as the nature of Screwfix and SLIGRO’s transactional data grows and changes. Adaptation helps to prolong the useful life of learned predictive/inference models which
1.2
Summary of Contributions
Concisely, the main contributions of this thesis are:
1. An in-depth critical analysis of the main research challenges of adaptivity, scala-bility and uncertainty encountered when mining real-world transactional data. In particular, the thesis details the problem of mining large transactional data and how sparsity and skewness results in uncertainty of inference from transactional data.
2. Clustering and sub-sampling are often chosen as the favoured data pre-processing approaches in data mining project. The thesis highlights the problem of transac-tional data pre-processing and shows the inappropriateness in mining transactransac-tional data using some of the clustering and sampling techniques proposed in the literature.
3. Investigations and implementations of adaptive algorithms for solving business prob-lems using real-world transactional data. In particular, the thesis presents the analy-sis, design, implementation and interpretation of results for classifying and detecting as well as adapting to customer behaviour using robust adaptive models generated from transactional data.
4. Methods for the down streaming of advanced models of real-world transactional data to non-expert users. More specifically, the thesis presents the results for detecting, visualizing and adapting to the change in buying behaviour to customer transactions over time using the real-world transactional data provided by Screwfix and SLIGRO.
1.3
List of Publications
The research undertaken has thus far resulted in the following publications:
• Edward Apeh, Bogdan Gabrys, Amanda Schierz, “Customer Profile Classification: To Adapt Classifiers or To Relabel Customer Profiles?”, Accepted for publication in the Special Issue: NaBIC2011 Neurocomputing Journal. Elsevier.
• Edward Apeh, Indr˙e ˇZliobaite, Mykola Pechenizkiy, Bogdan Gabrys, “Predicting Multi-Class Customer Profiles Based on Transactions: a Case Study in Food Sales”, in The Proceedings of AI-2012 Thirty-second SGAI International Conference on Artificial Intelligence (SGAI).
• Edward Apeh, Bogdan Gabrys, “Detecting and Visualizing the Change in Classifi-cation of Customer Profiles based on Transactional Data”, in the Special Issue of the Journal of Evolving Systems, October 2012.
• Edward Apeh, Bogdan Gabrys, “Change Mining of Customer Profiles based on Transactional Data”, in Proceedings of the 11th IEEE International Conference on Data Mining Workshops (ICDMW 2011). IEEE, December 2011
• Edward Apeh, Bogdan Gabrys, Amanda Schierz, “Customer Profile Classification Using Transactional Data”, in Proceedings of the Third World Congress on Nature and Biologically Inspired Computing (NaBIC2011). IEEE, October 2011
• Amanda Schierz, Marcin Budka, Edward Apeh, First and Second Winners’ notes: “Using Multi-Resolution Clustering for Music Genre Identification” in the ISMIS
2011 Contest: Music Information Retrieval.
• Edward Apeh, Bogdan Gabrys, Amanda Schierz, “Robust Adaptive Algorithms for Relational Data Mining”, in The Proceedings of the 3rd School of Design, Engineer-ing and ComputEngineer-ing Poster Conference, Bournemouth University, UK, May 2010.
1.4
Roadmap
The thesis continues in Chapter 2 with an overview of data mining together with a de-scription of the problems encountered when mining transactional data for information. The main part of that chapter surveys techniques for handling the problem of uncertainty and adaptation and their applicability in mining transactional data.
Preprocessing of the data for the purpose of data mining is a recurrent challenge in data mining and is reported to take up to 80 percent of data mining and knowledge discov-ery projects’ time [Adriaans and Zantinge, 1996, Han and Kamber, 2006, Kotsiantis and et al., 2006, Pyle, 1999]. For mining transactional data, a part of the preprocessing step involves constructing appropriate customer profiles. Chapter 3 provides a detailed descrip-tion of customer profiles and the methods for their construcdescrip-tion along with a statistical description of Screwfix’s transactional data. The results obtained from using clustering as a preprocessing step for Screwfix’s transactional data is also presented.
Chapters 4 and 5 contain the results of investigated approaches for uncertainty han-dling in classifying transactional data for a binary and multiclass case respectively. Chap-ter 6 then presents adaptive mechanisms for transactional data mining. ChapChap-ter 7 con-cludes this thesis with a summary and a discussion of open research problems pertaining to transactional data mining.
Chapter 2
Background Knowledge and
Research Challenges
The purpose of this chapter is to give a concise overview of the fundamentals of data mining, as well as challenges encountered in its application to transactional data.
It starts with an introductory overview of the field of data mining in Section 2.1. Data mining algorithms discover hidden/unknown patterns in data and generate models for the purpose of knowledge discovery and understanding. The discussion here covers the common data mining approaches and their use in mining transactional data.
The discipline of data mining has seen an explosion of interest over the last few years, and has been successfully applied across an extraordinary range of problem domains, in areas as diverse as finance [Kovalerchuk and Vityaev, 2000], medicine [Lavra and Zu-pan, 2005, Lavrac, 1999], engineering [Grossman et al., 2001], geology [Ester et al., 2001, Shekhar et al., 2003] and physics [Grossman et al., 2001, Sumathi and Sivanandam, 2006]. Indeed, anywhere that there are problems of prediction, classification or control, data mining techniques are being introduced. This increase in usage can be attributed to the ability of data mining techniques to contribute to the generation of new opportunities, by providing the following capabilities [Berry and Linoff, 2004]:
• Automated prediction of trends and behaviours. Data mining automates the process of finding predictive information in large databases. Questions that tradi-tionally required extensive hands-on analysis can now be answered quickly, directly from the data. A typical example of a predictive problem is targeted marketing [Associates, 1999]. Data mining uses data on past promotional mailings to identify the targets most likely to maximize return on investment in future mailings. Other predictive problems include forecasting bankruptcy [Foster and Stine, 2004, Sung et al., 1999] and other forms of default [Kumar and Ravi, 2008, Phua et al., 2005], and identifying segments of a population likely to respond similarly to given events
• Automated discovery of previously unknown patterns. Data mining tools sweep through databases and identify in one step previously hidden patterns . An example of pattern discovery is the analysis of retail sales data to identify seemingly unrelated products that are often purchased together [Gutierrez, 2006]. Other pat-tern discovery problems include detecting fraudulent credit card transactions [Chan et al., 1999] and identifying anomalous data that could represent data entry keying errors [Margineantu et al., 2005].
The application of data mining techniques in mining transactional data have however been hampered due to the skewness and sparsity of transactional data. This will be elaborated upon in the later chapters of this thesis.
2.1
Overview of Data Mining
Data mining is defined as the explorative and non-trivial search for implicit, previously unknown, and potentially useful insights from data [Han and Kamber, 2006]. It is the automated process of discovering patterns in data [Fayyad, 1996]. It consists of different phases and incorporates a number of computer science fields such as Artificial Intelli-gence, Databases, and Machine Learning, as well as intellectual human capabilities such as curiosity and creativity.
The goal of data mining is to estimate (or learn) a useful model of an unknown system from available data. The generated model is subsequently often used in business applications for predictive or descriptive purposes. In distinguishing data mining from the other learning methods of predictive and statistical model estimation, Cherkassky and Mulier [1998] describe data mining as the learning methodology which attempts to extract a subset of data samples (from a given large data set) with useful (or interesting) properties. However, the apparent non-distinction of data mining from the other learning methods of predictive and statistical model estimation, arises from the ’seemly’ absence of generally accepted theoretical frameworks for data mining which has resulted in data mining algorithms being initially introduced (by practitioners) and then ’justified’ using formal arguments from statistics, predictive learning, and information retrieval.
The concept of data mining is, however, becoming increasingly popular as a business information management tool, where it is expected to reveal knowledge that can guide decisions in conditions of limited certainty [Hand, 1998, Hand et al., 2001].
2.1.1
Stages of the Data Mining Process
Generally, the process of data mining consists of four stages [Fayyad, 1996]:
2. model building or pattern identification with validation/verification,
3. deployment (i.e., the application of the model to new data in order to generate predictions or describe the phenomenon responsible for the data),
4. model management.
Stage 1: Exploration.
This stage usually starts with data preparation which may involve cleaning data, data transformations, selecting subsets of records and - in the case of data sets with large numbers of variables (“fields”) - performing some preliminary feature selection operations to bring the number of variables to a manageable range (depending on the statistical methods being considered). Then, depending on the nature of the analytic problem, this first stage of the process of data mining may involve anywhere from a simple choice of straightforward predictors for a regression model, to elaborate exploratory analyses using a wide variety of graphical and statistical methods, in order to identify the most relevant variables and determine the complexity and/or the general nature of models that can be taken into account in the next stage.
The main goal of this stage as outlined in the visual guide to the Cross Industry Standard Process for Data Mining (CRISP-DM) methodology shown in Figure 2.1 is to understand the data to be mined as well as to assess and determine the business’ data mining goal.
Stage 2: Model Development and Validation.
This stage involves processing the prepared data and considering various models from which the best one is chosen based on their predictive performance (e.g., explaining the variability in question and producing stable results across samples). There are a variety of techniques which have been developed to achieve this goal - many of which are based on so-called “competitive evaluation of models”, that is, applying different models to the same data set and then comparing their performance to choose the best. These techniques - which are often considered the core of data mining for data model generation/selection/-validation - include: base classifiers (such as Decision Trees, Support Vector Machines, Neural Nets), ensemble methods (such as Bagging (Voting, Averaging), Boosting, Stack-ing (Stacked Generalizations)), and meta-learnStack-ing. They are discussed in greater detail in [Hastie et al., 2009].
The data processing, modelling and evaluation tasks are usually repeated with the knowledge and feedback from stage 1 incorporated if needed, until the model that performs
Stage 3: Model Deployment.
This penultimate stage of the initial data mining model development and deployment cycle involves using the model selected as best in the previous stage and applying it to new data, in order to generate predictions or estimates of the expected outcome.
Stage 4: Model Management.
Usually, model management implies periodic creation of models and replacement of cur-rent ones in an automatic or semi-automatic fashion. In this sense, model management is tightly coupled with model development and deployment steps. It can be seen as an outer-loop controlling these steps. When dealing with large numbers of models, a model management component, responsible for automating the creation and deployment of models, becomes a necessity. A useful approach for implementing model management is the champion/challenger testing strategy. In a nutshell, champion/challenger testing is a systematic, empirical method of comparing the performance of a production model (the champion) against that of new models built on more recent data (the challengers). If a challenger model outperforms the champion model, it becomes the new champion and is deployed in the production system. Challenger models are built periodically as new data are made available [Campos et al., 2005].
Another dimension of model management is the creation and management of metadata about models. Model metadata can be used to dynamically select, for scoring, models appropriate to answer a given question [Jain et al., 2008].
The model management stage usually encompasses the modelling, evaluation and de-ployment steps as also depicted in Figure 2.1.
Phases
a visual guide to CRISP-DM methodology
SOURCE CRISP-DM 1.0
http://www.crisp-dm.org/download.htm DESIGN Nicole Leaper
http://www.nicoleleaper.com Generic Tasks Specialized Tasks (Process Instances) Determine Business Objectives Background Business Objectives Business Success Criteria (Log and Report Process)
Assess Situation
Inventory of Resources, Requirements, Assumptions, and Constraints Risks and Contingencies Terminology Costs and Benefits (Log and Report Process)
Determine Data Mining Goals
Data Mining Goals Data Mining Success Criteria (Log and Report Process)
Produce Project Plan
Project Plan
Initial Assessment of Tools and Techniques
(Log and Report Process)
Collect Initial Data
Initial Data Collection Report (Log and Report Process)
Describe Data
Data Description Report (Log and Report Process)
Explore Data
Data Exploration Report (Log and Report Process)
Verify Data Quality
Data Quality Report (Log and Report Process)
Data Set Data Set Description (Log and Report Process)
Select Data
Rationale for Inclusion/ Exclusion
(Log and Report Process)
Clean Data
Data Cleaning Report (Log and Report Process)
Construct Data
Derived Attributes Generated Records (Log and Report Process)
Integrate Data
Merged Data (Log and Report Process)
Format Data
Reformatted Data (Log and Report Process)
Select Modeling Technique
Modeling Technique Modeling Assumptions (Log and Report Process)
Generate Test Design
Test Design
(Log and Report Process)
Build Model Parameter Settings
Models Model Description (Log and Report Process)
Assess Model
Model Assessment Revised Parameter (Log and Report Process)
Evaluate Results
Align Assessment of Data Mining Results with Business Success Criteria (Log and Report Process)
Approved Models
Review Process Review of Process (Log and Report Process)
Determine Next Steps
List of Possible Actions Decision
(Log and Report Process)
Plan Deployment
Deployment Plan (Log and Report Process)
Plan Monitoring and Maintenance
Monitoring and Maintenance Plan (Log and Report Process)
Produce Final Report
Final Report Final Presentation (Log and Report Process)
Review Project
Experience Documentation (Log and Report Process)
Modeling
manipulate data and draw conclusions
Evaluation
evaluate model and conclusions
Deployment
apply conclusions to business
Business Understanding
identify project objectives
Data Understanding
collect and review data
Data Preparation
select and cleanse data
Data Mining Life Cycle
1
2.1.2
Data Mining Tasks
The different data mining techniques used in accomplishing the stages in Section 2.1.1 can be classified according to different groups, depending on the kinds of knowledge to be discovered (i.e. problem to be solved), the kinds of databases to be mined, and the computing tools available.
In terms of tasks, data mining techniques can be classified into two categories: de-scriptiveand predictive [Han and Kamber, 2006]. Descriptive data mining tasks char-acterize the general properties of the data in the database. Predictive data mining tasks perform inference on the current data, in order to make predictions.
In terms of problems of intellectual, economic and business interest, data mining tech-niques can be grouped into the following four major categories:
Classification
Classification is concerned with arranging the data into predefined groups. It consists essentially of examining the features of a newly presented object and assigning it to one of a predefined set of classes. The objects to be classified are generally represented by records in a database table or a file, and the act of classification consists of adding a new column with a class code of some kind. For example, an email program might attempt to classify an email as legitimate or Spam.
The classification task is characterized by well-defined classes, and a training set con-sisting of pre-classified examples. The task is to build a model of some kind that can be applied to unclassified data in order to classify it.
Common classification algorithms like Nearest neighbour, Naive Bayes classifier and Neural network have been used to address classification tasks such as: [Berry and Linoff, 2000]
• Classifying credit applicants as low, medium, or high risk;
• Choosing content to be displayed on a Web page;
• Determining which phone numbers correspond to fax machines;
• Spotting fraudulent insurance claims;
• Assigning industry codes and job designations on the basis of free-text job descrip-tions.
All the examples given above have a limited number of classes/discrete outcomes, and the task is to assign any record into one of them.
Regression
Regression attempts to find a function which models the data with the least error. Unlike classification which deals with discrete outcomes, such as yes or no; regression deals with continuously valued outcomes which are estimated from a model learned from a set of training examples that include the numerical outcome. Given some input data, a regres-sion model delivers a value for some unknown continuous variable such as income,height, or credit card balance.
In practice, regression is often used to perform a classification task [Berry and Linoff, 2004]. For example, a telecommunications company might build a model which assigns all of its customers, based on their lifetime value, into one of two classes of “low propensity to churn” and “high propensity to churn”. An alternative approach will be to build a model which assigns each customer a “propensity to churn” score. These might be a value from 0 to 1 indicating the estimated probability that the customer will churn. The initial classification task now comes down to establishing a threshold score. Any customer with a score greater than or equal to the threshold is classified as belonging to the “high propensity to churn” class and any customer having a lower score is considered to belong to “low propensity to churn” class.
The regression approach has the great advantage that individual records can be ordered according to the estimate. To see the importance of this, suppose that the telecommu-nication company has budgeted for a loyalty reward programme as an incentive to keep 5000 of their likely to churn customers. If the classification approach is used and 15000 customers are identified as having a high propensity to churn, it might simply select 5000 customers from the identified 15000 customers. If, on the other hand, each customer has a propensity to churn score, it can instead include the 5000 most likely to churn customers in the loyalty reward program.
Examples of regression task include:
• A credit card company may estimate the amount of money an individual will spend in a year;
• A warranty provider may estimate the number of claims a particular product is likely to generate;
• A supermarket may estimate the number of customers in a particular location. Data mining techniques well suited to regression tasks include: generalized, logistic, probit, multinomial or neural networks regression models [Dobson and Barnett, 2008].
Clustering
into a number of more homogeneous subgroups or clusters, which are not predefined and without the use of any labels. The records are grouped together on the basis of similarity values, calculated using a number of possible similarity measures. It is up to the user to determine what meaning, if any, to attach to the resulting clusters. Clusters of symptoms might indicate different diseases. Clusters of customer attributes might indicate different market segments.
Clustering is often done as a prelude to some other form of data mining or modeling. For example, clustering might be the first step in a market segmentation effort; instead of trying to come up with a one-size-fits-all rule for “what kind of promotion do customers respond to best,” first divide the customer base into clusters or people with similar buying habits, and then ask what kind of promotion works best for each cluster [Berry and Linoff, 2000].
There are many clustering methods available, and each of them may give a different grouping of a dataset. The choice of a particular method will depend on the type of output desired, the known performance of the method with particular types of data, the hardware and software facilities available and the size of the dataset. In general, clustering methods may be divided into two categories: hierarchical and non-hierarchical methods, based on the cluster structure they produce [Jain and Dubes, 1988].
• The hierarchical methods produce a set of nested clusters in which each pair of objects or clusters is progressively nested in a larger cluster until only one cluster remains. The hierarchical methods can be further divided into agglomerative or divisive methods. In agglomerative methods, the hierarchy is built up in a series of
N-1 agglomerations, or fusion, of pairs of objects, beginning with the unclustered dataset. The less common divisive methods begin with all objects in a single cluster and at each of the N-1 steps divide some clusters into two smaller clusters, until each object resides in its own cluster.
• The non-hierarchical methods divide a dataset of N objects into M clusters, with or without overlap. These methods are sometimes divided into partitioning methods, in which the classes are mutually exclusive, and/or the less common clump-ing method, in which overlap is allowed. Each object is a member of the cluster with which it is most similar, however the threshold of similarity has to be defined.
Affinity Grouping or Association Rules
Affinity Grouping or Association Rules involves determining which things go together. It consist of searching for relationships between variables. It can be used to identify cross-selling opportunities and to design attractive packages or groupings of product and services. For example a supermarket might gather data of what each customer buys. Using association rule learning, the supermarket can work out what products are frequently
bought together, which is useful for marketing purposes. This is sometimes referred to as “market basket analysis” [Gutierrez, 2006]. This kind of market basket data analysis would enable the supermarket to bundle groups of items together as a strategy for maximizing sales. For example, given the knowledge that printers are commonly purchased together with computers, a supermarket could offer expensive models of printers at a discount to customers buying selected computers, in the hope of selling more of the expensive printers [Han and Kamber, 2006].
Affinity grouping can also be referred to as a simple approach to generating rules from data [Berry and Linoff, 2004]. For example, if two items, say biscuits and lemonade, occur together frequently enough, we can generate twoassociation rules thus:
• People who buy biscuits also buy lemonade with probabilityP1,
• People who buy lemonade also buy biscuits with probabilityP2.
2.1.3
Data Mining Tasks covered in this Thesis
This thesis mainly covers the clustering and classification data mining tasks. Cluster-ing is used in describCluster-ing the transactional data and aids in accomplishCluster-ing the business understanding, data understanding and data preparation phases of the data mining life cycle outlined in Figure 2.1. Classification models are also built, evaluated, deployed and adapted as highlighted in the modeling, evaluation and deployment phases of the data mining life cycle in Figure 2.1.
2.2
The Problem of Mining Transactional Data
In general, a transactional database consists of a file where each record represents a transaction [Berry and Linoff, 2004, Han and Kamber, 2006]. A transaction typically includes a unique transaction identity number (trans ID) and a list of the items making up the transaction (such as items purchased in a store). The transactional database may have additional tables associated with it, which contain other information regarding the sale, such as the date of the transaction, the customer ID number, the ID number of the salesperson and of the branch at which the sale occurred, and so on.
Transactional data are time-stamped data, collected over time, at no particular fre-quency. Some examples of transactional data are
• Web log data;
• Inventory data;
• Call Center data;
• Trading data.
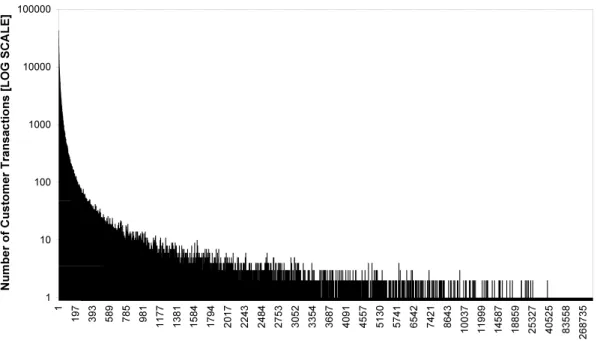
Transactional data apart from being traditionally large, is also inherently sparse, due mainly to the underlying process from which they are generated. For example, in retail transactional data, where it is usual for customers to purchase only a very small fraction of products, the average size of a basket (i.e., the collection of items that a customer pur-chases in a typical transaction) might contain just 3-4 products out of 1,000s of products in the retailer’s catalogue/inventory. Such a transaction when represented in an attribute-vector representation will have an average of 3-4 out of 1000s of product attributes that are not null. This implies that the fraction of non-zero attributes on the table (i.e. the sparsity factor) will be 3/1000 - 4/1000, or 0.3 - 0.4%. Figure 2.2 depicts the distribution of a typical transactional dataset.
0 500 1000 1500 2000 2500 3000 1 9 17 25 33 41 49 57 65 73 81 89 97 10 5 11 3 12 1 12 9 13 7 14 5 15 4 16 3 17 1 17 9 19 0 20 0 21 2 22 3 23 3 24 8 26 5 28 5 31 2 34 8 50 6 73 5 11 15 13 59 15 93 18 15 21 96
Items (Basket Size)
Tr an sa ct io ns
Figure 2.2: Plot depicting the distribution of items per transaction (Basket size) of a typical transactional dataset sourced from Screwfix Limited
Furthermore, the data mining process typically involves using the attribute-vector representation of the transaction, to build a predictive model consisting of the identified relevant independent variables which best minimize prediction error. Although processing power has continued to increase, performing the data mining process on the entire dataset available can be prohibitive in terms of time and finance.
This prohibition can be attributed either to the design structure of some data mining algorithms or the complexity of the problem to be solved [Nisbet et al., 2009]. Also, even though the data size, in terms of volume, might not be of great importance in solving data
mining problems; analysing all available variables is often computationally impossible in fields such as geodetics, bio-informatics, and finance [Mannila, 2000].
Pre-processing techniques are often employed to reduce the size of the dataset used in building and maintaining data mining based business models.
For sparse data, conventional sampling/feature reduction may not work well, because most of the samples are zeros [Church et al., 2006] while sampling or choosing fixed dataset columns/features from the dataset, as is done in some cases [Gemulla, 2008, Gemulla and Lehner, 2008], is also inflexible because different rows may have very different sparsity factors, leading to each sampled data instance conveying little or no information for accurate inference. The difficulty in performing an accurate inference with a reduced feature space of typical transactional dataset can be seen in Figure 2.3 where the data projection in 2D space is shown using the first 2 principal components. It can also be seen that the data is concentrated around the origin, reflecting the fact that a vast majority of customers buy only few items over long periods of time.
−1 0 1 2 3 4 5 −0.8 −0.6 −0.4 −0.2 0 0.2 0.4 0.6 0.8 1 1st Principal Component 2nd Prin cipal Comp onent
Figure 2.3: Plot showing the projection of the first two principal components of Customer Profiles based on the transactional data of Screwfix’s Electricians and PlumbHeaters.
Likewise, automatically clustering the transactional datasets as proposed in [Giannotti et al., 2002, Wang and Karypis, 2004, Yan et al., 2006, 2010], into mutually exclusive partitions is unwieldy with a resultant high misclassification rate of the discovered clusters due to the inherent skewness of transactional datasets.
2.2.1
Issues Encountered when Mining Transactional Data
that Web startups can become huge enterprises in months, not years, amassing propor-tionately large databases as they grow.
Most data mining techniques are, however, not well-suited to learn from evolving disparate data sources that may include multi-channel purchases, descriptive features, estimates based on partial data, video data, etc. as they are designed to operate on a static datasets of interest amassed over time. They take in, as input, a single homogeneous data set consisting of a fixed number of attributes and records, similar to a database relation or query result, with the assumption that the input data contains relatively few records which are generally static in nature.
For example, predictive data mining techniques employ statistical methods which op-erate on the whole data to produce statistical conclusions for specific patterns in the data. Huge data sets containing millions of training examples with a large number of attributes (tall fat data) are relatively easy to gather for such predictive data mining purposes. How-ever, one of the bottlenecks for successful inference of useful information from the data is the computational complexity of some machine learning algorithms which do not make any assumptions on the form of the underlying function.
Most state-of-the-art non-parametric machine learning algorithms1 -also known as memory based methods- such as Support Vector Machines, have a computational com-plexity of eitherO(N2) (for prediction) orO(N3) (for training in situations where solving
the quadratic problem and choosing the support vectors directly involves inverting the kernel matrix [Bordes et al., 2005]), whereN is the number of training examples [Burges, 1998, Gray and Moore, 2001, Kearns, 1990]. The computational bottleneck at the heart of these algorithms is the multiplication of a structured matrix with a vector, referred to in the literature as Sparse matrix vector product (MVP) [Agarwal et al., 1992].
This seriously restricts the use of these data mining algorithms in the context of min-ing transactional datasets, as the Sparse matrix vector product requires that all of the available data be retained while making the inference. Interfacing the data mining algo-rithms with business databases, as an integral part of an organization’s data management plan, is also made challenging, as workarounds are often required to deal with the issues of scalability, uncertainty and adaptivity.
2.2.2
Scalability
Most data mining techniques require all the data to be mined to be available in one table. This is counter-intuitive, especially as most real world applications describe complex objects in terms of properties and relations. For example, consider the one-to-many
1A learning algorithm is said to be non-parametric if the complexity of the functions it can learn is
allowed to grow as the amount of training data is increased. The term non-parametric has been restricted in some publications to learning algorithms in which the learned function is expressed directly in terms of the training examples, e.g., the nearest-neighbor classifier.
depiction of a customer’s many purchases at a store in Figure 2.4: A data mining task such
Figure 2.4: One-to-Many Customers Purchases
as basket analysis will require that the data be in a single table as depicted in Table 2.1 obtained by performing a join on the data in the Customer Table and Transaction Table in Figure 2.4.
CustomerID DateOfPurchase ProductPurchased Gender
1 01-03-06 Hammer Male
1 02-03-06 Screw driver Male
3 01-03-06 Drill bits Male
2 01-04-06 Water Pipes Male
3 09-04-06 Screws Male
5 08-04-06 Nails Male
Table 2.1: Example of a Table of Customer Transactions
However, performing a join to form Table 2.1 restricts the meaning/usefulness of the table to just details of customer transactions and will result in the loss of meaning/use-fulness of the resultant table if the detailed information (e.g. Address) on each unique customer who has made a purchase is required by the business.
Alternatively, we could aggregate the customer purchases in an effort to include more customer details whilst attempting to exclude redundant information to obtain Table 2.2. This however results in loss of information as whilst our aforementioned joining goals have been met and we know the number of purchases made; the exact dates of the individual purchases, together with the exact products purchased, are, however, unknown.
CustomerID DateOfLastPurchase NumberOfPurchases Gender Address 1 02-03-06 2 Male 1A High Sreet 2 02-04-06 1 Male 1A High St 3 09-04-06 2 Male 200 Main Rd 5 08-04-06 1 Male 200 High Rd Table 2.2: Example of a Table of Customer-Details Transactions
memory. Retrieving data from disk is markedly slower than accessing data in RAM. Thus, to be efficient, the data-mining techniques applied to very large data2 must be highly scalable3. An algorithm is said to be scalable if, given a fixed amount of main memory, its runtime increases linearly with the number of records in the input database.
Research on the scalability of mining algorithms tends to focus on either:
1. developing special-purpose scalable implementations of existing well-known algo-rithms that are guaranteed to return the same result as the original (naive) imple-mentation, but that typically will run faster on large data sets or
2. derive new approximate algorithms that inherently have desirable scaling perfor-mance by virtue of relying on various heuristics based on a relatively small number of linear scans of the data.
There have been several clustering algorithms [Bradley et al., 1998, Lara and Baran-dela, 2005, Zhang et al., 1996], association rule algorithms [Agrawal and Shafer, 1996, Agrawal and Srikant, 1994, Za¨ıane et al., 2001] and classification algorithms [Shafer et al., 1996, Srivastava et al., 1997] that were designed to achieve scalability by processing the data points in an incremental manner, or by processing the data points in small batches. However, these algorithms still treat all the objects of the data set the same way with-out making any distinction between old data and new data. Therefore, these approaches cannot possibly handle evolving data, where new concepts emerge, old concepts die out, and existing concepts change.
Ganti et al. [1999] survey a broad range of scalability issues which algorithms that address three data-mining problems: market basket analysis, clustering, and classification have to overcome. Grossman [2001], Grossman and Guo [2002] describe some approaches and specific techniques for scaling data mining algorithms to large data sets through parallel processing, that have been used to implement data mining algorithms that are
2The term “Large Data” is often used in the data mining literature to mean data that does not fit into
the memory of a single processor.
3The term “scalable” is used in the data mining literature to refer to data mining algorithms that scale
gracefully and predictably (e.g. linearly) as the number of records n and/or the number of variables p grow.

![Figure 3.5: Plot showing transaction patterns of the Topics (normalized by scaling the aggregated total number of item topic bought in the range [0.0, 1.0]) for the unverified customer trade-types.](https://thumb-us.123doks.com/thumbv2/123dok_us/1995228.2796370/50.892.170.808.169.489/figure-showing-transaction-patterns-normalized-aggregated-unverified-customer.webp)