Zero-day Malware Detection based on Supervised Learning
Algorithms of API call Signatures
Mamoun Alazab
1, Sitalakshmi Venkatraman
1, Paul Watters
1, and Moutaz Alazab
21
Internet Commerce Security Laboratory
School of Science, Information Technology & Engineering University of Ballarat
{m.alazab, s.venkatraman, p.watters } @ ballarat.edu.au
2
School of Information Technology Deakin University, Australia {malazab} @ deakin.edu.au
Abstract
Zero-day or unknown malware are created using code obfuscation techniques that can modify the parent code to produce offspring copies which have the same functionality but with different signatures. Current techniques reported in literature lack the capability of detecting zero-day malware with the required accuracy and efficiency. In this paper, we have proposed and evaluated a novel method of employing several data mining techniques to detect and classify zero-day malware with high levels of accuracy and efficiency based on the frequency of Windows API calls. This paper describes the methodology employed for the collection of large data sets to train the classifiers, and analyses the performance results of the various data mining algorithms adopted for the study using a fully automated tool developed in this research to conduct the various experimental investigations and evaluation. Through the performance results of these algorithms from our experimental analysis, we are able to evaluate and discuss the advantages of one data mining algorithm over the other for accurately detecting zero-day malware successfully.
The data mining framework employed in this research learns through analysing the behavior of existing malicious and benign codes in large datasets. We have employed robust classifiers, namely Naïve Bayes (NB) Algorithm, k−Nearest Neighbor (kNN) Algorithm, Sequential Minimal Optimization (SMO) Algorithm with 4 differents kernels (SMO - Normalized PolyKernel, SMO – PolyKernel, SMO – Puk, and SMO- Radial Basis Function (RBF)), Backpropagation Neural Networks Algorithm, and J48 decision tree and have evaluated their performance.
_____________________________
Copyright © 2011, Australian Computer Society, Inc. This paper appeared at the 9th Australasian Data Mining Conference (AusDM 2011), Ballarat, Australia. Conferences in Research and Practice in Information Technology (CRPIT), Vol. 121, Peter Vamplew, Andrew Stranieri, Kok-Leong Ong, Peter Christen and Paul Kennedy, Eds. Reproduction for academic, not-for profit purposes permitted provided this text is included
Overall, the automated data mining system implemented for this study has achieved high true positive (TP) rate of more than 98.5%, and low false positive (FP) rate of less than 0.025, which has not been achieved in literature so far. This is much higher than the required commercial acceptance level indicating that our novel technique is a major leap forward in detecting zero-day malware. This paper also offers future directions for researchers in exploring different aspects of obfuscations that are affecting the IT world today.
Keywords: Malware, Intrusion Detection, Obfuscation, API.
1 Introduction
Windows API enables the programs to exploit the power of Windows and hence malware authors make use of the API calls to perform malicious actions (Tamada et al. 2006; Sharif et al. 2008; Choi et al. 2009; Alazab, Venkatraman & Watters 2010). This approach has enabled malware authors to adopt various obfuscation techniques, thereby posing a major challenge to the existing Anti-Virus (AV) detection engines. Literature provides several approaches being investigated to thwart such malware, and among these approaches, data mining methods have been more successful in detecting these recent malware that adopt API calls for infecting the executables (Symantec Enterprise Security, 1997; Sung et al. 2004; Kolter & Maloof 2006). However, due to the requirement of high accuracy in the case of malware detection with very low false positives, such methods have not been effective in the practical world (Venkatraman, 2010; RSA, 2011; Symantec Enterprise Security, 2011). In this research, we have employed a novel and effective method of extracting API call features and in training the classifiers using several data mining techniques for an efficient detection of obfuscated malware that lead to zero-day (unknown) attacks of today.
1.1 Malware Obfuscation
The term obfuscation means modifying the program code in a way to preserve its functionally with the aim to
reduce vulnerability to any kind of static analysis and to deter reverse engineering by making the code difficult to understand and less readable (Linn & Debray 2003). Obfuscation techniques such as packing, polymorphism and metamorphism are used by malware authors as well as legitimate software developers (Alazab, Venkatraman & Watters 2009). They both use code obfuscation techniques for different reasons. Code obfuscation is very effectively used by malware authors to evade antivirus scanners since it modifies the program code to produce offspring copies which have the same functionality but with different byte sequence or „virus signature‟ that is not recognized by antivirus scanners (Rabek et al. 2003).
1.2 Windows API Calls
Windows API calling sequence reflects the behaviour of executables. The Windows API function calls fall under various functional levels such as system services, user interfaces, network resources, windows shell and libraries. Since the API calls reflect the functional levels of a program, analysis of the API calls would lead to an understanding of the behaviour of the file. Malicious codes are able to disguise their behaviour by using API functions provided under Win32 environment to implement their tasks. Therefore, in binary static analysis, the focus is on identifying all documented Windows API call features to understand the malware behaviour.
In the Windows operating system, user applications rely on the interface provided within a set of libraries,
such as KERNEL32.DLL, NTDLL.DLL and
USER32.DLL in order to access system resources including files, processes, network information and the registry. This interface is known as the Win32 API. Applications may also call functions in NTDLL.DLL known as the Native API. The Native API functions perform system calls in order to have the kernel provide the requested service. In our previous works (Alazab 2010; Alazab et al. 2010; Alazab, Venkatraman & Watters 2010) we have demonstrated how to extract and analyse these API call features including hooking of the system services that are responsible to manage files. The extracted calls are confined to those that affect the files. Various features related to the calls that create or modify files or even get information from the file to change some value and information about the DLLs that are loaded by the malware before the actual execution are considered for the analysis.
1.3 Need for the Study
Recently, API calls have been explored for modeling program behaviour. There are studies (Choi et al. 2009) (Tamada et al. 2006) (Park et al. 2008b) (Park et al. 2008a) that have used analysis of API calls for generation of birthmark on portable execution. Use of statistical analysis of file binary content including statistical N-gram modeling techniques (Stolfo, Wang & Li 2005) (Wang et al. 2009) have been tested in identifying malcode in document files and does not have sufficient resolution to represent all class of file types. From other study on related work (Venkatraman 2009) (Bruschi, Martignoni & Monga 2006) (MetaPHOR 2010) (Perriot & Ferrie 2004) (Ferrie & Szor 2001) (Ferrie & Szor 2001) (Linn & Debray 2003) (Chang & Atallah 2002), it
has been found that the statistical modeling of hidden malcode that predominantly use Windows API calling sequence for evading detection is yet to be explored. This is a motivation for this research towards a positive contribution in understanding malware behavior through statistical analyses of API calls.
The analysis of computer system performed offline is called static analysis, which has been employed in this research to study the patterns of the API calls within binary executables by reverse engineering the code. Static analysis provides a better understanding of the anomalous behavior patterns of the code since we adopt a methodology to perform a deep analysis into the code program and their statistical properties. The existing techniques and methods exhibit false positives as they do not perform sufficient statistical analysis to determine if the anomaly was „actually‟ malicious (Jacob et al., 2008; Symantec Enterprise Security, 2011). Therefore, in this research, static anomaly-based detection analysis is adopted to perform introspection of the program code with the goal of determining various dynamic properties of API function calls that are extracted from these codes in an isolated environment.
The results of the following recent studies have been the prime motivation for this research: 1) malware authors are able to easily fool the detection engine by applying obfuscation techniques on known malwares (Sharif et al. 2008), 2) identifying benign files as malware (false positive) is becoming very high (Symantec Enterprise Security 2011), 3) failing to detect obfuscated malware is high (false negative) (Symantec Enterprise Security 2011) (Symantec Enterprise Security 2010) (Symantec Enterprise Security 2009), 4) the current detection rate is decreasing, and 5) current malware detectors are unable to detect zero day attacks (Symantec Enterprise Security 2011) (RSA 2011). These results imply that code obfuscation has become a challenge for digital forensic examiners with the limitations of signature based detection (Tang, Zhou & Zuo 2010) (Santos et al. 2009).
2 Data Mining
In the recent years, data mining has become the focus of many malware researchers for detecting unknown Malware or to classify malware from benign files. Data mining is usually referred to as knowledge discovery in databases. Frawley et al. (Frawley, Piatetsky-shapiro & Matheus 1992) define it as “The nontrivial extraction of implicit, previously unknown, and potentially useful information from data”. It is also defined as ”The science of extracting useful information from large data sets or databases” (Hand, Mannila & Smyth 2001). In this research, data mining involves the application of a full suite of statistical and machine learning algorithms on a set of features derived from malicious and clean programs.
Features form the input data to the detection systems, and features can be used as patterns for classification in malware detection systems. Reverse engineering of executables results in extracted features useful for two types of detections: i) Host-Based Intrusion Detection System (HIDS) – to check, analyse and monitor the computer system internally such as extract byte
sequences, ASCII, instruction sequences, and API call sequences, and ii) Network-Based Intrusion Detection system (NIDS) – to detect malicious activity by monitoring network traffic such as denial of service (DOS) attacks, port scans.
A data mining approach to malware detection usually involves employing statistical methods for classification. Each classification algorithm constructs a model, using machine learning, to represent the benign and malicious classes. In this approach, a labeled training set is required to build the class models during a process of supervised learning. Many statistical classification algorithms exist including Naive Bayes (NB) Algorithm, k−Nearest Neighbor (kNN) Algorithm, Sequential Minimal Optimization (SMO) Algorithm with 4 different kernels (SMO - Normalized PolyKernel, SMO – PolyKernel, SMO – Puk, and SMO- Radial Basis Function (RBF)), Backpropagation Neural Networks Algorithm, Logistic Regression, and J48 decision tree. The key to statistical classification is to represent the malicious and benign samples in an appropriate manner to enable the classification algorithms to work effectively. Feature extraction is an important component of effective classification, and an associated feature vector that can accurately represent the invariant characteristics in the training sets and query samples is highly desirable. Classification is the process of classifying data into two or more predetermined groups based on features.
2.1 Related Study
Data mining techniques for malware detection usually starts with the first step of generating a feature set. In 2005, studies reported in (Malan & Smith 2005) that a temporal consistency element was added to the system call frequency to calculate the frequency of API system call sequences. Similarity measures were calculated using edit distance and Measuring Similarity with Intersection. The first measure was on ordered sets of native API system calls, while the second one was on unordered sets. Both similarity measures based on API gave the probabilities of two peers. The drawback is that they had considered only native API call features.
Static Analysis for Vicious Executables (SAVE) (Sung et al. 2004) is another work based on API calls made in an attempt to detect polymorphic and metamorphic malwares. They defined signature as an API sequence of calls and started the reverse engineering process from decompressed 16 binaries, which are then passed through a PE file parser. Next, they extracted and mapped the sequence of Windows API calls, and lastly passed them through the similarity measure module, where similarity measures such as, Euclidian distance, Sequence alignment, Cosine measure, extended Jaccard measure, and the Pearson correlation measure were used. Binary executables under inspection is classified by identifying a high similarity to a known instance of malware in the training set. Although these similarity measures enable SAVE to detect polymorphic and metamorphic malwares efficiently against 8 malware scanners, their weakness is not being able to detect unknown malware.
Another signature-free system to detect polymorphic malware and unknown malware based on the analysis of
Windows API execution sequences extracted from binary executable is called Intelligent Malware Detection System (IMDS) (Ye et al. 2007). IMDS was developed using Objective-Oriented Association (OOA) mining based classification with large data set gathered for the experiment (29580 binary executables, of which 12214 were benign binary executables and 17366 were malicious binary ones). For detection, a Classification Based on Association rules (CBA) technique such as Naïve Bayes, SVM and Decision Tree were used. The result was compared against anti-virus software‟s such as Norton, Kaspersky, McAfee, and Dr.Web. In 2010 the authors of IMDS had incorporated the CIDCPF method into their existing IMDS system with larger dataset, and called it CIMDS system (Yanfang et al. 2010). CIDCPF adapted the post processing techniques as follows: first Chi-square testing was applied and Insignificant rule pruning followed by using Database coverage based on the Chi-square measure rule ranking mechanism and Pessimistic error estimation, and finally prediction was performed by selecting the best First rule. Their results were good, but involved unbalanced test data while the training data was quite balanced. Also, the detection rate was for training set about 89.6% and the accuracy was approximately 71.4 and in the testing set about 88.2% and the accuracy was approximately 67.6 which still the work need to be improve to achieve higher detection rate and higher overall accuracy.
In 2006, researchers (Kolter & Maloof 2006) described the use of machine learning and data mining to detect and classify malicious executables. They tested several classifiers including, IBk, naive Bayes, support vector machines (SVMs), decision trees, boosted naive Bayes, boosted SVMs, and boosted decision trees. Kolter found that support vector machine performed exceptionally well and fast as compared to the other classifiers. Hence, for the obfuscated malware detection system, this research adopts SVM as a classifier for the detection of hidden malware that invariably uses API call sequence.
API based features are not only good in classification of malware, but is also good in detecting injected malicious executable. DOME (Rabek et al. 2003) is a host-based technique that uses static analysis based on monitoring and validating Win32 API calls for detecting malicious code in binary executables. In a study on the performance of kernel methods in the context of robustness and generalization capabilities of malware classification (Shankarapani et al. 2010), results revealed that analysis based on the Win API function call provides good accuracy to classify malware.
3 Methodology
This section describes the overall methodology adopted as shown in Figure 1, which consists of three groups of processes; In the first group, the following 3 steps have been employed: Step 1: Unpack the malware and disassemble the binary executable to retrieve the assembly program, Step 2: Extract API calls and important machine-code features from the assembly program, and Step 3: Map the API calls with MSDN library and analyse the malicious behaviour to get the API sequence from the binaries. In the second group,
after getting the API sequences from the binaries, the signature database is updated based on their API calls. This sequence is compared to a sequence or signature (from the signature database) and is passed through the similarity measure module to generate the similarity report. In the third group, Mutual Information (MI) based Maximum Relevance (MR) filter ranking heuristics on the set of Win API function calls is used for feature selection of relevant features, which provides more information about the class variables than irrelevant features. After getting the best features on the set of Win API calls, supervised learning method has been applied that uses a dataset to train, validate and test, an array of classifiers. Eight robust classifiers have been selected for this purpose, namely, Naive Bayes (NB) Algorithm, k−Nearest Neighbor (kNN) Algorithm, The Sequential Minimal Optimization (SMO) Algorithm with 4 differents kernels (SMO - Normalized PolyKernel, SMO – PolyKernel, SMO – Puk, and SMO- Radial Basis Function (RBF)), Backpropagation Neural Networks Algorithm, and J48 decision tree. However, the classification methods require training data and data to validate the models that have been formulated. Therefore, K-fold cross-validation has been used for evaluating the results of a statistical analysis generating an independent dataset. Extensive testing and analysis performed on malware and benign datasets with different learning techniques have shown that 10 folds provide the best estimate of error. Having k=10 folds means 90% of full data is used for training (and 10% for testing) in each fold test. Evaluation (feature selection + classification) was done inside 10-fold cross-validation loop on all Malware and benign datasets.
Figure 1. System overview of zero-day Malware detection methodology
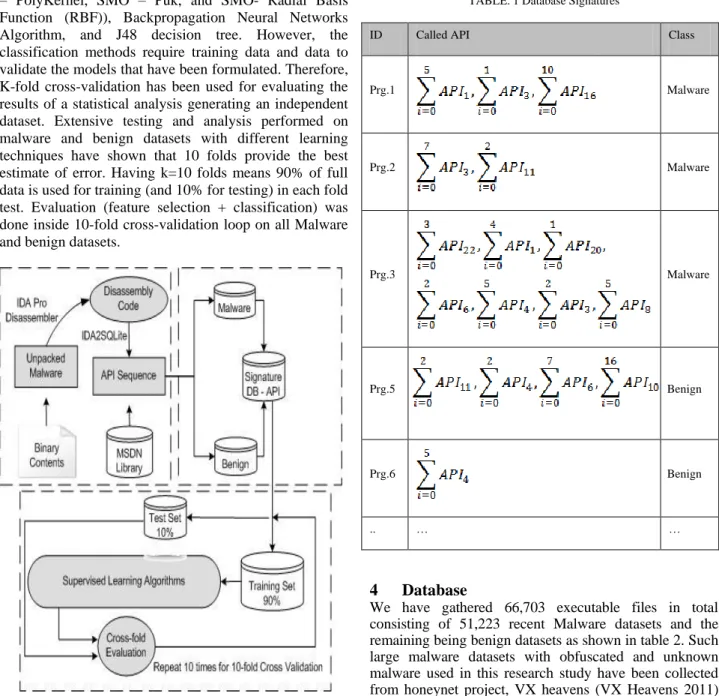
Our proposed methodology mainly focuses on the API call features and the similarity based detection for identifying unknown malware and classifying them with existing malware families. Figure 1 gives a system overview of the similarity based detection methodology adopted. Signature database has been used to statistically calculate and compute the similarity measures. Eight distance measures have been adopted to analyse and differentiate between malware variants and benign executables from various families. The Signature database has been generated from the existing malware datasets to produce fingerprint or benchmark for each record based on the API calls that the executable programs had used as shown in table 1.
The signature database has been used later in next section to measure the distances between the programs and subsequently the results are analysed to classify these programs based on their API call features.
TABLE. 1 Database Signatures
ID Called API Class
Prg.1 Malware Prg.2 Malware Prg.3 Malware Prg.5 Benign Prg.6 Benign .. … … 4 Database
We have gathered 66,703 executable files in total consisting of 51,223 recent Malware datasets and the remaining being benign datasets as shown in table 2. Such large malware datasets with obfuscated and unknown malware used in this research study have been collected from honeynet project, VX heavens (VX Heavens 2011) and other sources.
The 15,480 benign datasets include: Application software such as Databases, Educational software,
Mathematical software, Image editing, Spreadsheet, Word processing, Decision making software, Internet Browser, Email and many others system software, Programming language software and many other applications. Both (Malware, Benign) have been uniquely named according to their MD5 hash value.
TABLE. 2 Dataset
Type Qty
Max. Size Min. Size Avg. Size
(KB) (KB) (KB) Benign 15,480 109,850 0.8 32,039 Virus 17,509 546 1.9 142 Worm 10,403 13,688 1.6 860 Rootkit 270 570 2.8 380 Backdoor 6,689 1,299 2.4 685 Constructor 1,039 77,662 0.9 1,193 Exploit 1,207 22,746 0.5 375 Flooder 905 16,709 1 1,397 Trojan 13,201 17,810 0.7 1,819
5 Evaluation and Validation
The classification algorithms require training data to train the formulated models, and testing data to test those models. Validation of the models is achieved by making a partition on the database of malware and benign for carrying out the experiments. The cross-validation is a technique used for evaluating the results of a statistical analysis by generating an independent dataset for Malware and benign. The most common types of cross-validation are repeated random sub-sampling cross-validation and K-fold cross-validation (Hand, Mannila, & Smyth, 2001). For this research study of Malware and Benign classification, K-fold cross-validation has been selected for validation as it is commonly adopted for many classifiers (Witten and Frank, 2010; Bhattacharyya, etal 2011).
In k-fold cross-validation the data is first partitioned into k sized segments or folds. Then, k iterations of training and validation are performed such that within each iteration a different fold of the data is held-out for validation while the remaining k-1 folds are used for learning. The advantage of K-Fold cross-validation is that all the examples in the dataset are eventually used for both training and testing. Also, all observations are used for both training and validation, and each observation is used for validation exactly once.
We have evaluated various algorithms based on the following standard performance measures:
True Positive (TP): Number of correctly identified malicious code,
False Positive (FP): Number of wrongly identified benign code, when a detector identifies benign file as a malware.
True Negative (TN): Number of correctly identified benign code.
False Negative (FN): Number of wrongly identified malicious code, when a detector fails to detect the malware because the virus is new and no signature is yet available.
True detection Rate (TP rate): Percentage of correctly identified malicious code.
False alarm Rate (FP rate): Percentage of wrongly identified benign code, given by:
F-Measure: It is a measure of a test's accuracy by combining recall and precision scores into a single measure of performance, usually it is between 0.0 and 1.0 closer to 1 is good and closer to 0.0 is poor.
Overall Accuracy: Percentage of correctly identified code, given by:
ROC curve: In a Receiver Operating Characteristic curve the true positive rate is plotted in function of the FP rate for different points. Each point on the ROC curve represents a sensitivity pair corresponding to a particular decision threshold. A test with perfect discrimination has a ROC curve that passes through the upper left corner (100% sensitivity). Therefore the closer the ROC curve to the upper left corner, the higher is the overall accuracy of the test. Usually, ROC area higher (closer) to 1 is considered good, and closer to 0.0 is considered poor.
6 Supervised Learning Algorithms 6.1 The Naive Bayes (NB) Algorithm
The Naive Bayes algorithm (Kuncheva 2006) is one classification method based on conditional probabilities that uses a statistical approach to the problem of pattern recognition. Literature reports that it is the most successful known algorithms for learning to classify text documents, and further it is fast and highly scalable for model building and scoring reference. The idea behind a Naive Bayes algorithm is the Bayes‟ Theorem and the maximum posteriori hypothesis. Bayes Theorem finds the probability of an event occurring given the probability of another event that has occurred already. For instance, for a feature vector x with n attributes values
, and a class variable , .
Bayesian classifiers can predict class membership with probabilities for the feature vector x whose
distribution depends on the class . The class for which the probability is given by , is called the maximum posteriori probability that feature vector x belongs, and can be computed from by Bayes‟ rule:
It applies “naïve” conditional independence assumptions which states that all n features of the feature vector x are all conditionally independent of one another, given , and Naïve Bayes assumption is calculated as follows:
The most probable hypothesis given the training data „Maximum a posteriori‟ hypothesis results in the following:
Among data mining methods, Naive Bayes algorithm is easy to implement and is an efficient and effective inductive learning algorithm for machine learning. Figure 2 provides the overall accuracy rate for malware detection achieved through our experiments using Naive Bayes with k cross validations, k= {2,3,4,5,6,7,8,9,10}.
Figure 2 Performance of Naive Bayes (NB) with k cross validations (k=2 to 10)
6.2 The Sequential Minimal Optimization (SMO) Algorithm
Sequential Minimal Optimization (SMO) is a set of simple algorithms that can quickly solve the SVM QP problem, expand QP without any extra matrix storage and without using numerical QP optimization. The advantage of SMO is its ability to solve the Lagrange multipliers analytically. SMO is a supervised learning algorithm used for classification and regression, and it is a fast implementation of Support Vector Machines (SVM). The
basic advantage is that it attempts to maximise the margin, for example the distance between the classifier and the nearest training datum. SMO constructs a hyperplane or set of hyperplanes in an n-dimensional space, which can be used for classification. Basically, a separation can be considered good when the hyperplane has the largest distance to the nearest training data points of any class, since in general the larger the margin the lower the generalization error of the classifier. SMO has been selected to classify malicious and benign executables because it is competitive with other SVM training methods such as Projected Conjugate Gradient "chunking", and in addition it is easier to implement in WEKA (Witten & Frank 2010).
As shown in figure 3, we have employed 4 different kernels; Radial Basis Function Kernel (RBF), Polynomial kernel, Normalized Polynomial kernel, and the Pearson VII function-based universal kernel (Puk), and the overall accuracy rate for malware detection achieved through Normalized Polynomial kernel is the highest for all the k cross validations, k={2,3,4,5,6,7,8,9,10}.
Figure 3 Performance of four Sequential Minimal Optimization kernels with k cross validations (k=2 to 10)
6.3 Artificial Neural Networks (ANN) Algorithm
Artificial Neural Networks (ANN) are biologically inspired form of distributed computing usually comprising of a set of nodes (including input, hidden and output) and weighted connections between them (Chen, Hsu, & Shen, 2005). Guo and Li (Guo & Li, 2008) define ANNs as a topology/architecture formed by organizing nodes into layers and linking the layers of neurons. The nodes are interconnected by weighted connections, and the weights are adjusted when data is presented to the network during a training process (Dayhoff & DeLeo, 2001)
A number of variations of neural networks are in use today in different applications, including in fraud detection. The use of ANNs in fraud detection spans almost all major forms of fraud including telecommunications fraud, financial fraud and computer
intrusion fraud among others (Kou, Lu, Sirwongwattana, & Huang, 2004). In fraud detection and anomaly detection, ANNs are fundamentally used as classification tools (Chandola, Banerjee, & Kumar, 2009). Usually, anomaly detection approach using neural networks involves two steps: training and testing. First, the network is trained on some part of the data to learn the different classes. Then, the remaining portion of the data is used to run the network to test accuracy and other performance indicators.
ANNs provide a non-linear mapping from the input space to the output space so that it can learn from the given cases and generalize the internal patterns of a given dataset (Guo & Li, 2008). Thus, ANNs adapt the connection weights between neurons and approximate a mapping function that models the training data provided for this purpose. Neural networks have the ability to learn distinct classes without knowledge of the data distribution (Chandola et al., 2009). However, most classifications rely on accurately labelled data which is often not readily available, especially for online banking and credit card fraud detection (Chandola et al., 2009). In Credit Card fraud detection, the FALCON system, which the developers claim to be in use by 65% of the credit systems worldwide, employs Neural Networks (FICO, 2010). Furthermore, VISA, Eurocard and Bank Of America (among others) use Neural technology in their Credit Card systems (Aleskerov, Freisleben, & Rao, 1997). The SAS fraud management system employs an ensemble of neural networks called Self Organizing Neural Network Arboretum (SONNA). Lastly, ACI„s Proactive Risk Manager (PRM) also features a neural network in its architecture (IBM, 2008).
The downside to neural networks‟ distribution free generalisation is that they are prone to local minima and over-fitting (Bhattacharyya, Jha, Tharakunnel, & Westland, 2011). When the ANN is learning, a stopping condition may be declared as the anticipated net training error after a particular training session. This value is often a global minimum relative to the network‟s training errors. Sometimes, the ANN stops learning and gets stuck at a local minimum instead of the desired global minimum. This situation is most commonly referred to as the local minimum problem. Another problem with ANNs is hidden neuron saturation, where the hidden layer inputs are too high or too low such that the hidden layer output is almost close to the bounds of the activation function at that layer (Wang, etal, 2004). The other drawback with ANNs is their lack of adaptation to new data trends. At any point, ANNs will model only the data they have been trained on. This means that when a statistically different data pattern is introduced, the ANN will need to be re-trained or it may not correctly classify the new pattern. Consequently, this dictates that ANNs be retrained on a regular basis to keep up with emerging data trends. In online banking, ANNs are retrained after a defined period or after a certain number of examples have been collected.
Recently, classification method using a NN was used for Malware detection. Generally, the classification procedure using the NN consisted of three steps, data preprocessing, data training, and testing. In our experiments, the data preprocessing was performed as the
feature selection stage. In the data training, the selected features from the data preprocessing step were fed into the NN, and the classifier was generated through the NN for classifying the data as either Malware or Benign. For the testing step, the classifier was used to verify the efficiency of NN. In the experiment, an error BP (Back Propagation) algorithm was used. The best-known example of a neural network training algorithm, namely back propagation was employed. Back propagation algorithm within neural network was used because of the large amount of input/output data and the overwhelming amount of complexity due to the fuzzy outputs. Figure 4 provides the overall accuracy rate for malware detection achieved through our experiments using Artificial Neural
Networks with k cross validations, k=
{2,3,4,5,6,7,8,9,10}.
Figure 4 Performance of Artificial Neural Networks (ANN) with k cross validations (k=2 to 10)
6.4 J48 Algorithm
J48 classifier is a C4.5 decision tree used for classification purposes. In order to classify a new item, the classifier first needs to create a decision tree based on the attribute values of the available training data. So, whenever it encounters a set of items (training set) it identifies the attribute that discriminates the various instances most clearly. This feature that is able to tell the most about the data instances for classifying them the best is said to have the highest information gain.
Figure 5 Performance of J48 with k cross validations (k=2 to 10)
Among the possible values of this feature, if there is any value for which there is no ambiguity, that is, when the data instances falling within its category have the same value for the target variable, then that branch is terminated and the target value arrived is assigned to it. Figure 5 provides the overall accuracy rate for malware
detection achieved through our experiments using J48 with k cross validations, k= {2,3,4,5,6,7,8,9,10}.
6.5 K-Nearest Neighbors (kNN) Algorithm
kNN is a simple supervised machine learning algorithm used for classifying objects based on closest training instants in the feature space. It has been used in many applications in data mining, statistical pattern recognition and many others. The object is classified based on a majority vote of its k nearest neighbors at closest distant from the object.
In our experiments, the K-nearest neighbors are compute as follows with K:
Store all training samples in memory.
Determine the parameter K = number of nearest neighbors beforehand. (A good k can be selected using cross-validation for example).
Measure the distance between the query-instance (x) and all the training samples . (any distance algorithm can be used to ) such as:
Find the K-minimum distance between the query-instance (x) and each K
.
Get all categories of training data for the sorted value under K.
Find the weighted distance of the query-instance (x) from each of the k nearest points as follows:
Figure 6 provides the overall accuracy rate for malware detection achieved through our experiments using K-Nearest Neighbors with k cross validations, k= {2,3,4,5,6,7,8,9,10}.
Figure 6 Performance of K-Nearest Neighbors (kNN) with k cross validations (k=2 to 10)
7 Results of the Study
The implementation involves employment of several software such as; WEKA version 3.6.4 software for performing the classification, and MatLab for feature
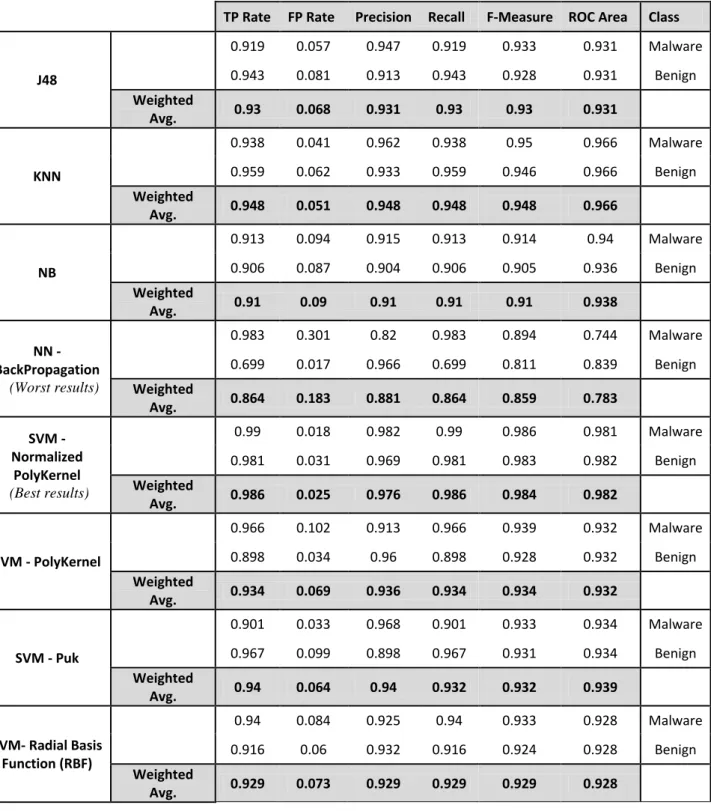
selection. Table 3 shows the effectiveness of different data mining approaches. We had applied k cross validation, with k={2,3,4,5,6,7,8,9,10} for each of the data mining algorithms, and we observed that with k = 10 most of the algorithms provided the best accuracy. By comparing the evaluation measures achieved by each of the data mining techniques, we observe that SVM - Normalized PolyKernel has performed the best, and NN-Backpropagation exhibited the worst results. This could be attributed to the fact that and NN-Backpropagation follows a heuristic path and usually converges only to locally optimal solutions and can suffer from muliple local minima, while SVM - Normalized PolyKernel always finds a unique global minimum. Through our experimental analysis we found that SVM-Normalized Polynomial Kernel provided an average of 98.5% true positive rate. With 99% true detection rate of malware as malware, the average weight for the false alarm rate achieved was about 0.025 in this case. Overall, SVM-Normalized Polynomial Kernel had outperformed all other classification methods in all measures, namely, TP Rate, FP Rate, Precision, Recall, F-Measure and ROC Area.
8 Conclusion
Countermeasures such as antivirus detectors are unable to detect new malware and are in search of employing effective techniques, since the latest new malware adopt obfuscations to evade detection. With an exponential growth in unknown malware arising from innumerable automated obfuscations, there is a need to establish malware detection methods that are robust and efficient. In this paper, we have proposed and developed a machine learning framework using eight different classifiers to detect unknown malware and to achieve high accuracy rate. In this work, iterative patterns based on Windows API calls have been used and statistical measures have been adopted to further improve the classification results. Our experiments conducted on large malware datasets have shown very promising results achieving more than 98.5% accuracy rate.
Overall, the salient achievements of the research reported in this paper are:
- The proposed machine learning framework has resulted in high accuracies in malware detection. This is attributed to the unique feature selection of API sequences and the development of a fully-automated system used for evaluating data mining algorithms on large datasets of unknown malware.
- The proposed system is efficient as it uses filter approaches to be able to successfully detect malware with a smaller feature set. The term frequency of reduced API feature set using SVM (normalised poly kernel) has performed the best among the eight classifiers evaluated in this study.
- The system is signature-free and does not require knowledge or detailed study about the API sequence of execution to classify a malware.
TABLE 3 Results
TP Rate FP Rate Precision Recall F-Measure ROC Area Class
J48 0.919 0.057 0.947 0.919 0.933 0.931 Malware 0.943 0.081 0.913 0.943 0.928 0.931 Benign Weighted Avg. 0.93 0.068 0.931 0.93 0.93 0.931 KNN 0.938 0.041 0.962 0.938 0.95 0.966 Malware 0.959 0.062 0.933 0.959 0.946 0.966 Benign Weighted Avg. 0.948 0.051 0.948 0.948 0.948 0.966 NB 0.913 0.094 0.915 0.913 0.914 0.94 Malware 0.906 0.087 0.904 0.906 0.905 0.936 Benign Weighted Avg. 0.91 0.09 0.91 0.91 0.91 0.938 NN - BackPropagation (Worst results) 0.983 0.301 0.82 0.983 0.894 0.744 Malware 0.699 0.017 0.966 0.699 0.811 0.839 Benign Weighted Avg. 0.864 0.183 0.881 0.864 0.859 0.783 SVM - Normalized PolyKernel (Best results) 0.99 0.018 0.982 0.99 0.986 0.981 Malware 0.981 0.031 0.969 0.981 0.983 0.982 Benign Weighted Avg. 0.986 0.025 0.976 0.986 0.984 0.982 SVM - PolyKernel 0.966 0.102 0.913 0.966 0.939 0.932 Malware 0.898 0.034 0.96 0.898 0.928 0.932 Benign Weighted Avg. 0.934 0.069 0.936 0.934 0.934 0.932 SVM - Puk 0.901 0.033 0.968 0.901 0.933 0.934 Malware 0.967 0.099 0.898 0.967 0.931 0.934 Benign Weighted Avg. 0.94 0.064 0.94 0.932 0.932 0.939 SVM- Radial Basis Function (RBF) 0.94 0.084 0.925 0.94 0.933 0.928 Malware 0.916 0.06 0.932 0.916 0.924 0.928 Benign Weighted Avg. 0.929 0.073 0.929 0.929 0.929 0.928 9 References
Alazab, M 2010, 'Static Analysis of Obfuscated Malware', in Annual Research Conference, Ballarat, p. 17.
Alazab, M, Layton, R, Venkatraman, S & Watters, P 2010, 'Malware Detection Based on Structural and Behavioural Features of API calls', in the 1st International Cyber Resilience Conference, Perth Western Australia, pp. 1-10.
Alazab, M, Venkatraman, S & Watters, P 2009, 'Effective digital forensic analysis of the NTFS disk image',
Ubiquitous Computing and Communication Journal, vol. 4, no. 1, pp. 551- 8.
Alazab, M, Venkatraman, S & Watters, P 2010, 'Towards Understanding Malware Behaviour by the Extraction of API Calls', in Cybercrime and Trustworthy Computing, Workshop, Ballarat, pp. 52-9.
Bhattacharyya, S.; Jha, S.; Tharakunnel, K.; Westland, J.C. 2011 'Data mining for credit card fraud: A comparative study', Decision Support Systems, vol. 50, Issue 3, pp. 602-613
Bruschi, D, Martignoni, L & Monga, M 2006, 'Detecting Self-mutating Malware Using Control-Flow Graph Matching', in R Büschkes & P Laskov (eds), Detection of Intrusions and Malware & Vulnerability Assessment, Springer Berlin / Heidelberg, vol. 4064, pp. 129-43.
Chang, H & Atallah, M 2002, 'Protecting Software Code by Guards', in T Sander (ed.), Security and Privacy in Digital Rights Management, Springer Berlin / Heidelberg, vol. 2320, pp. 125-41.
Choi, S, Park, H, Lim, H-i & Han, T 2009, 'A static API birthmark for Windows binary executables', Journal of Systems and Software, vol. 82, no. 5, pp. 862-73.
Ferrie, P & Szor, P 2001, 'Zmist opportunities', Virus Bulletin, pp. 6–7.
Frawley, W, Piatetsky-shapiro, G & Matheus, C 1992, 'Knowledge discovery in databases: An overview', Al Magazine, vol. 13, no. 3, pp. 213–28.
Hand, DJ, Mannila, H & Smyth, P 2001, Principles of data mining, The MIT press.
Kolter, JZ & Maloof, MA 2006, 'Learning to Detect and Classify Malicious Executables in the Wild', J. Mach. Learn. Res., vol. 7, pp. 2721-44.
Kuncheva, LI 2006, 'On the optimality of NaIve Bayes with dependent binary features', Pattern Recognition Letters, vol. 27, no. 7, pp. 830-7.
Linn, C & Debray, S 2003, 'Obfuscation of executable code to improve resistance to static disassembly', in 10th ACM conference on Computer and communications security Washington, DC, USA, pp. 290-9.
Malan, DJ & Smith, MD 2005, 'Host-based detection of worms through peer-to-peer cooperation', paper presented
to Proceedings of the 2005 ACM workshop on Rapid malcode, Fairfax, VA, USA.
MetaPHOR 2010, W32.Simile, Symantec Enterprise Security,,
<http://www.symantec.com/security_response/writeup.js p?docid=2002-030617-5423-99>.
Park, H, Choi, S, Lim, H-i & Han, T 2008a, 'Detecting code theft via a static instruction trace birthmark for Java methods', in International Conference on Industrial Informatics, Daejeon pp. 551-6.
Park, H, Choi, S, Lim, H-i & Han, T 2008b, 'Detecting Java Theft Based on Static API Trace Birthmark', in K Matsuura & E Fujisaki (eds), Advances in Information and Computer Security, Springer Berlin / Heidelberg, vol. 5312, pp. 121-35.
Perriot, F & Ferrie, P 2004, 'Principles and practise of x-raying', in Virus Bulletin Conference pp. 1- 17.
Rabek, JC, Khazan, RI, Lewandowski, SM & Cunningham, RK 2003, 'Detection of injected, dynamically generated, and obfuscated malicious code', paper presented to Proceedings of the 2003 ACM workshop on Rapid malcode, Washington, DC, USA.
RSA 2011, 'The Current State of Cybercrime and What to Expect in 2011', RSA 2011 cybercrime trends report.
Santos, I, Penya, YK, Devesa, J & Bringas, P 2009, 'N-grams-based file signatures for malware detection', in pp. 317–20.
Shankarapani, M, Kancherla, K, Ramammoorthy, S, Movva, R & Mukkamala, S 2010, 'Kernel machines for malware classification and similarity analysis', in The 2010 International Joint Conference on Neural Networks, Barcelona pp. 1-6.
Sharif, M, Yegneswaran, V, Saidi, H, Porras, P & Lee, W 2008, 'Eureka: A Framework for Enabling Static Malware Analysis', in S Jajodia & J Lopez (eds), Computer Security - ESORICS 2008, Springer Berlin / Heidelberg, vol. 5283, pp. 481-500.
Stolfo, S, Wang, K & Li, W-j 2005, 'Fileprints: Identifying File Types by n-gram Analysis', in IEEE Workshop on Information Assurance United States Military Academy, West Point, NY.
Sung, AH, Xu, J, Chavez, P & Mukkamala, S 2004, 'Static analyzer of vicious executables (SAVE)', in 20th Annual Computer Security Applications Conference, , Tucson, AZ, USA, pp. 326-34.
Symantec Enterprise Security 1997, 'Understanding Heuristics: Symantec‟s Bloodhound Technolog', Virus Bulletin, vol. XXXIV.
Symantec Enterprise Security 2009, 'Symantec Global Internet Security Threat Report Trends for 2008',
Symantec Enterprise Security, vol. XIV.
Symantec Enterprise Security 2010, 'Symantec Internet Security Threat Report: Trends for 2009', Symantec Enterprise Security, vol. XV.
Symantec Enterprise Security 2011, 'Symantec Internet Security Threat Report: Trends for 2010', Symantec Enterprise Security, vol. 16.
Tamada, H, Okamoto, K, Nakamura, M, Monden, A & Matsumoto, K-i 2006, 'Dynamic software birthmarks based on API calls', IEICE Transactions on Information and Systems, vol. 89, no. 8, pp. 1751-63.
Tang, K, Zhou, M-T & Zuo, Z-H 2010, 'An Enhanced Automated Signature Generation Algorithm for Polymorphic Malware Detection', Journal of Electronic Science and Technology, vol. 8, no. 2, pp. 114-21.
Venkatraman, S 2009, 'Autonomic Context-Dependent Architecture for Malware Detection', in e-Tech 2009, International Conference on e-Technology, Singapore, pp. 2927-47.
Venkatraman, S. (2010). Self-Learning Framework for Intrusion Detection, Proceedings of The 2010 International Congress on Computer Applications and Computational Science (CACS 2010), 4-6 December, Singapore, ISBN 978-981-08-6846-8, pp. 517-520.
VX Heavens 2011, VX Heavens Site, retrieved 2/3 2011, <http://vx.netlux.org/>.
Wang, C, Pang, J, Zhao, R, Fu, W & Liu, X 2009, 'Malware Detection Based on Suspicious Behavior Identification', in First International Workshop on Education Technology and Computer Science, Wuhan, Hubei, China, vol. 2, pp. 198-202.
Witten, H & Frank, E 2010, Data mining: Practical machine learning tools and techniques, 3.6.4 edn, San Francisco, CA, <http://www.cs.waikato.ac.nz/ml/weka/>.
Yanfang, Y, Tao, L, Qingshan, J & Youyu, W 2010, 'CIMDS: Adapting Postprocessing Techniques of Associative Classification for Malware Detection',
Systems, Man, and Cybernetics, Part C: Applications and Reviews, IEEE Transactions on, vol. 40, no. 3, pp. 298-307.
Ye, Y, Wang, D, Li, T & Ye, D 2007, 'IMDS: intelligent malware detection system', paper presented to Proceedings of the 13th ACM SIGKDD international conference on Knowledge discovery and data mining, San Jose, California, USA.