Procedia Computer Science 47 ( 2015 ) 45 – 51
1877-0509 © 2015 The Authors. Published by Elsevier B.V. This is an open access article under the CC BY-NC-ND license (http://creativecommons.org/licenses/by-nc-nd/4.0/).
Peer-review under responsibility of organizing committee of the Graph Algorithms, High Performance Implementations and Applications (ICGHIA2014) doi: 10.1016/j.procs.2015.03.182
ScienceDirect
Performance Analysis of Classifier Models to Predict Diabetes
Mellitus
J. Pradeep Kandhasamy*, S. Balamurali
Department of Computer Applications, Kalasalingam University, Krishnankoil -626126, Tamilnadu, India.
Abstract
Diabetes is one of the common and growing diseases in several countries and all of them are working to prevent this disease at early stage by predicting the symptoms of diabetes using several methods. The main aim of this study is to compare the performance of algorithms those are used to predict diabetes using data mining techniques. In this paper we compare machine learning classifiers (J48 Decision Tree, K-Nearest Neighbors, and Random Forest, Support Vector Machines) to classify patients with diabetes mellitus. These approaches have been tested with data samples downloaded from UCI machine learning data repository. The performances of the algorithms have been measured in both the cases i.e dataset with noisy data (before pre-processing) and dataset set without noisy data (after pre-processing) and compared in terms of Accuracy, Sensitivity, and Specificity.
© 2015 The Authors. Published by Elsevier B.V.
Peer-review under responsibility of organizing committee of the Graph Algorithms, High Performance Implementations and Applications (ICGHIA2014).
Keywords: J48Decision Tree; KNN algorithm; Random Forest; Support Vector Machines; Diabetes Mellitus;
1. Introduction
Diabetes is one of the major health problems of all over the world. Diabetes mellitus is classified into four broad categories: type 1, type 2, gestational diabetes and other specific types. All forms of diabetes increase the risk of long-term complications. These typically develop after many years (10–20), but may be the first symptom in those who have otherwise not received a diagnosis before that time. The criteria for diagnosing diabetes in pregnancy have been given the World Health Organization (WHO) in 2006. The criteria are as follows,
x fasting plasma glucose ≥ 7.0 mmol/l (126 mg/ dl)
x 2-hour plasma glucose ≥ 11.1 mmol/l (200 mg/dl) following a 75g oral
x glucose load
x random plasma glucose ≥ 11.1 mmol/l (200 mg/ dl) in the presence of diabetes symptoms.
Diagnostic criteria for diabetes in non-pregnant individuals are based on the relationship between plasma glucose values and the risk of diabetes-specific Micro vascular complications [1]. People with diabetes © 2015 The Authors. Published by Elsevier B.V. This is an open access article under the CC BY-NC-ND license
(http://creativecommons.org/licenses/by-nc-nd/4.0/).
Peer-review under responsibility of organizing committee of the Graph Algorithms, High Performance Implementations and Applications (ICGHIA2014)
have an increased risk of developing a number of serious health problems. Consistently high blood glucose levels can lead to serious diseases affecting the heart and blood vessels, eyes, kidneys, nerves and teeth. In addition, people with diabetes also have a higher risk of developing infections. In almost all developed countries, diabetes is a leading cause of cardiovascular disease, blindness, kidney failure, andlower limb amputation. [2]. Now it is very important to develop predictive models using the risk factors for the development of diabetes. Many studies have suggested traditional methods (statistical) as predictors [3] [4].
Data mining predicts the future by modelling. Predictive modelling is the process by which a model is created to predict an outcome. The data mining process for diagnosis of diabetes can be divided into five steps, though the underlying principles and techniques used for data mining diabetic data bases may differ for different projects in different countries [5]. Data mining is one of the "Knowledge Discovery in Databases" processes. The overall goal of the data mining process is to extract information from a data set and transform it into an understandable structure for further use. This process has become an increasingly pervasive activity in all areas of medical science research. Data mining problems are often solved using different approaches from both computer sciences, such as multi-dimensional databases, machine learning, soft computing and data visualization; and statistics, including hypothesis testing, clustering, classification, and regression techniques. In recent years, data mining has been used widely in the areas of science and engineering, such as bioinformatics, genetics, medicine, and education.
2. Proposed Work
The following algorithms are considered for our comparison analysis for prediction of diabetes. a. Decision Tree J48.
b. KNN Classifier. c. Random Forest.
d. Support Vector Machine.
a. Decision Tree J48
The J48 Decision tree classifier follows the simple algorithm shown below. In order to classify a new item, it first needs to create a decision tree based on the attribute values of the available training data. The Pseudo code of J48
1) Check for base cases 2) For each attribute a
a) It checks for normalized information gain on a.
3) Amount the best information gain of the attribute a_best it selects the attribute which has highest information gain.
4) It creates a decision node with that attribute.
5) This process is repeated with sub list of the nodes and added to its child node.
b. KNN Classifier
K Nearest Neighbors (KNN) is a simple algorithm that stores all available cases and classifies new cases based on a similarity measure (e.g., distance functions). A case is classified by a majority vote of its neighbors, with the case being assigned to the class most common amongst its KNN measured by a distance function. The Euclidean distance between two points x and y is given by the equation
Euclidean = 2 1
)
(
¦
k i i iy
x
(1)The value of k (the positive integer) is determined by inspecting the data set. Cross-validation is another way to retrospectively determine a good k value by using an independent data set to validate the k. Here we have taken the values (k =1, 3 and 5) and it produces good result at k =5. This implies that the k value gets larger the result will be more accurate. In most cases the optimal k value will be between 3 and 10.
c. Random Forest
Random forest algorithm is the statistical and machine learning algorithm which uses multiple learning algorithms to obtain better predictive performance than others. This algorithm has two parts
a. Tree bagging
b. From tree bagging to random forest Each tree is grown as follows:
1. If the number of cases in the training set is N, sample N cases at random - but with replacement, from the original data. This sample will be the training set for growing the tree.
2. If there are M input variables, a random number of attributes are selected and the best split used to split the node. The value of M is held constant during the forest growing. 3. Each tree is grown to the largest extent possible. There is no pruning.
d. Support Vector Machine
Support Vector Machine (SVM) can also be used as a regression method, maintaining all the main features that characterize the algorithm (maximal margin). The main function of this algorithm is to predict the class membership for categorical target by tasks by constructing hyper planes in a multidimensional space that separates cases of different class labels.
SVM supports maximum prediction accuracy that avoids over fit and it also supports text data and sparse transactional data. The SVM provides empirically good performance in the field of bioinformatics, text and image recognition. The SVM is primarily a classier method that performs classification. The SVM supports both regression and classification tasks and can handle multiple continuous and categorical variables.
3. Experimental Setup and Results
To analyse the performance of classifiers, a series of experiments on University of California Irvine (UCI) machine learning data repository for diabetes mellitus is taken.
a. Data preparation
The data set we have taken from the URL http://mldata.org/repository/data/viewslug/datasets-uci-diabetes . The data set has totally 8 attributes and 1 predicted class. They are
2. Plasma glucose concentration (glucose tolerance test)
3. Diastolic blood pressure (mm Hg)
4. Triceps skin fold thickness (mm)
5. 2-Hour serum insulin (mu U/ml)
6. Body mass index (weight in kg/(height in m)^2)
7. Diabetes pedigree function
8. Age (years)
9. Class variable (0 or 1)
In class distribution, the class value 1 is interpreted as “Tested Positive for Diabetes” and class value 0 for “Tested Negative for Diabetes”.
The tool we used for our experiment is Waikato Environment for Knowledge Analysis (WEKA) in Windows XP and our results are compared in it.
b. Evaluation Measures
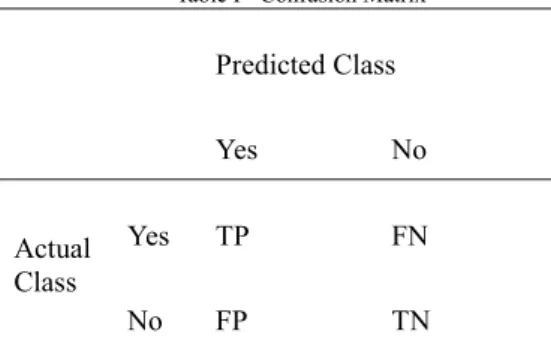
The criteria taken for our comparison of classifier are Accuracy, Sensitivity and Specificity. For calculating these criteria we used the confusion matrix in our calculation process. The
general view of
confusion matrix is given below.Table I - Confusion Matrix Predicted Class Yes No Actual Class Yes TP FN No FP TN
In confusion matrix the predicted class is the class that is predicted by the classifier and the actual class is the class that is given in the data set.
True Positive (TP) denotes number of records that are correctly classified. True Negative (TN) denotes number of valid records that are correctly classified False Negative (FN) indicates that the records are incorrectly classified.
False Positive (FP) indicates that the records are incorrectly classified as positive.
From the confusion matrix the accuracy, sensitivity and specificity are calculated as follows.
ܣܿܿݑݎܽܿݕ ൌ
்ା்ே ்ା்ேାிାிே (2)ܵ݁݊ݏ݅ݐ݅ݒ݅ݐݕ ൌ
் ்ାிே (3)
݂ܵ݁ܿ݅݅ܿ݅ݐݕ ൌ
்ே்ேାி (4)
c. Result- 1
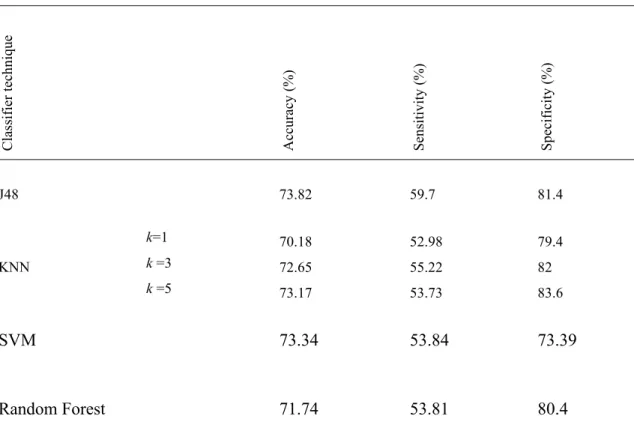
In our work, four classifier techniques are proposed for classifying the diabetes mellitus. The classifier are trained and tested and the results obtained are recorded. Here a comparison is made to find which classifier is the best for classification when the dataset is noisy.
From Table II we observe that the classifier J48 achieves more accuracy than other two classifiers. Another finding from above table is that KNN achieves better accuracy when the k value has been increased and it gives better accuracy when the k value is between 3 and 10.
d. Result – 2
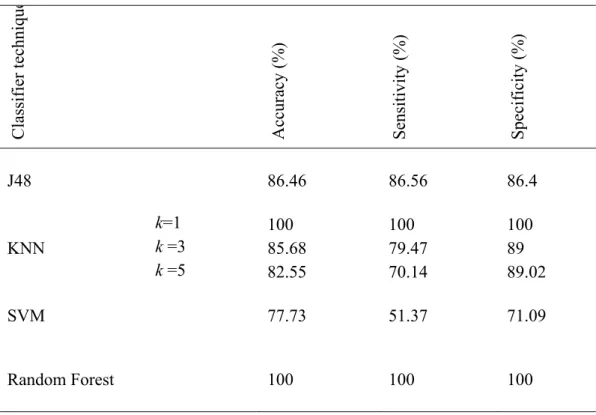
In the above result the dataset contain some inconsistent data (ie noisy data). Now that noisy data have been under gone with data pre processing technique using the filter Replace with missing values. In this technique the zero values in our dataset have been treated as missing values except in the attribute 1 and all other have been replaced by mean and median values using the k-mean clustering algorithm and the comparison is made .
From Table III we observe that KNN (k=1) and random forest achieves more accuracy than other classifiers.
Table II - Comparison Results of Classifiers with Noisy Data
Clas
sifier tech
nique
Accuracy (%) Sensitivity (%) Specificity (%)
J48 73.82 59.7 81.4 KNN k=1 70.18 52.98 79.4 k =3 72.65 55.22 82 k =5 73.17 53.73 83.6
SVM
73.34
53.84
73.39
Random Forest
71.74
53.81
80.4
Table III - Comparison Results of Classifiers without Noisy Data
Classifier technique
Accur
acy (
%
)
Sensitivity (%)
Specificity (%
)
J48
86.46
86.56
86.4
KNN
k
=1
100
100
100
k
=3
85.68
79.47
89
k
=5
82.55
70.14
89.02
SVM
77.73
51.37
71.09
Random Forest
100
100
100
4. ConclusionsIn summary, we have compared four prediction models for predicting diabetes mellitus using 8 important attributes under two different situations. One is before pre-processing the dataset. Here the studies conclude that the decision tree J48 classifier achieves higher accuracy of 73.82 % than other three classifiers. In other case that is after pre-processing the dataset we have more accurate result when compared to the first study. In this case, both KNN (k=1) and Random Forest performance much better than the other three classifiers and they provide 100% accuracy. From this we can come to know that after removing the noisy data from our dataset it will provide good result for our problems .This study can be used to select best classifier for predicting diabetes. In future we can use this type of study for any other diseases with their suitable data sets.
Reference
1) Diagnostic Criteria and Classification of Hyper glycaemia First Detected in Pregnancy– WHO Publications,2013
2) The International Diabetes Federation (IDF) [Internet]. http://www.idf.org/complications-diabetes.
3) Jia Z, Zhou Y, Liu X, Wang Y, Zhao X, Wang Y, Liang W, Wu S. Comparison of Different Anthropometric Measures as Predictors of Diabetes Incidence in a Chinese Population. Diabetes Research and Clinical Practice, 2011; 92:267-271.
4) Encyclopedia of Data Warehousing and Mining, Edited by John Wang- Idea Group Publishing, PCK Edition 2005.
5) Lily T, Hossein M, Omid H, Jalal P. Real-Data Comparison of Data Mining Methods in Prediction of Diabetes in Iran.
6) Mehta SR, Kashyap AS, Das S. Diabetes Mellitus in India: The Modern Scourge, Medical Journal Armed Forces India, 2009; 65:50-54.
7) Karthikeyani V,Parvin Begum I,Tajudin K,Shahina Begam I Comparative of Data Mining Classification Algorithm (CDMCA) in Diabetes Disease Prediction, International Journal of Computer Applications, 2012; 60:26-31.
8) Olaiya F. Comparative Study of Different Data Mining Techniques Performance in Knowledge Discovery from Medical Database, International Journal of Advanced Research in Computer Science and Software Engineering, 2013; 3:11-15.
9) Nirmala Devi M, Appavu alias Balamurugan S, Swathi UV. An Amalgam KNN to Predict Diabetes Mellitus, IEEE International Conference on Emerging Trends in Computing, Communication and Nanotechnology (ICECCN 2013).