Behaviour Profiling for Mobile
Devices
by
Fudong Li
A thesis submitted to the Plymouth University in partial fulfilment for the degree of
DOCTOR OF PHILOSOPHY
ii
Copyright Statement
This copy of the thesis has been supplied on condition that anyone who consults it is understood to recognise that its copyright rests with its author and that no quotation from the thesis and no information derived from it may be published without the author's prior consent.
iii Abstract
Behaviour Profiling for Mobile Devices Fudong Li
With more than 5 billion users globally, mobile devices have become ubiquitous in our daily life. The modern mobile handheld device is capable of providing many multimedia services through a wide range of applications over multiple networks as well as on the handheld device itself. These services are predominantly driven by data, which is increasingly associated with sensitive information. Such a trend raises the security requirement for reliable and robust verification techniques of users.
This thesis explores the end-user verification requirements of mobile devices and proposes a novel Behaviour Profiling security framework for mobile devices. The research starts with a critical review of existing mobile technologies, security threats and mechanisms, and highlights a broad range of weaknesses. Therefore, attention is given to biometric verification techniques which have the ability to offer better security. Despite a large number of biometric works carried out in the area of transparent authentication systems (TAS) and Intrusion Detection Systems (IDS), each have a set of weaknesses that fail to provide a comprehensive solution. They are either reliant upon a specific behaviour to enable the system to function or only capable of providing security for network based services. To this end, the behaviour profiling technique is identified as a potential candidate to provide high level security from both authentication and IDS aspects, operating in a continuous and transparent manner within the mobile host environment.
This research examines the feasibility of a behaviour profiling technique through mobile users general applications usage, telephone, text message and multi-instance application usage with the best experimental results Equal Error Rates (EER) of 13.5%, 5.4%, 2.2% and 10% respectively. Based upon this information, a novel architecture of Behaviour Profiling on mobile devices is proposed. The framework is able to provide a robust, continuous and non-intrusive verification mechanism in standalone, TAS or IDS modes, regardless of device hardware configuration. The framework is able to utilise user behaviour to continuously evaluate the system security status of the device. With a high system security level, users are granted with instant access to sensitive services and data, while with lower system security levels, users are required to reassure their identity before accessing sensitive services.
The core functions of the novel framework are validated through the implementation of a simulation system. A series of security scenarios are designed to demonstrate the effectiveness of the novel framework to verify legitimate and imposter activities. By employing the smoothing function of three applications, verification time of 3 minutes and a time period of 60 minutes of the degradation function, the Behaviour Profiling framework achieved the best performance with False Rejection Rate (FRR) rates of 7.57%, 77% and 11.24% for the normal, protected and overall applications respectively and with False Acceptance Rate (FAR) rates of 3.42%, 15.29% and 4.09% for their counterparts.
iv
Contents
List of Figures ... vii
List of Tables ...x
Acknowledgement ... xiii
Author’s Declaration ... xiv
1 Introduction & Overview ... 15
1.1 Introduction ... 15
1.2 Aims and objectives ... 17
1.3 Thesis structure ... 18
2 The evolution of Mobile Devices ... 20
2.1 Introduction ... 20
2.2 Mobile communication technologies and mobile devices ... 20
2.2.1 Mobile cellular technologies ... 20
2.2.2 Other mobile communication technologies... 23
2.2.3 Mobile devices ... 25
2.3 Mobile device security threats ... 29
2.3.1 Mobile service fraud ... 30
2.3.2 Denial of Service attack ... 30
2.3.3 Mobile malware ... 31
2.3.4 Social engineering attack ... 33
2.3.5 Loss or theft of the device ... 33
2.4 Mobile security controls ... 34
2.4.1 Authentication ... 35
2.4.2 Mobile Antivirus solutions ... 36
2.4.3 Mobile Firewall products... 36
2.4.4 Mobile Encryption ... 37
2.4.5 Battery monitoring based mobile IDS ... 37
2.5 Conclusion ... 39
3 Review of Biometric Authentication ... 41
3.1 Introduction ... 41
3.2 An introduction of the biometric system ... 41
v
3.2.2 Biometric system performance measurement factors ... 45
3.2.3 Biometric system requirement ... 47
3.3 Biometric characteristics ... 47
3.3.1 Physiological biometrics ... 48
3.3.2 Behavioural biometrics ... 56
3.4 Biometric approaches applicable for use on a mobile device ... 64
3.5 Literature review on behaviour profiling ... 68
3.5.1 Telephony service based mobile IDS ... 68
3.5.2 Migration based mobile IDS ... 70
3.5.3 Comparison of behaviour based mobile IDS ... 73
3.6 Conclusion ... 73
4 Behavioural Profiling on Mobile Devices ... 75
4.1 Introduction ... 75
4.2 Methodology ... 76
4.2.1 Dataset ... 76
4.2.2 Procedure ... 79
4.3 The results ... 81
4.3.1 A Descriptive statistics study ... 81
4.3.2 A preliminary study on telephony activity ... 97
4.3.3 Behaviour profiling on mobile applications ... 103
4.4 Discussion ... 112
4.5 Conclusion ... 114
5 A Novel Framework for Behaviour Profiling on Mobile Devices ... 116
5.1 Introduction ... 116
5.2 A Novel Behaviour Profiling Framework ... 116
5.3 Processing Engines ... 117
5.3.1 Data Collection Engine ... 118
5.3.2 Behaviour Profile Engine ... 121
5.3.3 Behaviour Classification Engine ... 126
5.3.4 Communication Engine ... 129
5.4 Security Status Module ... 131
5.5 Inventory database ... 134
vi
5.6.1 Standalone mode ... 136
5.6.2 Dependent mode ... 139
5.7 Conclusion ... 141
6 Evaluation of the Behaviour Profiling Framework ... 143
6.1 Introduction ... 143
6.2 Simulation Implementation ... 143
6.3 Simulation process ... 145
6.3.1 Simulation results – Scenario A ... 146
6.3.2 Simulation results – Scenario B ... 147
6.3.3 Simulation results – Scenario C ... 148
6.3.4 Simulation results – Scenario D ... 150
6.4 Discussion ... 152
6.5 Conclusion ... 154
7 Conclusions and Future Work ... 155
7.1 Achievements of the research ... 155
7.2 Limitations of the research project ... 157
7.3 Suggestions & Scope for Future Work ... 158
7.4 The Future of Verification for Mobile Devices ... 159
References ... 160
Appendix A: The MIT Reality dataset ... 175
Appendix B: The Neural Networks and the rule-based classifiers scripts ... 175
Appendix C: The simulation scripts ... 175
Appendix D: The preliminary study’s experimental results ... 175
Appendix E: The final experimental results ... 175
Appendix F: Publications ... 175
Misuse Detection for Mobile Devices Using Behaviour Profiling ... 175
Behaviour Profiling for Transparent Authentication for Mobile Devices ... 175
Behaviour Profiling on Mobile Devices ... 175
vii
List of Figures
Figure 2.1: 3G: Cumulative network launches worldwide ... 22
Figure 2.2: Wi-Fi market projections 2005-2012 ... 23
Figure 2.3: Mobile communication technologies data rate vs. mobility ... 25
Figure 2.4: Consumer mobile platform activities 2011 ... 29
Figure 2.5: The distribution of malware by platform ... 32
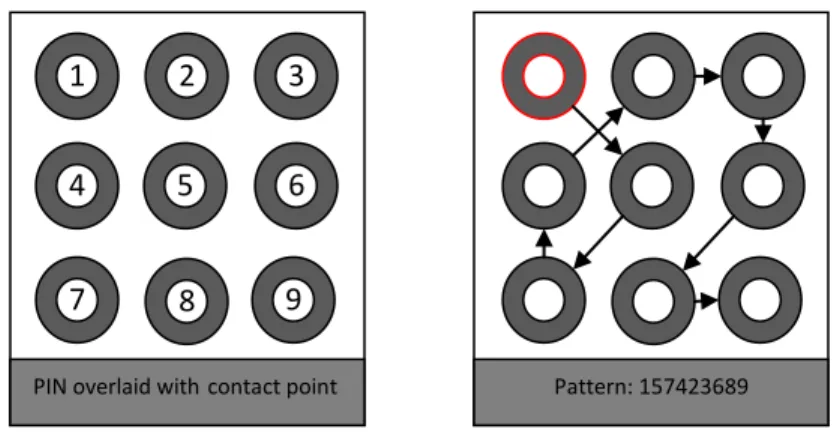
Figure 2.6: An example of Android password pattern ... 36
Figure 3.1: A generic biometric system ... 42
Figure 3.2: A biometric verification process ... 44
Figure 3.3: A biometric identification process ... 45
Figure 3.4: Mutually Exclusive Relationship between FAR/FRR ... 46
Figure 3.5: An anatomical sketch of a human ear ... 49
Figure 3.6: An example of face recognition ... 50
Figure 3.7: An example of human face thermo image ... 51
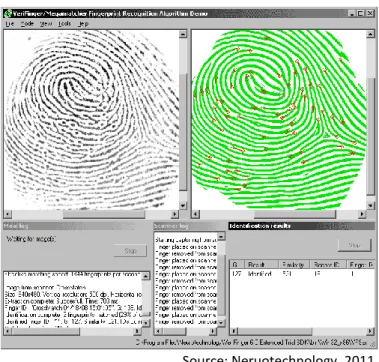
Figure 3.8: An example of Fingerprint Recognition ... 52
Figure 3.9: An example of hand geometry scanner ... 54
Figure 3.10: An example of a human eye ... 55
Figure 3.11: An example of palm scanner ... 56
Figure 3.12: BlackBerry and iPhone average Application Usage comparison... 57
Figure 3.13: Gait cycle ... 58
Figure 3.14: An example of a handwritten signature on a computing device ... 59
Figure 3.15: An example of keystroke analysis ... 60
Figure 3.16: Biometric Revenues by Technology ... 63
Figure 3.17: Biometric Industry Revenues ... 63
Figure 3.18: Biometric approaches on a mobile device ... 64
Figure 3.19: A generic TAS framework ... 67
Figure 4.1: Behaviour profiling system functions flow diagram ... 80
Figure 4.2: The three classifiers being employed ... 80
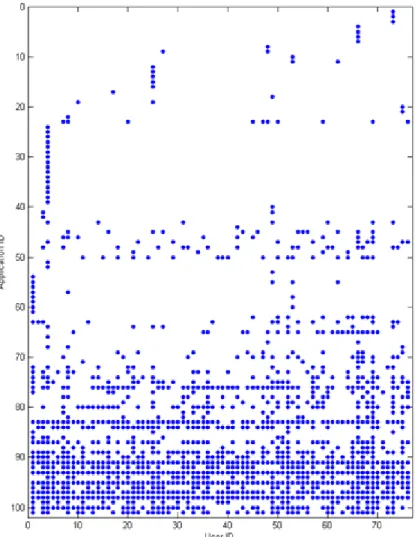
Figure 4.3: Users with their applications ... 82
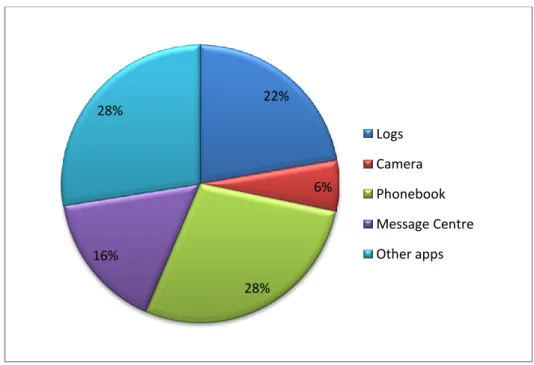
Figure 4.4: Overview of intra-standard application usage ... 83
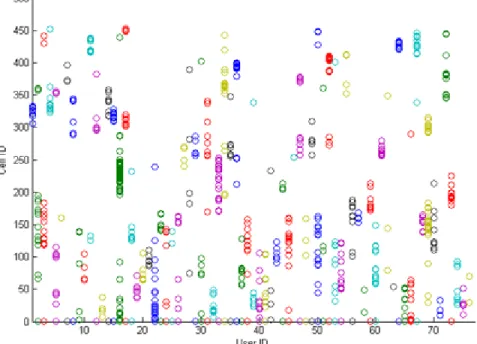
Figure 4.5: The location comparison for all users’ camera application usage ... 84
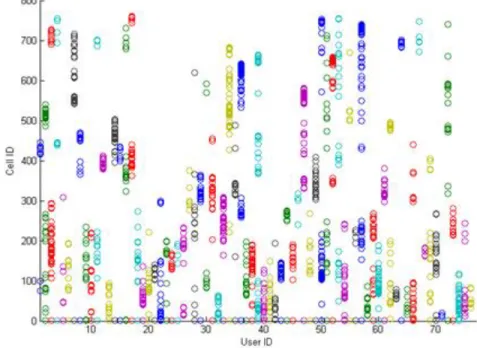
Figure 4.6: The location comparison for all users’ logs application usage... 85
viii
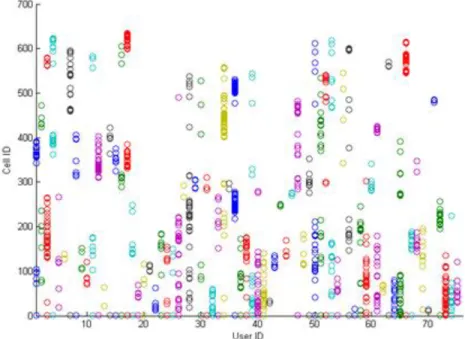
Figure 4.8: The location comparison for all users’ phonebook application usage ... 87
Figure 4.9: The time of accessing comparison for users’ camera application usage ... 88
Figure 4.10: The time of accessing comparison for users’ logs application usage ... 88
Figure 4.11: The time of accessing comparison for users’ message centre application usage ... 89
Figure 4.12: The time of accessing comparison for users’ phonebook application usage ... 89
Figure 4.13: Users telephony location usage comparison ... 90
Figure 4.14: Users telephony telephone number usage comparison ... 91
Figure 4.15: Users telephony time of calling comparison ... 92
Figure 4.16: Users telephony duration of calling comparison ... 93
Figure 4.17: A cumulative distribution for all users’ telephone call duration ... 93
Figure 4.18: Location usage comparison of users’ text message ... 94
Figure 4.19: Users text message telephone number usage comparison ... 95
Figure 4.20: Users text message time of sending comparison ... 96
Figure 4.21: FAR-FRR plot for the RBF network performance (Inputs: telephone number and location with 75 neurons) ... 98
Figure 4.22: FAR-FRR plot for the FF MLP network performance (Inputs: telephone number and location with 150 neurons) ... 99
Figure 4.23: FAR-FRR plot for the performance of the rule-based approach ... 101
Figure 4.24: FAR-FRR plot for intra-standard applications with the dynamic 14 day profile with 1 application entry ... 104
Figure 4.25: FAR-FRR plot for intra-standard applications with the dynamic 14 day profile with 6 application entries ... 105
Figure 4.26: FAR-FRR plot for the telephone call application with the dynamic 14 day profile with 1 telephone call entry ... 106
Figure 4.27: FAR-FRR plot for the telephone call application with the dynamic 14 day profile with 6 telephone call entries ... 107
Figure 4.28: FAR-FRR plot for the text messaging application with the dynamic 14 day profile with 1 text message entry ... 108
Figure 4.29: FAR-FRR plot for the text messaging application with the dynamic 14 day profile with 3 text message entries ... 109
Figure 4.30: FAR-FRR plot for multi-instance applications with the dynamic 10 day profile with 1 application entry ... 111
ix
Figure 4.31: FAR-FRR plot for multi-instance applications with the dynamic 10 day profile with 6
application entries ... 111
Figure 5.1: A novel Behaviour Profiling Framework ... 117
Figure 5.2: Data Collection Engine ... 118
Figure 5.3: Behaviour Profile Engine ... 122
Figure 5.4: Behaviour Classification Engine ... 127
Figure 5.5: the verification requirement checking processes of the Behaviour Profiling Engine ... 128
Figure 5.6: Communication Engine ... 130
Figure 5.7: The SS level calculation process ... 133
Figure 5.8: The SS level degradation function ... 133
Figure 5.9: Security Manager: Process Algorithm ... 137
Figure 5.10: TAS two tier authentication approach ... 140
x
List of Tables
Table 2.1: The evolution of cellular mobile communication technologies ... 21
Table 2.2: 3G services with their QoS requirements... 22
Table 2.3: Mobile device (2010) VS PC (2001) ... 26
Table 2.4: Examples of App stores in 2011 ... 26
Table 2.5: Applications with their risk scores... 27
Table 2.6: Examples of mobile services... 28
Table 2.7: Example of Mobile malware and its effects ... 32
Table 2.8: A summary of battery based mobile IDS ... 38
Table 2.9: Mobile security mechanisms vs. Mobile security threats ... 39
Table 3.1: A brief comparison on biometrics approaches ... 62
Table 3.2: Biometric approaches on mobile devices ... 68
Table 3.3: A review of mobile behaviour profiling ... 73
Table 4.1: The MIT Reality dataset ... 77
Table 4.2: The final dataset on intra-standard applications ... 78
Table 4.3: The final dataset on telephony service ... 78
Table 4.4: The final dataset on text messaging service... 79
Table 4.5: The cell comparison for User 22 and User 40’s camera application usage ... 84
Table 4.6: The cell comparison for User 43 and User 50’s logs application usage ... 85
Table 4.7: The cell comparison for User 59 and User 73’s message centre application usage ... 86
Table 4.8: The Cell comparison for User 41 and User 66’s phonebook application usage ... 87
Table 4.9: Telephony location usage comparison for user 20 and user 36 ... 90
Table 4.10: Telephone number usage comparison for user 20 and user 36 ... 91
Table 4.11: The location usage comparison for user 3’s and user 12’s text messaging service ... 94
Table 4.12: Text message telephone number usage comparison for user 6 and user 12 ... 95
Table 4.13: The best RBF network configurations with various features ... 98
Table 4.14: The best FF MLP network configurations with various features ... 99
Table 4.15: Experimental results by employing the rule-based approach ... 100
Table 4.16: Individual application features towards to the classification result ... 101
Table 4.17: Experimental results for intra-standard applications... 104
Table 4.18: Selected users’ performance for intra-standard applications, employing the best classifier configurations ... 105
xi
Table 4.19: Experimental results for the telephone call application ... 106
Table 4.20: Selected users’ performance for the telephone call application by employing the best classifier configuration ... 107
Table 4.21: Experimental results for the text messaging application ... 108
Table 4.22: Selected users’ performance for the text messaging application with the dynamic 14 day profile and 3 log entries ... 109
Table 4.23: Experimental results for multi-instance applications... 110
Table 4.24: Selected users’ performance for multi-instance applications with the dynamic 10 day profile and 6 log entries ... 112
Table 4.25: The behavioural techniques performance within the mobile device environment .... 114
Table 5.1: Applications record ... 118
Table 5.2: Temporary Storage ... 120
Table 5.3: Application Features Record ... 121
Table 5.4: Behavioural Input Data ... 121
Table 5.5: Application Category ... 121
Table 5.6: Application name ... 121
Table 5.7: Application Features ... 121
Table 5.8: Behaviour Template ... 123
Table 5.9: Behaviour Audit Log ... 124
Table 5.10: Smoothing Function ... 125
Table 5.11: Application Performance Factor ... 132
Table 5.12: System Security levels ... 134
Table 5.13: User’s information ... 135
Table 5.14: Three main checking stages ... 136
Table 6.1: Four scenarios for the simulation process ... 146
Table 6.2: Simulation results of scenario A for legitimate users ... 147
Table 6.3: Simulation results of scenario A for imposters ... 147
Table 6.4: Simulation results of scenario B for legitimate users ... 148
Table 6.5: Simulation results of scenario B for imposters ... 148
Table 6.6: Simulation results of scenario C for legitimate users ... 149
Table 6.7: Simulation results of scenario C for imposters ... 149
Table 6.8: Simulation results of scenario D for legitimate users ... 150
xii
Table 6.10: The statistic on the smoothing function usage for all four scenarios ... 151 Table 6.11: The statistic on the usage of the “check if there are any applications not being
xiii
Acknowledgement
The research project was made possible due to the full scholarship funding provided by Plymouth University and the pleasant facility offered by the Centre for Security, Communication and Network Research (CSCAN), Plymouth University, UK. I wish to thank both organisations for their support.
This PhD work would not have been possible without the guidance and help of my Director of Studies, Associate Professor Nathan L Clarke. Thanks go to him for his tireless support and inspiring advice throughout the PhD process, from conducting experiments to publishing research papers.
Thanks must also go to my other supervisors, Dr Maria Papadaki and Associate Professor Paul Dowland, who provided invaluable help and guidance throughout my PhD journey, and spent significant amount of time for proof reading research papers and my thesis.
Thanks also go to my fellow researchers within the CSCAN group (especially Mr Christopher Hocking) for their support and interesting discussions.
Finally, I would like to thank my parents who spiritually and financially supported me for my student life. Also, I wish to thank my beloved wife for her endless care, support and encouragement.
xiv
Author’s Declaration
At no time during the registration for the degree of Doctor of Philosophy has the author been registered for any other University award without prior agreement of the Graduate Committee.
This study was financed with the aid of scholarship from Faculty of Science and Technology, Plymouth University, Plymouth, United Kingdom.
Relevant seminars and conferences were regularly attended at which work was often presented and several papers were published in the course of this research project.
Word count of main body of thesis: 45,701 words
Signed……… Date………
15
1
Introduction & Overview
1.1
Introduction
Whilst the term mobile devices can refer to a variety of devices, such as mobile phones, laptops and games consoles, the mobile phone and its variants form the largest market segment. In this thesis, the phrase ‘mobile device’ describes two kinds of mobile computing devices: the standard mobile phone and the Smartphone. After almost 40 years of development, the mobile device has transformed from a purely telephony based handset into a multimedia and multi-networking computing device. Currently, with more than 5 billion subscribers around the world, the mobile device has become a ubiquitous object within our daily life (GSM World, 2011). People can utilise it to complete various tasks, such as making telephone calls, surfing the Internet, checking emails, transferring money, playing games, viewing documents and storing information; to name but a mere fraction of the functionality and applications available.
In order to accommodate these services, the mobile device has become incredibly powerful in terms of processing power, networking ability and data storage. Some mobile device Central Processing Units (CPU) clock up to 1.5 GHz allowing many complex programs (e.g. high definition games) to be run smoothly on them (Qualcomm, 2010). With the availability of various wireless technologies such as Wi-Fi and NFC (Near Field Communication), people can utilise many network-based services in additional to telephony and text messaging. For instance, by using a Wi-Fi network, a mobile device user can access web pages, check emails and shop online. At the start of 2011, over 50% of mobile users (more than 2.5 billion) connected to the Internet via a Wi-Fi connection (Cabume, 2011). Moreover, in 2011 the total number of mobile devices connecting with Wi-Fi networks overtook the number of laptops accessing the same resource (GigaOM, 2011). As the JiWire Mobile Audience Insights Report suggested, 47% of all mobile device users use the Internet as their primary source for online shopping in the US (JiWire, 2009). According to a survey conducted by the Internet Advertising Bureau (IAB), over 23 million people use their mobile devices to make online purchases in the UK (Newbusiness, 2010). The latest BRC-Google retail monitor found that mobile online shopping increased by 27% in the second quarter of 2011 (Walesonline, 2011). Another example is that the mobile device can be transformed into a mobile wallet that enables people to pay for goods directly from their handset by connecting with a NFC payment device. In the UK, the mobile operator Orange launched the first mobile payment service which allows their customers to buy food in superstores imitating a service that has been used in
16
Japan and Korea for many years (BBC, 2011). According to the Juniper Research, mobile payment via NFC will generate $50 billion of revenue by 2014 around the world (Knowyourmobile, 2011). Being equipped with internal memory and other an external micro Secure Digital (SD) card, the storage capability of the mobile device has increased significantly. Today, a typical mobile device has a data capacity of up to 32 GigaBytes (GB) enabling a large amount of information, such as text messages, calendar entries, pictures, Word documents, to-do lists and emails, to be stored. A number of studies have demonstrated that such information is highly likely to be related to personal, financial or business data. Which? Mobile (2011) showed that 13.5 million UK mobile users stored personal information (e.g. date of birth) on the device. Also, Regenersis’ study revealed that 99% of 2,000 randomly selected mobile devices contained some amount of personal data (Regenersis, 2009). Moreover, the Smartphone IT security survey of Kaspersky Lab showed that approximately 33% of the 1,600 surveyed stored login credentials (i.e. user name and password) for accessing personal and business email accounts on their mobile devices (Kaspersky Lab, 2011a). The mobile and security report of McAfee also indicated that more than 20% of organisations’ employees store business critical data, such as customer data, corporate intellectual property or financial information on their mobile device (McAfee, 2011b).
While people enjoy the convenience provided by the mobile device, the services and the information stored on the device pose an increasing threat to the owners when a device is misused, such as being lost or stolen or infected by malware. According to the Metropolitan Police (2011) website there are more than 10,000 mobile devices lost or stolen in London every month. Traditionally, the cost of the hardware was the driving factor for theft. However, the increased functionality and access to information could drive the prime motivation towards information theft. By using the services and information, malicious users can abuse the mobile devices in many ways. For instance, buy goods in a shop or online at the owner’s expense, review the personal information and eventually steal the owner’s identity (Helium, 2008). If a stolen device belongs to a company, malicious users could sell the information stored on the device to its competitors; also, by using the device as a gateway, malicious users could harvest more information from the company internal network. Since the first mobile virus ‘Cabir’ was reported in 2004 (BBC, 2004), over 1,000 unique variants were already identified by the end of 2010 (Kaspersky Lab, 2011b). These malware attack mobile devices regardless of platform and may cause severe damage, such as disabling mobile services, sending text messages to a premium rate service or stealing data (Securelist, 2009). Therefore, it is mission critical to protect the mobile device from being misused.
17
Currently, the most popular mobile device access control is the password or Personal Identification Number (PIN) based authentication approach. This technique requires users to provide a correct PIN before gaining access to the mobile device regardless of their legitimacy. Although this approach is mostly available on mobile devices, a survey conducted by Credant demonstrated that alarmingly 40% of their participants failed to utilise this simple point-of-entry security mechanism (Credant, 2009). Even if all mobile users employed this technique on their devices possible misuse could still occur if they did not use it properly in practice, such as never changing the PIN, writing the PIN on a paper or sharing the PIN with others (Clarke and Furnell, 2005; Kurkovsky and Syta, 2010). To protect the mobile device against malware attacks a number of mobile antivirus and firewall software are already commercially available. However, as they are heavily reliant upon the latest signatures to detect malware presence they are not effective against zero day attacks. Besides, their ability to detect user related misuse such as viewing calendar events or modifying documents is limited. To date, only behaviour based network Intrusion Detection Systems (IDS) are capable of detecting mobile users’ abnormal activities (i.e. telephony service fraud) (Samfat and Molva, 1997; Gosset, 1998; Sun et al, 2006). This has not been a big issue as the mobile device could only access service providers’ networks and offer telephony and text messaging services. However, as the modern mobile device can now access multiple networks and provides a wide range of host based services a more sophisticated method which can provide continuous protection for all the mobile services is needed.
1.2
Aims and objectives
The aim of this research is to propose a behavioural profiling security framework for mobile devices which is capable of fulfilling the increased security requirements and providing continuous protection to ensure the legitimacy of the current user. Also, the framework would work in three distinct modes: a standalone security control (standalone mode), a transparent authentication mechanism (Transparent Authentication System (TAS) mode) and a misuse detector (IDS mode). The main objective for this research is to explore, propose and evaluate a behavioural profiling approach which enhances the security for the mobile device. In order to achieve this, this project is divided into five distinct stages:
1. To investigate the security requirements for the mobile device and identify the need for a behavioural profiling security approach.
18
2. To compose a comprehensive review of biometric authentication approaches and examine the applicability of deploying a behaviour profiling technique on mobile devices.
3. To design a series of experiments for exploring the feasibility of deploying a behaviour profiling approach on mobile devices.
4. To propose a novel security framework to support the aim of behaviour profiling on mobile devices in a continuous and transparent manner.
5. To evaluate the security effectiveness of the proposed behaviour profiling framework for mobile devices through a simulation method.
1.3
Thesis structure
Chapter 2 begins by reviewing mobile communication technologies along with current mobile services establishing the importance of the security of the mobile device. By presenting both potential security threats and existing security approaches, a need for a new security mechanism which can provide continuous and transparent protection for the mobile device is identified. The chapter concludes by highlighting the need for a more comprehensive and sophisticated security control and suggesting possible solutions.
Having established the need for a new security technique for mobile devices, Chapter 3 presents and discusses the feasibility of utilising biometric verification techniques as a solution for tackling this issue. Chapter 3 starts by presenting a generic biometric model and biometric system performance measurement and requirement factors. The chapter then proceeds to describe an overview of existing biometric techniques based upon their physiological or behavioural characteristics. By comparing all applicable biometric approaches for the mobile device, a novel behaviour profiling based technique was chosen due to its various advantages. The chapter concludes by undertaking a comprehensive literature review on mobile behaviour profiling techniques to date.
Chapter 4 introduces a number of experimental studies into the feasibility of behaviour profiling on a mobile device. The studies have been based upon examining user interactions with mobile devices to verify the user, especially, the way in which users utilise standard and intra-extended applications. By comparing a number of pattern classification methods based upon statistical and artificial intelligence algorithms in a preliminary study, a number of application features towards success verification and the most appropriate classifier have been identified. The chapter finishes with evaluating the behaviour profiling technique on mobile user application
19
usage via the combination of the rule based approach, a dynamic profiling technique and a smoothing function.
Chapter 5 presents a novel Behaviour Profiling framework which provides transparent and continuous protection for mobile devices to fulfil two security purposes: authentication and IDS. The framework verifies the identity of a user based upon their applications usage. In order to provide more accurate verifications, a dynamic profiling technique which updates the profile of a user on a daily basis was utilised. Also, the framework reduces the impact of the high false rejection problem which every single behavioural biometric technique experiences by employing a smoothing function. The framework performs verification processes based upon three criteria (the smoothing function, a verification time and the sensitivity of an application) and updates a System Security (SS) level accordingly. The SS level introduces a level of intelligence to the framework: the identity of a user is not verified based upon a single pass or fail but a number of consecutive verification results. The chapter concludes by presenting a process algorithm which permits the behaviour profiling framework providing continuous and transparent security for mobile devices. Chapter 6 evaluates the proposed the framework via a simulation. The chapter begins by describing the implementation of the simulation. The chapter finishes by presenting and discussing a number of scenarios that have been designed to examine various configurations of the Behaviour Profiling framework.
Finally, Chapter 7 presents the main conclusions from the research, highlighting its achievements and limitations. Future research and development for this project are also suggested in this chapter.
Chapter 2: The evolution of Mobile Devices
20
2
The evolution of Mobile Devices
2.1
Introduction
The mobile device was initially designed to provide a telephony service via a cellular network. With the widespread availability of newer wireless technologies and the evolution of the mobile device itself, they can now also utilise other network mechanisms, namely: Wi-Fi, Bluetooth and NFC. This firm foundation allows the mobile device to offer a wide range of network based services. For example, Internet surfing via Wi-Fi hotspots, video conferencing through a 3G connection, road navigating by a Global Positioning System (GPS) link, picture sharing by using Bluetooth pairing and data synchronisation with laptop/desktop computers via a Universal Serial Bus (USB) cable. People can utilise these services to carry out a huge variety of personal and business tasks.
2.2
Mobile communication technologies and mobile devices
2.2.1 Mobile cellular technologies
In 1979, the first fully automatic cellular network (the First Generation (1G) network) was launched in Japan. By using a Frequency Division Multiple Access (FDMA) multiplexing method over an analogue circuit, people were able to talk with each other over the air via their handsets for the first time. However, it was only the rich who had the luxury to experience the mobile telephony service. By providing a more reliable service and charging an affordable price to the general public, the Second Generation (2G) cellular networks gradually replaced the 1G cellular networks in the early 1990s. By employing digital circuit switching technology, the 2G cellular networks supported both voice and data services. The data service was offered in the form of the Short Messaging Service (SMS) which allowed mobile users to communicate with each other by short text messages.
Since the introduction of the SMS, a trend of providing higher data rate and more number of services started to emerge. Table 2.1 illustrates the evolution of mobile cellular services over the last 30 years. By deploying the Wireless Application Protocol (WAP) on the Second Generation Enhanced mobile network (2.5G), mobile users were able to access Internet based services (e.g. web surfing) at a data rate of 9.6 kilobit per second (kbps) around the year 2000.
Chapter 2: The evolution of Mobile Devices
21
1G 2G 2.5G 3G 4G
Technical
Standards HSCSD GPRS EDGE IM-2000
Transmission type Analogue Digital Digital Digital Digital Digital Digital
Data rate (per second) - 9.6K 57.6K 114K 384K 2M 1G
Switching Circuit Circuit Circuit Packet Circuit/ Packet
Packet Packet
Multiplexing FDMA TDMA/
CDMA TDMA TDMA/ FDMA TDMA/ FDMA Services Voice call SMS Internet MMS Video call Video conference Watch TV program Miscellaneous Availability 1983 1992 2000 2001 2002 2001 2015
Adapted from: Clarke, 2004
Table 2.1: The evolution of cellular mobile communication technologies
Despite 2G network technology being first introduced nearly 20 years ago, it still dominates the current cellular communication market. By providing the service to more than 3.5 billion subscribers globally, 2G networks held almost an 80% share of the mobile communication market in 2009 (GSM World, 2009). Nonetheless, due to the rapid development of newer communication technologies, the revenue of 2G network has slowly declined over the last few years (Communications Today, 2010).
Since the first commercial Third Generation (3G) mobile network was launched by NTT DoCoMo in Japan in 2001, 3G technology has gradually been adopted. As shown in Figure 2.1, by the end of April 2011, a total of 400 3G networks had been successfully deployed around the world. With a maximum data rate of 2 Megabits per second (Mbps), 3G networks support many data services which were not previously available to mobile users, such as video conferencing and the Multimedia Messaging Service (MMS). Table 2.2 illustrates a number of available 3G services. Based upon their Quality of Service (QoS) requirements, a higher priority will be given to conversational services (i.e. voice calling and video conferencing) when they access a 3G network. In contrast, a lower network access priority will be applied to background services, such as email and SMS. With currently more than 650 million subscribers in the world, the 3G network holds
Chapter 2: The evolution of Mobile Devices
22
approximately 10% of the mobile communication market share (GSA, 2011b). Moreover, the future 3G market has been strongly predicted. For Europe alone, the number of 3G subscriptions will outnumber 2G in 2012. Also, in the same year, it is anticipated that approximately 70% of the total cellular subscriptions will be 3G network based (GSA, 2011a).
Source: GSA,2011b
Figure 2.1: 3G: Cumulative network launches worldwide
QoS Classes Example of 3G services
Conversational Voice, video telephony, video gaming Streaming Multimedia, video on demand, webcast Interactive Web browsing, network gaming, database access
Background Email, SMS, downloading
Table 2.2: 3G services with their QoS requirements
Other cellular technology, such as 3rd Generation Partnership Project Long Term Evolution (3GPP LTE), is also at the frontier of the mobile communication market. As its bandwidth does not meet the requirement of the Fourth Generation (4G) but is higher than the counterpart of the 3G, people refer to it as a pre-4G technology despite it being branded as a 4G technology in the market. Since its first appearance in 2009, LTE has experienced a steady growth in market share. In addition, the revenue of LTE technology is forecasted to be US$942 million in the US and a further $650 million from Western Europe in 2015 (PC advisor, 2010).
1 2 11 61 102 149 202 280 345 392 400 0 50 100 150 200 250 300 350 400 450 2001 2002 2003 2004 2005 2006 2007 2008 2009 2010 April 8, 2011 N u m b e r o f N e tw o rk Lau n ch e ss Year
Chapter 2: The evolution of Mobile Devices
23
2.2.2 Other mobile communication technologies
Apart from accessing the aforementioned cellular communication technologies, mobile devices can also connect with a number of other communication technologies, namely Wi-Fi, Bluetooth, NFC, ZigBee and USB.
Wi-Fi is a general term for the IEEE 802.11 wireless technology standards. Wi-Fi technology enables computing devices to connect to the Internet, with a bandwidth up to 150 Mbps per stream, within an approximate range of up to 250 metres. By using a Wi-Fi connection, a mobile user can access many Internet based services, such as sending/receiving emails, chatting online and accessing web pages. Currently many network operators provide the Wi-Fi service around the world. BT alone offers 2.8 million Wi-Fi connections in the UK and Republic of Ireland (BTopenzone, 2011). This provides an additional platform via which mobile devices can be permanently connected. Although the coverage of a single Wi-Fi network is somewhat limited, by connecting a number of them together, a wireless mesh network can be formed which improves a user’s mobility greatly. For example in London, a city-sized Wi-Fi network allows millions of mobile devices to be connected with high speed (BBC news, 2007). Figure 2.2 illustrates the Wi-Fi market projections between 2005 and 2012. It demonstrates that approximately 1 billion Wi-Fi enabled devices will be shipped in the year 2012. In addition, more than half of such devices will be mobile devices.
Source: Skyhook, 2007
Figure 2.2: Wi-Fi market projections 2005-2012
0 200 400 600 800 1000 1200 2005 2006 2007 2008 2009 2010 2011 2012 M ill io n s Year Handsets Consumer Electronics Laptops Other
Chapter 2: The evolution of Mobile Devices
24
Bluetooth wireless technology allows computing devices to communicate with each other at a speed of up to 3Mbps with a maximum range of approximately 100 metres. Within a Bluetooth formed Personal Area Network (PAN), mobile devices can exchange information directly with each other, such as transferring data files, sending text or multimedia messages and connecting to headsets. In 2010, a total of 1.7 billion Bluetooth enabled devices (e.g. mobile devices, laptops and gaming consoles) were shipped worldwide (Bluetooth SIG, 2011). Moreover, 1.6 billion mobile devices were shipped and 64% of them were Bluetooth enabled (Communities Dominate Brands, 2010). In addition, statistics indicate that more than 70% of the mobile device users enable their Bluetooth connections during the day (Article Alley, 2010).
Some other technologies, such as NFC and Zigbee, are also at the forefront of wireless communication development. NFC technology supports two devices to communicate with each other within a very close rang (i.e. less than few centimetres). It can be utilised in many areas, such as access control, consumer electronics, information collection and exchange, and payment. Mobilecommercedaily (2010) suggested that 50 million NFC-enabled mobile devices would be commercially available in 2011. Also, according to the Juniper Research, mobile payment via NFC will generate $50 billion of revenue by 2014 (Knowyourmobile, 2011). Zigbee is a standard wireless technology which supports low-cost and low-power wireless sensors. The impact of Zigbee on mobile devices will be huge because of the level of sensitive information it accesses, such as secure mobile payment details and mobile office access control data (ZigBee Alliance, 2011). In addition, with over $1 trillion in revenue, Zigbee outsold all other wireless technologies in 2009 (Telecompaper, 2010).
USB is a technique for establishing a data connection between two computing devices with a maximum data rate of 180 Mbps. By using a USB cable, a mobile device can be connected with a desktop computer for exchanging information (e.g. data backups and synchronising with calendar schedules). In addition, a USB connection can be utilised for charging the battery of a mobile device. In 2009 alone, over 2 billion USB enabled devices were shipped (PC world, 2009). Compared with other aforementioned communication techniques, USB provides a more stable and faster connection for mobile devices but limits them to zero mobility.
The previous two sections described a number of mobile communication technologies that exist to date. Figure 2.3 illustrates the relationship between their data rates and their mobility. Although cellular communication technologies provide a safe and untethered environment to mobile users, their data throughput is somewhat limited. In comparison, other communication technologies
Chapter 2: The evolution of Mobile Devices
25
provide reliable and high rates of data exchange; however the mobile devices’ mobility reduces significantly. In addition, how safely these technologies can be utilised is heavily dependent upon individual mobile users. It is not the author’s intention to discuss the advantages and disadvantages for these technologies but to highlight their existence. Their availability affects mobile devices two-fold: by utilising various communication channels, mobile devices can provide many network based services; at the same time, this also creates a complex environment for deploying security controls anywhere other than on the mobile device itself.
Source: NFC Forum, 2011
Figure 2.3: Mobile communication technologies data rate vs. mobility
2.2.3 Mobile devices
Along with the rapid development of mobile communication technology, the mobile device has also experienced a dramatic evolution. Traditionally, people could only use the handset to make voice calls. Currently, the mobile has become a multimedia and multi-network computing device. Indeed, the mobile device operates similarly to a computer in terms of networking, processing power and data capacity. As demonstrated in Table 2.3, the iPhone 4, a typical mobile device which is commercially available, outperforms an average Personal Computer (PC) manufactured in 2001 in many aspects. Also, with a retail price of £520, 1.7 million iPhone 4 handsets were sold in the first three days when the device was first made available for purchase (CNET news, 2010).
10km 1km 100m 10m 1m 0.1m 0.01m 10Mb 1Mb 100Kb 100Mb 1Gb D ata rate Range GSM 3G Wireless USB/ Ultrawideband WiFi Bluetooth NFC ZigBee WiMax
Chapter 2: The evolution of Mobile Devices
26
Device Iphone 4 (2010) PC (2001)
Network 3G, GSM1, WiFi, Bluetooth LAN, Broadband
Memory 512 MB(internal) 256 MB (internal)
Processing power Apple A4 800 MHz-1GHz Intel Pentium III 800 MHz
Data capacity 32 GB 30 GB
Operation System iPhone OS 4.2.1 Windows Millennium Edition
Market Price £ 520 £1200
Table 2.3: Mobile device (2010) VS PC (2001)
At present, there are more than 5 billion mobile devices being used around the world. For the 2010 Q4 mobile device markets alone, a total of 101.2 million smart phones were shipped by various manufactures. The top five platform vendors were Google Inc., Nokia Corporation, Apple Inc., Research In Motion (RIM) Limited and Microsoft Corporation, with 32.9%, 30.6%, 16%, 14.4%, and 3.1% market share respectively (Canalys, 2011). As these smart phones are equipped with a number of communication network interface cards, a powerful CPU and massive data storage, they can provide a wide range of services and applications similar to that which a PC offers. By default, a number of common applications are preinstalled on the mobile devices by their manufacturers, such as: phonebook, clock and voice calling. In addition, mobile users can download and then install any other applications on the devices according to individual preference. This option completely changed the way that people utilise their mobile devices: from a dummy handset into a personalised computing gadget. Also, the more applications that are installed on devices, the greater the potential usage deviation is between various users. These mobile applications are designed by different vendors. Table 2.4 demonstrates a number of examples of application software stores. In total, there are more than 1 million applications available for people to choose from, across different mobile platforms. In addition, almost 15,000 new mobile applications become available for people to download every month (Distimo, 2010). Moreover, according to a white paper from Juniper Research, the mobile application global market is expected to triple from $10 billion in 2009 to $32 billion in 2015 (Juniper Research, 2010).
Application
(App) stores Established
Available Apps
No. of
Downloads Device Platform
Android Market October, 2008 200,000 5 billion Android App store July, 2008 500,000 15 billion IOS App World April, 2009 38,000 1 billion Blackberry
Ovi store May, 2009 80,000 1.8 billion Nokia
Table 2.4: Examples of App stores in 2011
1
Chapter 2: The evolution of Mobile Devices
27
Each mobile application has a unique risk impact on the mobile system security based upon several criteria, such as their connection types, how much information they associate with, the nature of the information, their threat level and their vulnerability level. Based upon these criteria, Ledermuller and Clarke (2011) proposed the risk level which is associated with their application categories (as shown in Table 2.5). By employing the risk level of each application, their impact on the mobile system security can be observed: the higher the risk level an application has, the more impact it has on the system security. Therefore, various security controls can be applied for each individual application based upon their risk level: the higher the risk level an application has, the tighter the security control should be implemented for that application.
Application category Application value Threat level Risk temp Vulnerability level Risk level E-Mail (corporate) 8 4 8 2 8 E-banking 7 5 8 1 7 E-health 8 4 8 2 8
Remote access (corporate) 7 5 8 1 7
Remote access (private) 6 5 7 1 6
Voice communication 6 3 6 1 5 Stored business documents 6 3 6 3 7 Physical device 6 2 5 0 5 Personal information (online synchronized) 4 3 4 2 4 E-Mail (private) 4 3 4 2 4 Social networking 4 3 4 1 3 Messaging 3 3 3 2 4 Personal information 4 2 3 2 3
Web access (browser) 2 4 3 3 4
Stored documents 3 1 2 2 2
Maps & Navigation 2 1 1 3 2
News client 1 1 1 1 1
Utilities 1 1 1 2 1
Source: Ledermuller and Clarke, 2011
Table 2.5: Applications with their risk scores
Table 2.6 illustrates a number of examples of both network based and host based mobile services which mobile users may use for a variety of purposes. For communication, people can send messages to each other through SMS, MMS, email and online messengers. In 2010, the mobile messaging market was valued at $179.2 billion. This number is predicted to increase to $209.8 billion by the end of 2011 and rise to $334.7 billion in 2015 (Portio Research, 2011). For finance, people can use Internet banking to check their account balance, transfer money and pay utility
Chapter 2: The evolution of Mobile Devices
28
bills. Also, by using the mobile NFC service, people can pay for goods at supermarket checkouts or vending machines. For instance, Orange and Barclaycard launched a mobile payment service which enables the users to pay for goods up to £15 (Aol tech, 2011). According to a research report of Berg Insight, there were 133 million mobile money users who made a total of $25 billion of transactions in 2010. Furthermore, they also predicted that with an annual increase rate of 40%, there will be 709 million mobile money users in 2015 with a total of $215 billion transactions (Berg Insight, 2011). Data storage enables people to store different kinds of information on a mobile device, such as personal contacts, calendar schedules, messages and documents.
Services Network based Host based
Voice Make voice phone calls Speech recorder
Data Text message, multimedia message service, Emails, file transfer/sharing
Contacts, calendar, to do list, data storage
Multimedia Video conferencing,
GPS (Global Position System)
Music and movie player, taking picture and videos Internet Web browsing, Online messenger, mobile
banking, mobile commerce ---
Others Listen to the radio, watch TV programs, mobile NFC payment
Games, create documents, calculators, convertors Table 2.6: Examples of mobile services
Figure 2.4 demonstrates the findings of a consumer mobile platform activities survey conducted by TNS mobile life (2011). In 2011, the top six user activities are related to data downloading. Moreover, 19% of the respondents communicate with their friends via social networking tools. Furthermore, mobile financial services, such as mobile banking and mobile payment grew strongly in 2011 compared with the previous year. In addition, Gartner (2009) predicted that among the top ten services a mobile device user would use in 2012, seven will be related to data downloading, mobile money and mobile communication.
Chapter 2: The evolution of Mobile Devices
29
Source: TNS mobile life, 2011
Figure 2.4: Consumer mobile platform activities 2011
As shown in this section, the functionalities of the device have increased in many aspects. This enables the mobile device to provide a wide range of services. Currently, people use these services to complete various tasks in their daily life. However, these tasks may be highly likely related to private personal information or critical business data. For instance, mobile financial services have to utilise bank account details of an individual to complete a transaction. Also, communication services may carry personal messages and customer information. Furthermore, as suggested by various studies, people store sensitive information on their mobile devices, such as passwords, bank account details, login credentials for personal and business email accounts, customer data and corporate intellectual property (Regenersis, 2009; BBC news, 2010; Kaspersky Lab, 2011; McAfee, 2011). Therefore, it is mission critical to ensure the legitimacy of a mobile user throughout every single session of usage. Otherwise, misuse would occur on both the services and information provided by the mobile devices.
2.3
Mobile device security threats
As demonstrated in the last section, the mobile device has become a powerful multimedia and multi-networking computing device. However, its ability is a double-edged sword. With mobile devices being able to host various services and store different information at the same time, this brings a number of security threats to the mobile environment, such as service fraud, Denial of
26 23 22 22 20 19 19 17 15 14 13 12 12 12 12 11 10 9 Download ringtones Download caller tunes Download graphics Download music Download apps Download games Stream music Watch social video Mobile banking Navigation Location services Blogging Download TV/video Watch TV live Subscriptions Stream TV/video Mobile wallet Speech to text
Consumer Mobile Platform Activites 2011
(% of respondents)
Chapter 2: The evolution of Mobile Devices
30
Service (DoS) attacks, malware and information disclosure (Stajano and Anderson, 1999; Viruslist, 2009; Muir, 2003). In this section, a comprehensive discussion will be given on mobile security threats.
2.3.1 Mobile service fraud
A mobile device provides many services through a telecommunication service provider network connection, such as voice calling, text messaging and web surfing. In order to utilise these services, a charge needs to be paid to the service providers. However, when a person uses such services without paying a charge, a service fraud occurs. For instance, when a mobile device is stolen, an unauthorised person could access the mobile services within a relatively small time frame until the owner of the device reports the incident to their service provider, who then has the power to terminate the connection. In order to maximise the window of opportunity for abusing the services, criminals could plot more sophisticated attacks which have a smaller footprint for detection, such as a Subscriber Identity Module (SIM) card cloning attack. By exploring the coding flaws within a cellular network authentication process, criminals could clone a victim’s SIM card and abuse the services at the victim’s expense (Rao et al, 2002). In this way, even at the end of a billing month, a mobile owner may not notice the abuse has occurred unless a thorough checking of their statements is undertaken. Moreover, criminals could launch a far larger scale of attack against the telecommunication service providers by using the SIM cloning trick. In 2010, the mobile operator O2 was hit by a multi-million pound fraud as a group of gangs cloned O2 SIM cards and called international premium rate telephone numbers (Which?, 2010). According to the Global Fraud Loss Survey 2009 of Communications Fraud Control Association (CFCA), service fraud is estimated to cost telecommunication service providers $72-80 billion every year around the world (CFCA, 2009). In addition, the number of fraud attacks has increased significantly by 74% between 2008 and 2009 (BBC news, 2009).
2.3.2 Denial of Service attack
Instead of abusing the mobile services, some criminals could plot DoS attacks to make these services unavailable to users. As a result, DoS attack is a security threat to the devices’ availability. Within the mobile environment, a perpetrator could attack a mobile device or the networks it connects to with the launch of a DoS attack. The mobile devices rely on rechargeable batteries to function properly. By plotting a battery exhaustion attack, a mobile battery will be drained in a much shorter time than under normal usage (Stajano and Anderson, 1999). As the mobile devices use radio waves as a communication media, an attacker may use a signal jamming technique to
Chapter 2: The evolution of Mobile Devices
31
block the legitimate radio waves. As a result, all the network based services will become temporarily unavailable. Moreover, malicious attackers could disable a device completely over radio waves. For instance, attackers could use Bluetooth smacking which is a Ping-of-Death DoS attack to ‘kill’ a mobile device immediately (Browning and Kessler, 2009). Furthermore, as a mobile device is connected to the Internet, experienced attackers could plot a Transmission Control Protocol (TCP) flooding attack to stop the device from functioning properly (Swami and Tschofenig, 2006). Despite this there have not been any mobile DoS attack incidents reported yet, however, people should be aware of their existence.
2.3.3 Mobile malware
As described in the previous section, the modern mobile device has become much like a normal computer in terms of information processing, data storage and networking abilities. Unfortunately, mobile devices also face similar security issues which the traditional computers experience, such as malware. Malware stands for malicious software. It is designed to harm a computing system, harvest information or launch other types of attacks. The most recognisable malware are viruses, worms, spyware and Trojans. The first mobile device virus ‘Cabir’ was reported in June 2004 (BBC, 2004). Since then, the number of mobile malware increased steadily over the last few years. Indeed, by the end of 2009, there were more than 106 malware families with 514 variants identified (Securelist, 2009). Moreover, the number of new mobile malware being found in 2010 has increased considerably by 46% compared with those occurring in 2009 (McAfee, 2010). Furthermore, McAfee catalogued around 1200 unique mobile malware variants at the end of June 2011 (CSO online, 2011).
As demonstrated in Table 2.7, malware can affect the security of a mobile device at various levels. From simply duplicating itself to drain device batteries, to secretly sending SMS messages to a premium number; from basically changing a screen display, to remotely controlling a mobile device over the Internet. Mobile malware can be spread in many ways, such as through a Bluetooth connection, via a multimedia message or by embedding itself in a mobile application. Among these methods of proliferation, malware embedded in an application holds the largest potential threat. Once the application is downloaded and installed, the malware is also installed but without the owner’s knowledge. For instance in 2010, up to 4.6 million Android users downloaded a suspicious application that secretly collected and transmitted users’ information to a website in China (ComputerWeekly, 2010).
Chapter 2: The evolution of Mobile Devices
32
Threat levels Malware Effects
Low
Cabir Constantly replicates itself through an active Bluetooth connection or removable media to drain the mobile battery
Skulls.A Allows the users to make or receive phone calls, all other applications are blocked and the screen is changed to display skulls Medium RedBrowser Secretly sends SMS messages to a premium number
Locknut.A Blocks the phone and prevents any applications from opening
High
FlexiSpy Sends call logs and copies of SMS/MMS messages to a secret server
Brador Allows a hacker to remote control the device via an Internet connection
Table 2.7: Example of Mobile malware and its effects
As illustrated by Figure 2.5, mobile malware attacks mobile devices regardless of their operating systems (OS). The number of malware for individual platforms highly depends upon their popularity of usage. As there are more than 3 billion Java 2 Micro Edition (J2ME) enabled mobile devices around the world (Java, 2011), the J2ME platform has become the top targeted platform by the malware creators associated with 613 variations of malware (57.67% of total malware). Despite the share of malware for the iPhone platform being significantly lower when comparing it with other platforms, the damage caused by the iPhone related malware can be severe. For instance, if an iPhone is infected by the iPhone/Privacy.A worm, attackers can gain access to the user’s contacts and messages, and eventually steal a phone owner’s identity (ZDnet, 2009).
Source: Securelist, 2011
Figure 2.5: The distribution of malware by platform
58% 29% 6% 5% 1% 1% J2ME Symbian Python Windows Mobile AndroidOS Others
Chapter 2: The evolution of Mobile Devices
33
2.3.4 Social engineering attack
Social engineering attacks utilise emails or malicious websites to steal personal information and computer system login credentials by masquerading as a legitimate organisation. In the mobile environment, attackers can additionally utilise two techniques to solicit information: Voice call phishing (Vishing) and SMS phishing (Smishing). Normally, attackers make a voice call or send out a spam text message purporting to be from a financial organization. For example, attackers could call bank users with the following message “Your ATM card needs to be reactivated” and ask for their personal information. If the user is fooled by the Vishing attack, their information will be abused (FBI, 2010). Another example, early in 2011, a text message containing a phishing site was sent to customers of Bank of China as a reminder to reactivate their online banking tokens (McAfee, 2011a). If any customer clicked the phishing link, their login credentials (i.e. login ID, password and token) would be obtained and later abused by the attackers. Furthermore, the Smishing technique can also be used to plot other attacks. For instance, by simply replacing a phishing site with a link for a Trojan horse, if clicked, attackers could take the control of the mobile device without the owner’s knowledge (PCWorld, 2006).
2.3.5 Loss or theft of the device
As mobile devices have always been high value computing gadgets, this consistently makes them prominent targets for attackers. Due to the small physical size and lack of physical protection that mobile devices possess, they can easily be lost or stolen. Indeed, according to the metropolitan police website, there are around 10,000 mobile devices lost or stolen in London every month (Metropolitan Police Service, 2011). When a mobile device is lost or stolen, there is an initial cost of replacement. More damage could occur if the attacker accesses the mobile services and information. For instance, the thief can make free phone calls, send multimedia messages and surf the Internet at the owner’s cost. Also, as demonstrated in section 2.2.3 people do store sensitive information on their devices, such as bank details, login credentials for computer systems and emails, customer data and business plans. As a result, the attacker could also review all the information stored on the mobile device. Indeed, a survey shows that 32% of all information disclosure incidents were related to lost or stolen mobile devices (Ponemon Institute, 2011). Moreover, the McAfee mobile and security report indicated that “Four in 10 organizations have had mobile devices lost or stolen and half of lost/stolen devices contain business critical data”, such as customer data, corporate intellectual property and financial information (McAfee, 2011).
Chapter 2: The evolution of Mobile Devices
34
Furthermore, such information can be used to perform other illegal activities and the damage is well beyond imagination. For instance, attackers could use the mobile owner’s bank account login details to transfer money to their own bank accounts, or view a latest blueprint of product and sell it to the owner’s competitors.
All of these aforementioned mobile security threats are considered as outside threats however security threats may come from inside as well. For instance, a colleague borrows a person’s mobile device for making a voice call. Apart from utilising the telephony service, the colleague also has the opportunity to access other services or information, such as reading the owner’s email messages, viewing the owner’s social networking profiles, accessing the owner’s document files or even installing malware on the device to capture the owner’s call logs. Mobile devices lack the physical protection which other computing devices normally experience being kept within offices and homes which prevents these actions being carried out without the owner’s notice. Such a security threat is also known as an insider attack. Comparing this with the aforementioned security threats, the insider attack is easier for attackers to plot and is more difficult for users to detect. According to the 2011 CyberSecurity Watch Survey, 21% of attacks on computing services and data were perpetrated by insiders compared with 58% by outsiders 2(Cert, 2011). Also, a Credant (2011) white paper suggested that 47% of security incidents were caused by insiders. Although the figures from the two findings are different, it is important to highlight the existence of insider attacks because they are just as dangerous as outsider attacks.
2.4 Mobile security controls
In order to counter the highlighted mobile security threats, various security projects have been proposed and developed. For instance, employing an authentication technique to stop unauthorised usage, using mobile antivirus products to detect and remove mobile malware, taking advantage of mobile firewall to filter unwanted traffic, utilising an encryption mechanism to protect the information stored on the devices, and making use of battery based mobile IDS systems to detect malware presence. These security controls will be discussed in the following section.
2 The other 21% was unknown.