University of Massachusetts Amherst University of Massachusetts Amherst
ScholarWorks@UMass Amherst
ScholarWorks@UMass Amherst
Doctoral Dissertations Dissertations and Theses
March 2020
Towards Optimized Traffic Provisioning and Adaptive Cache
Towards Optimized Traffic Provisioning and Adaptive Cache
Management for Content Delivery
Management for Content Delivery
Aditya SundarrajanFollow this and additional works at: https://scholarworks.umass.edu/dissertations_2
Part of the Computer and Systems Architecture Commons, Digital Communications and Networking Commons, and the Other Computer Engineering Commons
Recommended Citation Recommended Citation
Sundarrajan, Aditya, "Towards Optimized Traffic Provisioning and Adaptive Cache Management for Content Delivery" (2020). Doctoral Dissertations. 1869.
https://scholarworks.umass.edu/dissertations_2/1869
This Open Access Dissertation is brought to you for free and open access by the Dissertations and Theses at ScholarWorks@UMass Amherst. It has been accepted for inclusion in Doctoral Dissertations by an authorized administrator of ScholarWorks@UMass Amherst. For more information, please contact
TOWARDS OPTIMIZED TRAFFIC PROVISIONING
AND ADAPTIVE CACHE MANAGEMENT FOR
CONTENT DELIVERY
A Dissertation Presented by
ADITYA SUNDARRAJAN
Submitted to the Graduate School of the
University of Massachusetts Amherst in partial fulfillment of the requirements for the degree of
DOCTOR OF PHILOSOPHY February 2020
c
Copyright by Aditya Sundarrajan 2020 All Rights Reserved
TOWARDS OPTIMIZED TRAFFIC PROVISIONING
AND ADAPTIVE CACHE MANAGEMENT FOR
CONTENT DELIVERY
A Dissertation Presented by
ADITYA SUNDARRAJAN
Approved as to style and content by:
Ramesh K. Sitaraman, Chair
Prashant Shenoy, Member
Donald Towsley, Member
Michael Zink, Member
James Allan, Chair of the Faculty
ACKNOWLEDGMENTS
This dissertation has been a few years in the making. There are several people who have helped me along the way, and I am very grateful for their support. First and foremost, I would like to thank my advisor Ramesh K. Sitaraman. Ramesh has been a great source of inspiration and a fantastic mentor over the years. Ramesh has taught me the importance of conducting meaningful and impactful research that has far-reaching consequences. This has shaped my own views on research that I hope to build upon. I am also grateful to Ramesh for helping me foster collaborations with researchers from other academic institutions and the industry to identify and solve real world challenges.
I am also grateful to my collaborators who I have had the pleasure of working with over the years. I would like to thank the many engineers I have spoken to and worked with at Akamai Technologies on the challenges faced in content delivery and the impacts of addressing these challenges. I would specifically like to thank Mangesh Kasbekar and Mingdong Feng who have been my collaborators on several projects. Their insights on how large globally distributed systems work have helped me develop practical and deployable solutions. I would also like to thank Soumya Basu, Sanjay Shakkottai, Javad Ghaderi, Vadim Kirilin and Sergey Gorinsky for their collaboration on different projects that have contributed to this dissertation.
I want to thank my committee members Prashant Shenoy, Don Towsley and Michael Zink for their valuable insights and feedback on ways to improve this dis-sertation. I would also like to thank my good friends and lab mates for making my time at UMass and Amherst more memorable. I specifically want to thank Prateek Sharma, Anirudh Sabnis, Kevin Spiteri and Sohaib Ahmad for their support and
friendship. The computer science graduate program at UMass has some of the best administrative staff I have ever worked with and I specifically want to thank Leeanne Leclerc, Eileen Hamel, Karren Sacco and Barbara Sutherland for seamlessly taking care of all the paperwork and administrivia.
Finally, I am very grateful to my parents, sister and grandparents for their whole-hearted support and encouragement.
ABSTRACT
TOWARDS OPTIMIZED TRAFFIC PROVISIONING
AND ADAPTIVE CACHE MANAGEMENT FOR
CONTENT DELIVERY
FEBRUARY 2020
ADITYA SUNDARRAJAN B.E., ANNA UNIVERSITY
M.S., THE UNIVERSITY OF ARIZONA
Ph.D., UNIVERSITY OF MASSACHUSETTS AMHERST
Directed by: Professor Ramesh K. Sitaraman
Content delivery networks (CDNs) deploy hundreds of thousands of servers around the world to cache and serve trillions of user requests every day for a diverse set of content such as web pages, videos, software downloads and images. In this disserta-tion, we propose algorithms to provision traffic across cache servers and manage the content they host to achieve performance objectives such as maximizing the cache hit rate, minimizing the bandwidth cost of the network and minimizing the energy consumption of the servers.
Traffic provisioning is the process of determining the set of content domains hosted on the servers. We propose footprint descriptors that effectively capture the popu-larity characteristics and caching performance of different content classes. We also propose a footprint descriptor calculus that can be used to decide how content should
be mixed or partitioned to efficiently provision traffic. To automate traffic provi-sioning, we propose optimization models to provision traffic such that the cache miss traffic from the network is minimized without overloading the servers. We find that such optimization models produce significant reductions in the cache miss traffic when compared with traffic provisioning algorithms in use today.
Cache management is the process of deciding how content is cached in the servers of a CDN. We propose TTL-based caching algorithms that provably achieve perfor-mance targets specified by a CDN operator. We show that the proposed algorithms converge to the target hit rate and target cache size with low error. Finally, we pro-pose cache management algorithms to make the servers energy-efficient using disk shutdown. We find that disk shutdown is well suited for CDN servers and provides energy savings without significantly impacting cache hit rates.
TABLE OF CONTENTS
Page
ACKNOWLEDGMENTS . . . .iv
ABSTRACT. . . .vi
LIST OF TABLES. . . .xiii
LIST OF FIGURES. . . xv
CHAPTER 1. INTRODUCTION . . . 1
1.1 The role of caching in CDNs . . . 1
1.1.1 Performance and cost metrics of a CDN . . . 2
1.2 Traffic provisioning and cache management in CDNs . . . 4
1.2.1 Traffic provisioning . . . 4
1.2.2 Cache management . . . 5
1.3 Challenges in traffic provisioning and cache management and proposed solutions . . . 5
1.3.1 Predicting caching characteristics of traffic mixes using footprint descriptors . . . 5
1.3.2 Midgress-aware traffic provisioning . . . 6
1.3.3 Adaptive cache management using TTL-based caching . . . 7
1.3.4 Energy-efficient caching using disk shutdown . . . 8
1.4 Dissertation outline . . . 9
2. TRAFFIC MIXING USING FOOTPRINT DESCRIPTORS . . . 10
2.1.1 Trace collection . . . 14
2.1.2 Analysis of traffic classes . . . 15
2.2 Theory of footprint descriptors . . . 18
2.2.1 Footprint descriptors (FD) . . . 18
2.2.2 Estimating cache properties from footprint descriptors . . . 19
2.2.3 A calculus of footprint descriptors . . . 20
2.2.3.1 Addition . . . 21
2.2.3.2 Subtraction . . . 24
2.2.3.3 Scaling . . . 25
2.2.4 A simpler footprint descriptor (SFD) . . . 26
2.3 Validation of footprint calculus . . . 27
2.3.1 Experimental evaluation . . . 29
2.4 Applying footprint descriptors in a production CDN . . . 33
2.4.1 Traffic mix evaluation service . . . 33
2.4.1.1 Estimating space requirement of a traffic mix . . . 33
2.4.1.2 Predicting the outcome of traffic mixing in a given server . . . 35
2.4.1.3 Splitting domains in a traffic class . . . 36
2.4.2 Hit rate targets with cache partitioning . . . 37
2.4.3 Parallelizing the computation of FDs . . . 39
2.5 Related work . . . 41
2.6 Conclusion . . . 43
3. MIDGRESS-AWARE TRAFFIC PROVISIONING. . . 44
3.1 Our optimization solution for traffic provisioning . . . 48
3.1.1 Modeling cache eviction and midgress . . . 49
3.1.1.1 Eviction age equality . . . 50
3.1.2 Formulation of our optimization model . . . 51
3.1.3 Solving the optimization model OPT . . . 56
3.2.1 Midgress-unaware baseline . . . 57
3.2.2 Midgress-aware local search . . . 58
3.3 Experimental evaluation . . . 59
3.3.1 Metro-level traffic provisioning . . . 62
3.3.1.1 Understanding how traffic provisioning can impact midgress . . . 63
3.3.2 Cluster-level traffic provisioning . . . 65
3.3.3 Robustness to variations in cache management policy . . . 66
3.4 Extensions of midgress-aware traffic provisioning . . . 67
3.4.1 Minimum redundancy guarantee . . . 68
3.4.1.1 Experimental evaluation . . . 69
3.4.2 Maximum cache miss rate guarantee . . . 70
3.4.2.1 Experimental evaluation . . . 71
3.4.3 Traffic provisioning in partitioned caches . . . 71
3.4.3.1 Modeling and implementing traffic provisioning for partitioned caches . . . 72
3.4.3.2 Experimental evaluation . . . 73
3.5 Related work . . . 74
3.6 Conclusion . . . 75
4. ADAPTIVE CACHE MANAGEMENT USING TTL-BASED CACHING . . . 77
4.1 TTL-based caching algorithms . . . 79
4.1.1 d-TTL . . . 80
4.1.2 f-TTL . . . 80
4.1.2.1 Algorithm description . . . 81
4.1.2.2 Achieving the target cache size . . . 82
4.1.2.3 TTL update rules . . . 82
4.2 Implementation of d-TTL and f-TTL . . . 84
4.3.1 Hit rate performance of d-TTL and f-TTL . . . 86
4.3.2 Convergence of d-TTL and f-TTL . . . 87
4.3.3 Accuracy of d-TTL and f-TTL . . . 89
4.3.4 Sensitivity and robustness of d-TTL and f-TTL . . . 91
4.3.5 Effect of target normalized size on f-TTL . . . 93
4.4 Related Work . . . 94
4.5 Conclusion . . . 95
5. ENERGY-EFFICIENT CACHING USING DISK SHUTDOWN. . . 96
5.1 Cache management schemes . . . 101
5.1.1 A typical algorithm without disk shutdown . . . 101
5.1.2 Energy-efficient cache management . . . 102
5.1.3 An ideal energy-efficient variant of LRU . . . 103
5.1.4 Evaluation methodology . . . 104
5.1.4.1 Content request traces . . . 104
5.1.4.2 Cache simulator for disk shutdown . . . 106
5.2 Cache sizing algorithms . . . 107
5.2.1 Experimental evaluation . . . 111
5.3 Disk shutdown algorithms . . . 113
5.3.1 Experimental evaluation . . . 114
5.4 Content placement & eviction algorithms . . . 117
5.4.1 Experimental evaluation . . . 118
5.4.2 Disk power cycles and impact on lifetimes . . . 119
5.5 Understanding cluster hit rates . . . 119
5.5.1 Experimental evaluation . . . 120
5.6 Related work . . . 122
5.7 Conclusion . . . 123
6. SUMMARY AND FUTURE WORK. . . 125
6.1 Future work . . . 126
6.1.2 Modeling server provisioning . . . 127 6.1.3 Machine learning based caching . . . 127
APPENDICES
A. SOLVING THE OPTIMIZATION MODEL FOR
MIDGRESS-AWARE TRAFFIC PROVISIONING. . . 129 B. DISK POWER MODEL . . . 135 BIBLIOGRAPHY . . . 138
LIST OF TABLES
Table Page
2.1 Characteristics of the chosen traffic class traces. . . 15
2.2 Characteristics of the 2nd set of traces. . . 28
2.3 Characteristics of the 3rd set of traces. . . 28
2.4 Average prediction error of the baseline algorithm vs. the FD calculus. . . 29
2.5 Production validation. . . 32
3.1 Input parameters of optimization model. . . 53
3.2 Output parameters of optimization model. . . 54
3.3 Traffic class characteristics . . . 61
4.1 Comparison of target hit rate and average cache size achieved by d-TTL and f-TTL with Fixed-TTL and LRU. . . 90
4.2 Impact of exponential changes in constant step size η on the performance of d-TTL (robustness analysis of d-TTL). . . 91
4.3 Impact of linear changes in constant step sizeη= 0.01 on the performance of d-TTL (sensitivity analysis of d-TTL). . . 91
4.4 Impact of exponential changes in constant step size ηs on the performance of f-TTL (robustness analysis of f-TTL). . . 92
4.5 Impact of linear changes in constant step sizeηs = 1e-9 on the performance of f-TTL (sensitivity analysis of f-TTL). . . 92
4.6 Impact of normalized cache size target on the performance of f-TTL. . . 93
5.1 Algorithms for energy-efficient cache management. The starred algorithms are simple options that we use as a baseline that we
improve upon. . . 102 5.2 Characteristics of content request traces from the Akamai cluster. . . 104 B.1 Disk power consumption. . . 136
LIST OF FIGURES
Figure Page
1.1 Content is served from the cache of a CDN server, from one of its peers within the same cluster, or from the content provider’s
origin. . . 2
1.2 The traffic provisioning and cache management systems work together to maximize the cache hit rate of the CDN. . . 4
2.1 Popularity distribution of the 4 traffic classes. . . 16
2.2 Object size distribution of the 4 traffic classes. . . 16
2.3 Hit rate curves of the 4 traffic classes. . . 17
2.4 Hit rate curves of the traffic mix in Table 2.2 before and after scaling the download traffic class by a factor of 20. . . 31
2.5 Hit rate curves of traffic classes in Table 2.2. . . 31
2.6 Addition operation on web and download traffic classes in Table 2.1. . . 34
2.7 Pre-addition and post-addition HRCs of web and download traffic classes in Table 2.1. . . 36
2.8 Subtracting a subset of domains from the video traffic class in Table 2.1. . . 37
2.9 Map-reduce framework to parallelize footprint descriptor computation. . . 40
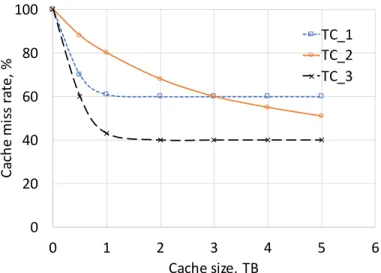
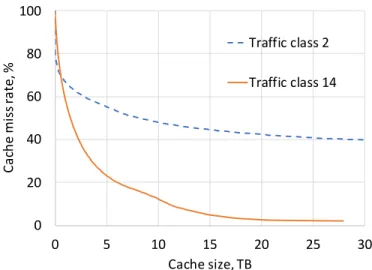
3.1 MRCs of traffic classesT C1,T C2 and T C3. . . 46
3.3 Eviction age functions of two traffic classes in a metro area. The eviction age functions indicate how traffic classes compete for
shared cache space. . . 53
3.4 MRC of OPT, local search and baseline fit algorithms. . . 62
3.5 Average miss rate of each traffic class in a metro area of cache size 100 TB. . . 63
3.6 Average number of sites each traffic class is assigned to in a metro area of cache size 100 TB. . . 64
3.7 Increasing minimum redundancy increases the overall midgress of the metro area. . . 69
3.8 MRC of OPT and baseline fit on shared and partitioned caches. . . 73
4.1 Hit rate curve for object hit rates. . . 86
4.2 Hit rate curve for byte hit rates. . . 86
4.3 Object hit rate convergence over time for d-TTL; target hit rate=60%. . . 88
4.4 Object hit rate convergence over time for f-TTL; target hit rate=60%. . . 88
4.5 Byte hit rate convergence over time for d-TTL; target hit rate=60%. . . 89
4.6 Byte hit rate convergence over time for f-TTL; target hit rate=60%. . . 89
5.1 Hit rate decreases significantly when disks are shut down using a simple baseline scheme. . . 99
5.2 Popularity of content accessed by users on a CDN server. . . 100
5.3 Content traffic served to users from our cluster (in Gbps), averaged hourly. . . 105
5.4 A large fraction of the requests are for a small fraction of the objects. . . 105
5.5 The architectural components of a content cache that uses disk
shutdown. . . 106 5.6 The Hybrid cache sizing algorithm. . . 108
5.7 Hit rate curve (HRC) shows the relation between cache size and hit
rate. . . 110 5.8 Comparing the hit rate performance of the different cache sizing
algorithms with the hit rate ofNOOFF that does not shut down
disks. . . 112 5.9 The storage-based cache sizing algorithm occasionally overloads the
disks, since it does not factor in disk load. This deficiency can be
corrected with a hybrid scheme. . . 113 5.10 Fixed disk shutdown provides a better energy-performance tradeoff
than Random disk shutdown. . . 116 5.11 Fixed replicates content less thanRandom resulting in a more efficient
use of the cache space. . . 116 5.12 Energy-performance tradeoff of content placement & eviction
algorithms. . . 119 5.13 Energy-performance tradeoff of disk shutdown within a cluster. . . 121 5.14 Cluster hit rate provide a better energy-performance tradeoff because
CHAPTER 1
INTRODUCTION
Content delivery networks (CDNs) cache and serve trillions of user requests every day for a diverse set of content such as web pages, videos, software downloads, images and applications, among others. Content providers such as web portals, SaaS appli-cation providers, e-commerce sites, news outlets, media companies, social networks, and movie distribution services use CDNs to host and deliver their content. CDNs are now ubiquitous and are key to the functioning of the Internet, as most of the content accessed by users are served by such networks. It is estimated that 71% of all online content will be delivered by CDNs in 2021 up from 52% in 2016 [62].
A large CDN has a deployed network of hundreds of thousands of cache servers distributed throughout the world. The servers are deployed inclustersthat are located in over a thousand data centers around the world. When a user requests content that is hosted on the CDN, the request is mapped to a proximal server in the network (see Figure 1.1). If the server has the requested content in its cache (i.e., a “cache hit”), it is delivered to the user. If the content is not available in the sever, it is fetched from one of its peers within the cluster (i.e., a “cluster hit”) and served to the user. If the content is not available in the network (i.e., a “cache miss”), it is fetched from the content provider’s origin that has the original copy of the content.
1.1
The role of caching in CDNs
CDNs efficiently deliver content by caching the requested objects at the closest edge servers. A cache hit is highly desirable because user requests do not traverse the
Cache& server User Origin&server Content&fetched& from&the&origin& Content&fetched&from& a&peer&in&the&cluster
Figure 1.1: Content is served from the cache of a CDN server, from one of its peers within the same cluster, or from the content provider’s origin.
high latency WAN to retrieve content from the origin server that might be far away. While a cache hit is the best case scenario, a cluster hit isn’t much worse. During a cluster hit, the response time for serving the object is increased due to the additional overhead of fetching content from a peer. This could increase the latency to the order of several hundred microseconds to a few milliseconds but is still much better than a cache miss which could add hundreds of milliseconds of latency to each request. A cluster hit is therefore still desirable, and a cache miss is the least desirable.
1.1.1 Performance and cost metrics of a CDN
A CDN is designed to optimize several performance and cost metrics. We discuss three important metrics that are relevant to this dissertation.
1) End-user latency: End-user latency is the time elapsed between requesting content from a CDN and receiving a response at the end-user. Users experience a small latency during a cache hit. On the other hand, during a cache miss, the request has to traverse the high latency WAN link to retrieve content from the origin servers.
2) Bandwidth cost: Bandwidth cost of a CDN has two parts. The egress bandwidth cost is the cost of serving egress traffic from the edge servers to the users. This is not a cost overhead for the CDN and is paid by the content provider. On the other hand,
the midgress bandwidth cost is the cost due to midgress traffic which is the cache miss traffic from the edge servers to the origin servers. This is a cost overhead for the CDN and reducing the midgress bandwidth cost can lead to significant savings in the operating expenses of the CDN.
3) Energy cost: Energy cost is the cost associated with powering and running the servers that host the requested content and the networking equipment that route requests within the data center. The energy cost also includes the cost of cooling the servers and networking equipment, to prevent overheating due to continuous use. The energy cost constitutes a significant fraction of the operating expenses of a CDN and any reduction will result in large savings. Moreover, energy reduction also reduces the carbon emissions which is good for the environment.
A fourth metric that relates the three performance and cost metrics described above is thecache hit rate. There are two notions of cache hit rate. Theobject hit rate (OHR)is the percentage of requests that are found in cache. Thebyte hit rate (BHR)
is the object hit rate weighted by the object size. A larger cache hit rate leads to an increasedorigin offload ratiowhich is the ratio of the total traffic served to users to the traffic served by the origin servers. An increased origin offload ratio ensures a smaller end-user latency due to fewer cache misses and reduced load at the origin. A larger cache hit rate also reduces the midgress traffic which in turn reduces the midgress bandwidth cost. On the other hand, a large number of active servers are required to achieve high cache hit rates. This could lead to an increase in the energy cost for the CDN. Hence, optimizing the energy cost presents a cost-performance tradeoff that a CDN operator should take into consideration. From multiple perspectives, cache hits at the edge servers are highly desirable and maximizing the cache hit rate while being cognizant of its impact on different performance and cost metrics is a recurring theme throughout this dissertation.
1.2
Traffic provisioning and cache management in CDNs
When users request content that is hosted on a CDN, the requests are classified into traffic classes. A traffic class is a collection of domains that host a specific type of content belonging to one or more content providers with similar requirements. For example, CNN videos and Apple iOS software downloads are each examples of a traffic class. Large CDNs host content that belong to thousands of domains which can in turn be classified into hundreds of traffic classes.
A large CDN is composed of several subsystems that work together to maximize cache hits. Traffic provisioning and cache management are two important systems (Figure 1.2) that perform complementary functions.
Traffic provisioning
Cache management Servers
Traffic classes
Figure 1.2: The traffic provisioning and cache management systems work together to maximize the cache hit rate of the CDN.
1.2.1 Traffic provisioning
The traffic provisioning system operates at a higher level and determines what stream of user requests are directed to each server in the CDN. Traffic provisioning is the process of deciding what mix of traffic classes are to be cached and served by each cluster (resp. server) to maximize the cache hit rate. As shown in Figure 1.2, the traffic provisioning system decides which clusters (resp. servers) serve what fraction of each traffic class such as CNN videos, Facebook images, or Microsoft downloads. The goal of traffic provisioning is optimizing metrics that are important to the CDN, such as maximizing the aggregate hit rate of each cluster (resp. server) and the specific
hit rates of each traffic class that it hosts. Once traffic provisioning is complete, the
mapping system routes user requests to their appropriate servers in real time. The reader is referred to [26, 92] for a more detailed description of the mapping system in the world’s largest CDN.
1.2.2 Cache management
The cache management system operates at the level of an individual cluster or server. Each server maintains a cache that stores content requested by users. The cache management system is composed of two policies that manage the content cached in the servers. A cache admission policy decides if an object should be cached in the server. A cache eviction policy decides which existing object(s) should be evicted from cache when space needs to be created for a newly admitted object. Then, given a stream of requests for a mix of traffic classes hosted in the cluster (resp. server), the goal of the cache management system is to determine how to admit and evict objects to maximize the cache hit rate.
1.3
Challenges in traffic provisioning and cache management
and proposed solutions
The complexity of content distribution and the diversity of performance and cost metrics pose challenges for efficient traffic provisioning and cache management. We list four challenges that we address in this dissertation and briefly describe the pro-posed solutions.
1.3.1 Predicting caching characteristics of traffic mixes using footprint descriptors
Challenge: Provisioning and controlling the sharing of the available cache space in a server or cluster of servers among the hundreds of traffic classes hosted on a CDN is an important and challenging operational area. It has direct impact on the
cost-performance tradeoff of the CDN. The wide variability in popularity distribu-tions, object size distributions and caching performance across traffic classes makes it challenging to predict the hit rate of traffic mixes that share the cache space. This in turn affects traffic provisioning across the CDN. Developing better caching mod-els that accurately capture popularity and caching characteristics will enable better traffic provisioning and cache management.
Proposed solution: Managing a vast shared caching infrastructure requires careful modeling of user request sequences for each traffic class. We introduce the notion of a footprint descriptor that is a succinct representation of the cache requirements of a request sequence. Leveraging novel connections to Fourier analysis, we develop a footprint descriptor calculus that allows us to predict the cache requirements when different traffic classes are added, subtracted and scaled to within a prediction error of 2.5%. We integrated our footprint calculus in the traffic provisioning operations of a production CDN and show how it is used to solve key challenges in cache sizing, traffic mixing, and cache partitioning. This work has been published in ACM CoNEXT [107].
1.3.2 Midgress-aware traffic provisioning
Challenge: Traffic provisioning is traditionally performed by an operator who makes ad hoc decisions based on past experiences. This can be sub-optimal due to the wide variability in the popularity and caching characteristics of traffic classes that are hosted on a CDN. The holy grail of traffic provisioning is to optimally map traffic classes to clusters (resp. servers) automatically without human intervention at all. Such automation should achieve different performance objectives such as minimizing the cache miss traffic or minimizing the end-user latency, while also taking into ac-count the resource constraints that are imposed by the clusters (resp. servers) in the network.
Proposed solution: We formulate traffic provisioning across the CDN as a mixed integer linear problem. We propose algorithms that provision traffic classes to servers and clusters such that the midgress traffic is minimized and no server is overloaded. Using extensive traces from Akamai’s CDN, we show that our midgress-aware traffic provisioning schemes can reduce midgress by nearly 20% in comparison with the midgress-unaware schemes that are currently in use. We also propose an efficient heuristic for traffic provisioning that achieves near-optimal midgress reduction and is suitable for use in production settings. Further, we show how our algorithms can be extended to other settings that require minimum caching performance per traffic class and minimum content duplication for fault tolerance. Finally, our work provides a strong case for implementing midgress-aware traffic provisioning in production CDNs. This work is under submission.
1.3.3 Adaptive cache management using TTL-based caching
Challenge: CDNs would like to guarantee certain caching performance such as a minimum cache hit rate or maximum cache space usage, for every traffic class. But, it is difficult to do so in the face of increasing variability in user demands and the characteristics of traffic classes served. Moreover, the request distribution in pro-duction settings are non-stationary and difficult to model and analyze theoretically. Developing cache management algorithms that adapt to such non-stationarity will enable better use of caching resources and the ability to provide better performance guarantees.
Proposed solution: TTL-based caching algorithms enable better control on the cacheability of content. We propose two TTL-based caching algorithms that have provable guarantees for bursty and non-stationary request traffic. The first algorithm called d-TTL adapts a TTL parameter using stochastic approximation to converge to its target hit rate. The second algorithm called f-TTL adapts two TTL parameters
using stochastic approximation to converge to the dual target of hit rate and the expected cache size, provided they are feasible. Using extensive traces from Akamai, we show that both algorithms converge to their hit rate targets with a small error of less than 2.3%. But f-TTL requires significantly smaller cache size since it uses one of the TTL parameters to filter out non-stationary and unpopular content. This work has been published in IEEE/ACM Transactions on Networking [7].
1.3.4 Energy-efficient caching using disk shutdown
Challenge: So far, we have focused on addressing challenges related to cache hit rates which indirectly affect the performance and cost metrics such as the end-user latency and the bandwidth cost. But CDNs are also concerned about the energy consumption of the networks. Energy minimization has become critical for two rea-sons. Deployed servers in data centers now account for more than 1.5% of the global power consumption [77], consuming more power than mid-sized countries such as Ar-gentina.With greater awareness of climate change, the CDN industry is increasingly focused on making their systems more sustainable.
A second motivator is the rising cost of energy. The cost of energy has been rising over the past decade [8]. The cost structures at most data centers are such that energy cost presently ranges between 30-50% of the total operating expense, and is expected to only rise further in the coming decades. Hence, CDNs have great incentive to reduce the operating expenses by being energy-efficient.
Proposed solution: Each CDN server has multiple spinning disks that are used for caching content. These disks account for 40-55% of the total server energy usage of a CDN. Reducing the energy consumption of a CDN by shutting down some of the disks is the main focus of our work. We propose and evaluate cache management schemes that allow disks to be shut down without significantly impacting cache hit rates and user-perceived performance. We empirically evaluate the energy-performance tradeoff
of our algorithms using extensive request traces from Akamai. We show that it is feasible to obtain a 30% disk energy savings with a 6.5% reduction in the normalized server hit rate and a mere 3% reduction in the normalized cluster hit rate. This work establishes disk shutdown as a key mechanism for energy savings in CDNs. This work has been published in ACM e-Energy [108].
1.4
Dissertation outline
We characterize the variability of traffic classes served by a CDN in Chapter 2. We also develop the theory of footprint descriptors and show how they can be used to predict the caching characteristics of traffic mixes. In Chapter 3, we develop optimization models for traffic provisioning to minimize midgress across the CDN. We also develop heuristic algorithms that can be deployed in practice. In Chapter 4, we describe a cache management scheme using adaptive TTLs to guarantee cache performance metrics. In Chapter 5, we describe how disk shutdown can be used to make the cache management system energy-efficient without significantly impacting the cache hit rate. We conclude in Chapter 6 with a summary of the proposed algorithms and some ideas for future work.
CHAPTER 2
TRAFFIC MIXING USING FOOTPRINT DESCRIPTORS
A large CDN hosts content from tens of thousands of domains belonging to web sites of thousands of content providers. Further, each content provider may host different types of content, including web, downloads, videos, and images1. The content traffic served by CDNs are in turn classified into traffic classes. A global CDN hosts content belonging to hundreds of traffic classes. Requests from users accessing the content provider’s web sites are routed by the CDN to an appropriate cache server that can serve the content using a process called mapping [26].
A CDN performs traffic provisioning and request routing at the granularity of a traffic class. Thus, a key decision a CDN must make is which subset of its hundreds of thousands of servers must serve which traffic classes. Different traffic classes may have different caching characteristics and different performance requirements. A traffic class consisting of web content from an e-tailer may require fast response times and high cache hit rates to aid more sales conversions, and the object sizes are smaller. In contrast, a traffic class consisting of background software downloads has large object sizes, but can tolerate lower hit rates and slower response times.
– Traffic provisioning: Traffic provisioning is the process of determining which traffic classes are hosted in which cache servers of the CDN, given a vast platform of cache servers with varying amounts of cache space available at each server. Despite the
1Content providers often segregate their content by type and place them on different domains for better content management and delivery. For instance, a content provider may have a different domain for each content type, such as{www,video,image,download}.foo.com.
potentially diverse requirements for each traffic class, it is economically and opera-tionally advantageous for the CDN to use a single shared platform of servers to serve all the traffic classes and to have each cache serve multiple traffic classes. However, such sharing across multiple traffic classes poses significant challenges that are the focus of this work.
Provisioning traffic classes and controlling the sharing of the available cache space between those classes to maximize cache hit rates is an important challenge with direct impact on the cost-performance tradeoff of the CDN. For example, servers hosting an aggressive mix of traffic classes relative to the available cache space may end up providing poor cache hit rates. This may violate the performance requirements for some classes, and raise bandwidth cost due to elevated midgress traffic. Conversely, servers hosting a conservative mix of traffic classes may end up underutilizing their resources, which makes the CDN buy more servers than necessary.
The goal of traffic provisioning is to model the caching requirements of traffic classes and to predict the best way to assign traffic classes to cache servers, so as to optimize the use of the cache resources and provide an acceptable hit rate at a reasonable cost. To do so, the process takes as input the sizes of the caches available in servers across the CDN, and the characteristics of the request sequences for each traffic class. The process outputs the set of servers that serve each traffic class. Traffic provisioning is an offline planning step but it must be performed regularly, since new traffic classes are added or removed to the system and caching characteristics of existing classes may change. Once traffic provisioning is complete, its output is used by a mapping system to route the requests of each traffic class to one of the provisioned cache servers in real-time.
– Challenges and contributions: The main conceptual challenges in traffic provisioning and our contributions in addressing those challenges are below.
1) To provide effective traffic provisioning, we need to first understand the diver-sity of traffic classes hosted on a modern CDN, and how they vary in terms of user request patterns, content popularity, object sizes, and caching requirements. In Sec-tion 2.1, we provide the first detailed characterizaSec-tion of traffic classes on a modern CDN.
2) The user requests for each traffic class must be modeled efficiently from the traces. While traces may contain hundreds of millions of requests, the model must be
concise, and must be able topredictthe resource-performance tradeoffs for caches that serve that traffic class. In Section 2.2.1, we propose the novel notion of a footprint descriptor (FD) that is computed efficiently from user request traces of that traffic class. Using footprint descriptors, we can derive the full tradeoff between cache size and hit rate for each traffic class.
3) A main goal of traffic provisioning is to answer important “what-if” questions through modeling and prediction. Examples of such questions include: what would the hit rate be when multiple traffic classes are mixed together and served by a single shared cache? How should you partition a cache across multiple traffic classes, so that each class receives its target hit rate? How would the hit rates change if the traffic volume of a traffic class is increased? In Section 2.2.3, we develop a calculus for footprint descriptors that lets us perform addition, subtraction, and scaling operations on request sequences. The calculus lets us model, predict, and answer the key “what-if ” questions that arise in the traffic provisioning context. For instance, the calculus allows us to efficiently compute the footprint descriptor of a mix of traffic classes, given the footprint descriptors of each individual class in the mix.
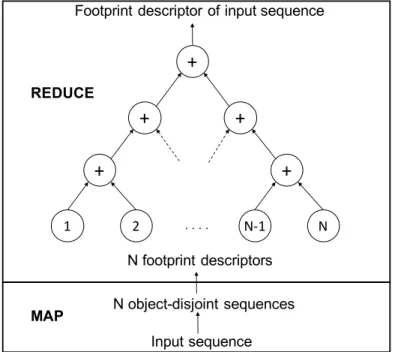
4)Traffic provisioning must be able to process and manipulate traffic class models in anefficient fashion. In Section 2.2.3, we show an intriguing connection to Fourier analysis that lets us visualize and manipulate footprint descriptors. Specifically, we show how Fast Fourier Transform (FFT) can be used to transform footprint
descrip-tors to the “frequency” domain. Analogous to how signal processing can be speeded up by using Fourier Transforms, we show how footprint descriptors can be efficiently manipulated in the frequency domain.
5) The models used in traffic provisioning should provide predictions that are ac-curate enough to use in production CDN operations. In Section 2.3, we highlight the need for footprint descriptor calculus through simulations using traces from production servers. We also compare our predictions with hit rates from the production network and show that the prediction error is at most 2.5% in the scenarios considered. In Section 2.4, we show how footprint descriptors are used to solve key challenges in CDN operations.
– Footprint descriptor modeling versus cache simulations: In theory, one could eval-uate the hit rates of different traffic class mixes by experimentally simulating cache operations on each request trace mix. But, simulating various combinations of several hundred traffic classes for different cache sizes is unscalable and prohibitively expen-sive, even for an offline computation, since it must be repeated periodically (say, every few days). With our approach, the footprint descriptor is computed for each traffic class only once (Section 2.4.3 shows how to compute FDs efficiently using a map-reduce paradigm) and traffic mixes are evaluated rapidly using footprint descriptor calculus. The power of footprint descriptors is that it needs to be computed only once for each traffic class from the voluminous traces. Various operations on traffic classes can then be performed rapidly using the calculus without costly cache simulations of traffic class mixes.
– Roadmap: The rest of this chapter is organized as follows. In Section 2.1, we describe the characteristics of the different traffic classes hosted on the CDN. In Section 2.2, we introduce the notion and develop the theory of footprint descriptors. In Section 2.4, we show how footprint descriptors can be used in a production setting for CDN cache operations. In Section 2.5 we review prior work and conclude in Section 2.6.
2.1
Traffic class characteristics
Each domain hosted on the CDN can be thought of as generating a request se-quence that consists of users requesting content from that domain. A domain also belongs to a traffic class, where each traffic class is a set of domains from a set of sim-ilar content providers, usually serving a specific content type. A request sequence for a traffic class is simply a sequence of requests received for some domain within that class. The major traffic classes in a modern CDN have content types that are either web sites, videos, images, or downloads. A large CDN may host tens of thousands of domains from thousands of content providers that form several hundred traffic classes. The main challenge in traffic provisioning is the diversity of access patterns, object sizes, and resource requirements across different traffic classes.
2.1.1 Trace collection
To illustrate this diversity of traffic classes in a quantitative fashion, we col-lected extensive traces from Akamai’s production CDN for four representative traf-fic classes from two production cache servers in Akamai’s CDN. The data set con-tains anonymized logs of content accessed by end-users. Each line in the production trace corresponds to a single request and contains a timestamp, the requested URL (anonymized), and the size of the object.
The four representative traffic classes each represent a major content type: web, downloads, videos and images. The web request trace is for HTML objects and asso-ciated objects such as css and javascript files. The downloads request trace contains predominantly large objects consisting of software updates from a content provider. The image trace contains images embedded in web pages. The video trace contains video-on-demand (VOD) objects. Typically the objects belonging to the download and video traffic classes are several GB in size. But, in our traces, these objects are smaller because a CDN fragments such large files to smaller chunks to avoid caching
the entire object. CDNs typically cache only the byte-range that is requested and a few extra bytes, anticipating future requests (spatial locality). Videos are normally served in chunks that correspond to a few seconds of the video. Hence, CDNs typ-ically only cache those chunks that are requested to avoid polluting the cache with content that has not been requested.
We collected the web and download traces from one production server and the image and video traces from the other production server. The characteristics of these traces are described in Table 2.1. We also collected additional web, download, image and video traces from two more servers to evaluate the accuracy of our cache models. These traces are described in Section 2.3.
Traffic class Web Download Image Video Length of trace (days) 2.5 2.5 3.5 3.5
Arrival rate (req/s) 520 77 52 57
Traffic volume (Mbps) 333.0 216.5 8.4 361.5 Object count (millions) 10.3 0.7 1.3 6.1 Average object size (MB) 0.21 2.32 0.03 1.53
Table 2.1: Characteristics of the chosen traffic class traces.
2.1.2 Analysis of traffic classes
We compare and contrast the four chosen traffic classes based on their popularity distribution, object size distribution and cache hit rate. Figure 2.1 shows the popu-larity distribution of each traffic class. For our download traffic class, we see that 92% of all requests are for only 10% of the objects. For our web traffic class, 87% requests are for 10% of the objects. Both of these traffic classes have a long tail of popularity, indicating the presence of a large amount of unpopular content. For our image traffic class, 90% requests are for 30% of the objects. Thefootprintof a set of objects is the total bytes that need to be stored in cache to serve those objects from cache. From the traces we collected, we observe that we can achieve a high cache hit rate with a
small footprint for our image class due to smaller object sizes. Finally, 90% of the requests in our video class are for 65% of the requested objects (i.e. requested video chunks), indicating that a larger footprint needs to be cached to achieve a good hit rate.
Figure 2.1: Popularity distribution of the 4 traffic classes.
Figure 2.2: Object size distribution of the 4 traffic classes.
Figure 2.2 shows the CDF of the object size distribution for each traffic class. The x-axis is shown in log scale for clarity. In general, we see that the image and web traffic
Figure 2.3: Hit rate curves of the 4 traffic classes.
classes have predominantly small objects and both the download and video traffic classes have predominantly large objects. The extreme variability in object sizes across traffic classes makes it challenging to manage cache resources across the CDN because different traffic classes require different amounts of cache space to achieve the same hit rate.
We compare the cache hit rate of the different traffic classes in Figure 2.3 by plotting their hit rate curves (HRCs) which gives the hit rate as a function of cache size. These hit rate curves were derived using footprint descriptors as shown in Section 2.2.2. The x-axis is shown in log scale for clarity. Note that we need a relatively smaller cache to achieve a large cache hit rate for the image traffic class, when compared to the video traffic class which needs a much larger cache for the same hit rate. For example, to achieve a hit rate of 60%, the image class requires a cache space of about 0.4 GB, whereas the video class requires a cache space of about 1 TB.
The extreme variability in popularity, object size and caching performance high-lights the importance of efficient traffic provisioning when caching content belonging to different classes in a shared server. Note that two traffic classes of the same content
type but different content providers may have different access characteristics and per-formance requirements. Thus, traffic provisioning is done on a per-traffic-class basis, rather than on content types.
2.2
Theory of footprint descriptors
We now describe a concise space-time representation of a traffic class called foot-print descriptor (FD) and derive a calculus for evaluating traffic mixes. Let ρ be a
request sequence hr1, r2,· · ·rni corresponding to a traffic class τ, where each request ri represents a user requesting an object belonging to that traffic class. Each request ri has associated with it the timestamp ti when the request was made, a unique
iden-tifier idi of the object (such as its URL), and the size of the object si. We denote a
subsequenceρ0 ofρto be the sequence of consecutive requestshri, ri+1,· · ·rjiofρ, for
some i ≤j. We call ρ0 a reuse subsequence if the same object is accessed in the first and last request of the subsequence, but is not accessed elsewhere in ρ0. It is known that reuse subsequences have great significance in evaluating caching properties in other contexts [85]. They play an important role in FDs and their calculus as well.
2.2.1 Footprint descriptors (FD)
A typical request streamρmay have tens of millions of requests. We would like to efficiently summarize the attributes of ρusing the notion of a footprint descriptor, so that we may answer questions regarding the cacheability of ρusing FD. To that end, we define the FD of ρas the tuplehλ, Pr(s, t), Pa(s, t)i, whereλ is the traffic volume (in bits requested per second), Pr(s, t) is the reuse-sequence descriptor function, and Pa(s, t) is the all-sequence descriptor function. We describe each component of FD
below.
1) The traffic volume λ is the average number of bits requested per second in the request sequence ρ. For a sequence ρ with n requests, the traffic volume λ =
(P
ibi)/(tn−t1), where bi denotes the number of bits requested by the i
th request
and ti denotes the time of the ith request.
2) The reuse-sequence descriptorPr(s, t) is a“space-time”description of the
reuse-subsequencesρ0 ofρ. In particular, it provides the joint probability distribution of the unique bytes s and the duration t for reuse subsequencesρ0 of ρ. The unique bytes s accessed in ρ0 is simply the sum of the sizes of all the unique objects requested in ρ0. The duration oft ofρ0 is the difference in timestamps of the first and the last request in ρ0. Then, Pr(s, t) is the probability that s unique bytes of content is requested in some reuse sequence ρ0 of durationt. Given a request sequence ρ, Pr(s, t) can be
estimated by enumerating all its reuse sequences ρ0 and tallying its unique bytes s and duration t. Note that the unique bytes and duration on the first access of any object is infinity. This accounts for the cold cache miss rate.
3) The all-sequence footprint descriptor Pa(s, t) computes a similar statistic, but
using any subsequence ρ0 of ρ, i.e., ρ0 is not necessarily a reuse subsequence and the first and last request of ρ0 can be arbitrary. Pa(s, t) is the probability that s unique bytes of content is requested in some subsequence ρ0 of duration t. Given a request sequence ρ, Pa(s, t) can be estimated by enumerating all its subsequences ρ0 and
tallying the unique bytes s and duration t.
2.2.2 Estimating cache properties from footprint descriptors
A footprint descriptor is a succinct representation of a request sequence that allows us to predict the hit rate performance that can be achieved for that sequence. We now show that the hit rate curve (HRC) of a request sequence can be derived from its FD in the context of the commonly-implemented Least-Recently-Used (LRU) caching algorithm. Most production CDNs use extensions of LRU, including Akamai [81], Varnish [67] and NGINX [101].
Theorem 2.2.1. The hit rate curve HRC(s) for a request sequence ρ is a function that provides the hit rate achieved for ρ by an LRU cache of size s. The function HRC(s) can be computed from the reuse-sequence descriptorPr(s, t) as follows.
HRC(s) = X
s0≤s X
t
Pr(s0, t).
Proof. Let ρ0 = hri, ri+1,· · ·rji be a reuse sequence of the request sequence ρ. That
is, ri and rj are consecutive requests for the same object. For any cache of size s
that uses LRU, the request rj experiences a cache hit if and only if the unique bytes
requested inρ0 is at mosts, i.e., if the unique bytes is more thansthe object requested byri that enters the cache will get evicted by the time the next request for the same
object arrives atrj. Thus, the hit rateHRC(s) is simply the probability that a reuse
sequence has unique bytes that is at mosts, which in turn equals P s0≤s
P
t
Pr(s0, t).
Besides LRU, the above theorem can be extended to other stack algorithms using the well-known relationship between unique bytes in a reuse sequence (called the stack distance) and hit rate [85].
2.2.3 A calculus of footprint descriptors
The power of footprint descriptors is that it can support operations on request sequences that are important for traffic provisioning. We present three key operations, addition, subtraction, and scaling. In Section 2.4, we show key applications of these operations in traffic provisioning in the production network.
2.2.3.1 Addition
Letρ1 andρ2 be two request sequences that are independent and share no common objects2. The addition operator ⊕ can be applied to the two sequences to obtain a new sequenceρ which we represent asρ=ρ1⊕ρ2. Request sequenceρis obtained by interleaving ρ1 and ρ2 in accordance with the time stamp for the requests. We now show how the footprint descriptor F D = hλ, Pr, Pai for ρ can be derived from the footprint descriptor F D1 =hλ1, P1r, P1ai forρ1 and F D2 for ρ2 =hλ2, P2r, P2ai.
The traffic volume λ of ρ is simply the sum of the traffic volumes of ρ1 and ρ2, i.e.,
λ=λ1+λ2 (2.1)
To compute the descriptor functions, we introduce some notation. Given a de-scriptor function P(s, t), let P(s | t) denote the conditional probability of unique bytes s given time duration t and let P(t) denote the marginal distribution, i.e., P(t) =P
sP(s, t). Thus,
P(s, t) =P(s|t)P(t). (2.2) The key observation of our calculus is that when two request sequences are com-bined, i.e., ρ = ρ1 ⊕ρ2, and we examine a subsequence ρ0 of ρ of duration t with s unique bytes, the unique bytess inρ0 either come fromρ1 orρ2. Since ρ1 andρ2 have non-overlapping sets of objects, somes1 must come fromρ1 and the remaining s−s1 must come from ρ2. Thus, to compute a descriptor function P(s | t) for ρ from the descriptor functions P1(s |t) and P2(s |t) for ρ1 and ρ2 respectively, we can use the convolution operator to enumerate and add up the probabilities of all possible ways
2The assumption that two traffic classes share no common objects is reasonable in practice, since the objects belong to different domains from possibly different content providers. Such objects are treated as being different by the caching system.
of obtaining s1 unique bytes fromρ1 and the remaining s−s1 unique bytes fromρ2. That is, P(s |t) = P1(s|t)∗P2(s|t) = s X s1=0 P1(s1 |t)P2(s−s1 |t).
Using this observation, we now compute Pr(s | t) of ρ fromhP1r(s |t), P1a(s | t)i of ρ1 and hP2r(s |t), P2a(s | t)i of ρ2 as follows. Let ρ0 be a reuse sequence of ρ, i.e., the first and the last request of ρ0 is for the same object. Let ρ0 haves unique bytes and duration t. ρ0 can be broken up into two subsequences ρ01 of ρ1 and ρ02 of ρ2. With probability λ1λ1+λ2 the first (and, last) request of ρ0 is derived from ρ1. That is, ρ0 is composed of a reuse sequence ρ01 and an arbitrary sequence ρ02. Similarly, with probability λ1λ2+λ2, ρ0 is composed of a reuse sequence ρ02 and an arbitrary sequence ρ01. Thus, Pr(s|t) = λ1 λ1+λ2 (P r 1(s|t)∗P a 2(s|t)) + λ2 λ1+λ2 (P1a(s |t)∗P2r(s|t)), (2.3)
where ∗ denotes the convolution operator. We can also compute Pa(s | t) from Pa
1(s | t) and P2a(s | t). The computation is analogous to the above, except that ρ0 can be an arbitrary sequence of ρ, not necessarily a reuse sequence. Since ρ0 is composed of two arbitrary subsequences of ρ1 and ρ2, our computation involves only one convolution below.
Pa(s|t) = P1a(s|t)∗P2a(s|t). (2.4)
Note that the convolution operator ∗ arises naturally in our calculus, allowing us to leverage the powerful tools of Fourier analysis for the efficient computation of
footprint descriptors. Putting together Equations 2.1, 2.2, 2.3, and 2.4 above, we can compute the FD of ρ from the FDs of ρ1 and ρ2 as we show in more detail in Algorithm 1.
Algorithm 1 Addition algorithm
Input: F D1 = hλ1, P1r, P1ai, F D2 = hλ2, P2r, P2ai, S and T be the buckets for s and t
respectively Output: F D=hλ, Pr, Pai 1: λ=λ1+λ2 2: for allt ∈T do 3: Pr(t) = λ1λ1+λ2P1r(t) +λ1λ2+λ2P2r(t) 4: Pa(t) = λ1λ1+λ2P1a(t) + λ1λ2+λ2P2a(t) 5: for all s ∈S do 6: Pr(s|t) = λ1 λ1+λ2 (P1r(s|t)∗P2a(s|t)) +λ1λ2+λ2(P1a(s|t)∗P2r(s|t)) 7: Pr(s, t) =Pr(s|t)Pr(t) 8: Pa(s|t) =P1a(s|t)∗P2a(s|t) 9: Pa(s, t) =Pa(s|t)Pa(t)
Time complexity: We can use Fourier analysis to speed up the computation of the addition operation. Let S and T be the maximum value buckets for s and t respectively. The addition operation can be performed in O(T SlogS) time, since we need to perform 3 convolution operations in total for Equations 2.3 and 2.4 for every value oft, where each convolution takesO(SlogS) time using Fast Fourier Transform algorithm (FFT) and t takes on T values.
Inferring the individual hit rates of ρ1 and ρ2 after addition: Let the hit rate curves HRC10(s) andHRC20(s) represent the post-addition individual hit rate curves of ρ1 andρ2 within ρ1⊕ρ2, i.e. HRCi0(s) is the post-addition hit rate ofρi when the
traffic mix occupies cache capacitys. Then,HRC10(s) andHRC20(s) can be computed as follows. HRC10(s) = X s0≤s X t Pr(s0 |t)P1r(t). HRC20(s) = X s0≤s X t Pr(s0 |t)P2r(t). (2.5)
2.2.3.2 Subtraction
The subtraction operation models the traffic provisioning operation of removing some traffic classes from the list of traffic classes served by a cache server. The result of that operation is that the request stream corresponding to those traffic classes are subtracted out. Given a request sequence ρ1 that is a subsequence of ρ, we define ρ2 =ρ ρ1 to be the sequence obtained when the requests of ρ1 are removed fromρ. We show how the FD of the resultant sequence ρ2 can be obtained from the FDs for ρ and ρ1. Note that we relate the request streams with the addition operator, i.e., ρ=ρ1⊕ρ2. Thus, the FD ofρ2 can be computed by simply “inverting” Equations 2.1, 2.3, and 2.4 that we derived earlier for addition. By inverting Equation 2.1, we get
λ2 =λ−λ1 (2.6)
The key idea for finding the descriptor functions is that the convolution A = B ∗C can be inverted by using the frequency domain, i.e., C = F−1(F(A)/F(B)), where F and F−1 are Fourier transform and its inverse respectively. Thus, inverting Equation 2.4 we get
P2a(s|t) = F−1(F(Pa(s|t))/F(Pa
1(s |t))). (2.7)
To findPr
2(s|t), we use Equation 2.3 to first compute P2r(s |t)∗P1a(s|t). Then, since we know Pa
1(s | t), we can compute P2r(s | t) by using the Fourier transform and its inverse as above. We provide the details of the subtraction algorithm in Algorithm 2. Pr
2(s|t) on line 8 in Algorithm 2 is computed from Equations 2.3 and 2.7.
Time complexity: Let S and T be the maximum value buckets for s and t
re-spectively. The subtraction operation can be performed in O(T SlogS) time, since t takes on T values, we need to perform O(1) Fourier (or, inverse Fourier) transforms
Algorithm 2 Subtraction algorithm
Input: F D =hλ, Pr, Pai,F D1=hλ1, P1r, P1ai,S andT be the buckets forsand t
respec-tively Output: F D2 =hλ2, P2r, P2ai 1: λ2 =λ−λ1 2: for allt∈T do 3: P2r(t) =Pr(t)− λ1 λ1+λ2P r 1(t) λ1+λ2 λ2 4: P2a(t) =Pa(t)− λ1 λ1+λ2P a 1(t) λ1+λ2 λ2 5: for all s∈S do 6: P2a(s|t) =F−1(F(Pa(s|t))/F(Pa 1(s|t))) 7: P2a(s, t) =P2a(s|t)P2a(t) 8: P2r(s, t) =P2r(s|t)P2r(t)
for each value of t, and each Fourier (or, inverse Fourier) transform takes O(SlogS) time using FFT.
2.2.3.3 Scaling
Suppose we wish to increase or decrease the traffic volume for a request sequence ρ1. This operation is called scaling and we express the new request sequenceρ =ρ1⊗τ, where τ is the factor by which the volume is increased (resp. decreased). We model the volume increase (resp. decrease) as scaling the time variable, i.e., the time stamp of each request in ρ1 is divided by the factor τ. This has the effect of decreasing (resp. increasing) the inter-arrival times for the requests by τ when τ > 1 (τ < 1). We compute the FD ofρ from the FD of ρ1 as follows.
λ=λ1τ;Pr(s, t/τ) = P1r(s, t);P
a(s, t/τ) = Pa
1(s, t). (2.8)
It is worth noting that scaling does not change the hit rate curve of Pr(s, t/τ) since
the marginal distribution of Pr(s) =P1r(s).
Time complexity: Let S and T be the maximum value buckets fors and t respec-tively. The computations in Equation 2.8 can be performed in O(ST) time, faster than addition or subtraction.
Note: It should be noted that the footprint descriptor calculus described in this section predicts the byte hit rate of a request sequence, which is the metric considered in this work. The calculus works just the same to predict the object hit rate, with the slight modification that λ for a request sequence ρ is the arrival rate in requests per second rather than in bits per second. Also, note that the calculus allows us to compute the FD of complex traffic mixing operations by composing the three supported operators. For example, to subtract a subclass τ10 from a class τ1 and add the resultant to half the volume of class τ2, the FD of the final mixτ = ((τ1 τ10)⊕ (τ2⊗1/2)) can be computed efficiently using the calculus and FFT from the FD’s of τ1, τ10 and τ2.
2.2.4 A simpler footprint descriptor (SFD)
In this section, we outline a simplification of footprint descriptors that makes im-plementations faster, at the cost of some theoretical rigor. Empirically, we observed that on production traces the descriptor functions Pa(s, t) and Pr(s, t) were
statis-tically similar, i.e., the reuse sequences that start and end in a request for the same object, and arbitrary sequences that do not have the reuse property were statistically similar. The reason is that request sequences have requests for millions of different objects, and conditioning on starting and ending on a request for the same object does not alter the statistical behavior of the rest of the sequence very much. There-fore, a simpler footprint descriptor (SFD) is a tuplehλ, Pr(s, t)i, i.e., the all-sequence descriptor Pa(s, t) is dropped since it is similar to reuse-sequence descriptor Pr(s, t).
Having just one descriptor function makes computing SFD much simpler and faster for the addition and subtraction operations. For instance, ifPa(s, t) is assumed
iden-tical to Pr(s, t), Equation 2.4 simplifies to the following equation that requires just
one convolution instead of two.
Note that SFDs can be used to derive the cache hit rate curve HRC as described in Section 2.2.2, since it depends only onPr(s, t). For these reasons, we often use SFDs
in practice, in lieu of FDs.
2.3
Validation of footprint calculus
In this section, we validate the addition operation described in Section 2.2.3 by computing the hit rate curves using the footprint calculus on SFDs described in Section 2.2.4. We then compare the calculus predictions with the hit rates obtained via cache simulations using the production traces, a simple baseline algorithm, as well as hit rates obtained directly from the production server. Further validation of addition and subtraction also appears as part of the case studies in Sections 2.4.1.1 and 2.4.1.3 respectively. We do not validate the scaling operator since the hit rate curve after scaling remains unchanged.
Additional traces for validating scalability of addition: Our initial set of traces described in Table 2.1 were from servers that each served two major classes i.e., the top two traffic classes accounted for most of the traffic from the server. To validate the addition of more traffic classes, we chose two additional production servers one that served four traffic classes across the four content types of web, image, video and download and another server that served nine traffic classes across three content types, namely web, video and download. These new traces let us evaluate the accuracy of the calculus when a larger number of traffic classes are mixed. The details of the additional traces are described in Tables 2.2 and 2.3 respectively. In Table 2.3 we show nine different traffic classes that have web, video, and download content from different content providers.
Baseline traffic mixing algorithm: We describe a baseline traffic mixing algorithm commonly used in operations that predicts the cache hit rate of a traffic mix using only the hit rate curves of all traffic classes. For every value of the cache hit rate,
Traffic class Web Download Image Video
Length of trace (days) 1 1 1 1
Arrival rate (req/s) 223.53 51.04 216.42 180.01 Traffic volume (Mbps) 411.95 101.40 41.23 181.11 Object count (millions) 2.89 0.23 8.78 2.54 Average object size (MB) 0.3 0.4 0.02 0.24
Table 2.2: Characteristics of the 2nd set of traces.
Traffic class Web-1 Web-2 Web-3 Web-4 Video-1 Video-2 Video-3 Video-4 Download Length of trace (days) 8 8 8 8 8 8 8 8 8 Arrival rate (req/s) 168 16 6 3 53 21 4 3 22 Traffic volume (Mbps) 1105.4 114.7 1.8 0.002 292.6 112.4 21.6 14.9 234.5 Object count (mil-lions) 15 1.6 0.05 0.07 11.7 2.5 1.9 0.6 1.9 Average object size (MB) 1.6 1.9 0.05 1.7 0.7 0.8 0.7 0.9 2.0
Table 2.3: Characteristics of the 3rd set of traces.
the baseline algorithm determines the cache capacities for each traffic class from their respective hit rate curves and adds them up. The hit rate curve thus produced is the predicted curve for the traffic mix. For example, consider two traffic classes with hit rate curves HRC1(s) and HRC2(s) respectively. Then, the cache capacity required by the traffic mix to achieve hit rate his predicted asHRC1−1(h) +HRC2−1(h). This is repeated for all values of h to produce the hit rate curve of the mix.
The baseline algorithm described above is extremely simple and fast with time complexity O(S), for hit rate curves having S cache size buckets. While simple,
the baseline scheme does not account for the inter-arrival time distributions of the request sequences, and hence is an unreliable predictor of cache hit rates. We discuss the shortcomings in the following section.
2.3.1 Experimental evaluation
We show via simulations using production traces that the calculus is more accurate at predicting hit rates of traffic mixes and is necessary for traffic provisioning. For our simulation-based validation, we combine production traces corresponding to each traffic mix and perform a cache simulation on these merged traces for different cache sizes to obtain a hit rate curve. We call this the “simulated” hit rate curve. We also compute the hit rate curve of the traffic mix using the calculus. We call this the “calculated” hit rate curve. Finally, we compute the hit rate curve using the baseline algorithm and we call this the “baseline” hit rate curve.
Traffic mixes Average error of baseline, %
Average error of calculus, % web+download (Table 2.1) 0.24 0.13
video+image (Table 2.1) 0.63 0.10 Traffic classes in Table 2.2 10.2 0.28 Traffic classes in Table 2.3 11.8 0.34
Table 2.4: Average prediction error of the baseline algorithm vs. the FD calculus.
In Table 2.4, we present the average error of the baseline and the calculated hit rates with respect to the simulated values. We present the error for performing the addition operation for the web and download classes, and video and image classes in Table 2.1 and the addition of all classes in Tables 2.2 and 2.3. While the baseline algorithm has a small error for web+download and video+image from Table 2.1, the large difference and variability in error between the baseline algorithm and the calculus in general, and the consistently small average error of the calculus, highlight the need for the more accurate calculus in predicting the effects of traffic mixing.
We now discuss another scenario where the calculus is superior to the baseline algorithm. Very often, CDN operators need to predict the effects of traffic scaling on traffic mixing, to better provision caches under varying traffic conditions. For instance, CDN operators would like to know the hit rate of a traffic mix when the traffic volumes of one or more traffic classes are varied. We show that under such circumstances, the calculus (using the scaling operation in conjunction with addition) provides more reliable outputs than the baseline algorithm which responds erratically to traffic scaling.
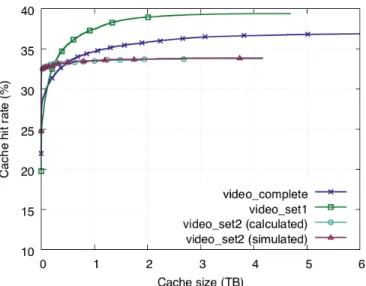
To illustrate this scenario, we consider the traffic mix of the traffic classes in Table 2.2. We consider two scenarios, 1) the traffic classes are mixed at their current traffic volumes (unscaled versions) and 2) we scale the traffic volume of the download traffic class up by 20 times, to 2028 Mbps, and predict the cache hit rate under traffic mixing in this new scenario (scaled versions). In Figure 2.4, we plot the “simulated”, “calculated” and “baseline” hit rate curves without scaling. We also plot the hit rates curves of the traffic mix (after scaling the download traffic class) predicted by the calculus (“calculated-scale”) and the baseline algorithm (“baseline-scale”). We refer to traffic mix web+image+video+download from Table 2.2 as “wivd”. We also zoom in on the x-axis for clarity.
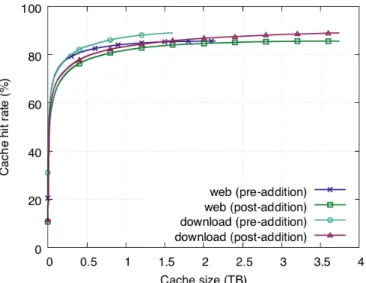
From Figure 2.4, we see that the hit rate curve predicted by the calculus, wivd(calculated), closely matches the simulated hit rate curve, wivd(simulated), with an average error of 0.28%. However, the error between the simulated curve, wivd(simulated), and the baseline scheme, wivd(baseline), without scaling is much higher at 10.2% on average, as previously discussed. After scaling the download traffic class up by a factor of 20, we see that the hit rate of the traffic mix, wivd(calculated-scale), in-creases as expected because the download traffic class dominates the mix (see the hit rate curve of the download traffic class labelled pre-addition in Figure 2.5). On the contrary, there is little change in the estimate of the baseline algorithm after scaling,
Figure 2.4: Hit rate curves of the traffic mix in Table 2.2 before and after scaling the download traffic class by a factor of 20.
Figure 2.5: Hit rate curves of traffic classes in Table 2.2.
wivd(baseline-scale), and the estimated hit rate is less than that of the calculus by 17.8% on average. This is because the baseline algorithm is unaware of the changes in the inter-arrival times of requests after scaling, which the calculus takes into account. We do similar comparisons for the other sets of traces. We scale up 20 times the image traffic class in the video+image mix in Table 2.1. We also scale up 20 times the download traffic class in both the web+download mix in Table 2.1 and the