Energy Efficient Residential Building Code for Arab Countries
George B. HANNA
Consultant, Emeritus Professor, Institute of Building Physics and Environment, Housing and Building National Research Center,
P. O. Box 1770, Cairo, Egypt,
E-mail: [email protected] & [email protected]
ABSTRACT: This paper presents an energy analysis to
support the Egyptian efforts to develop a New Energy Code for New Residential Buildings in the Arab Countries. Also, the paper represents a brief summary of the code contents specially, the effectiveness of building envelope and weather data in reducing electrical energy consumption. The impacts of the following parameters were studied namely; walls and roof constructions, window size and glazing type for different geographical locations in the Arab Countries. Two different distinguish weather classification were developed and analyzed and presented in this study, the DDC18.3& DDH 25. The first was developed by the Author to calculate DD using a mathematical model on electronic spread sheet. The second depends on the hourly values for each geographical location. The analysis includes the capitals and major cities representing most of the Arab countries. It was determined that the window to wall ratio (WWR) of 15% minimizes the total annual electricity use for the buildings. The Solar Factors (SF) and Window Orientation Factors (OF) were calculated for the eight wall orientations. The Over All Transfer Value (OTTV) was calculated for each orientation for different variables, e.g. WWR, Glazing Type, Shading, wall color and mid and top floor. The results show that the mass and types of building materials; WWR (15%), glass type and shutters; orientation; wall insulation (25mm), wall solar absorptivity (α=.3); roof insulation and shading effect enhance the thermal performance and reduces the cooling load by 60%.
INTRODUCTION
Residential buildings consume more than 50% of the total electricity consumption. Artificial lighting is estimated to account about 40% of the electricity used in the residential sector and 35% of the electricity used for HVAC system. A significant increase in electricity demand is expected over the next few years with a growth rate over 10%. To improve the energy efficiency in residential buildings, a New Arab energy Building Code had been developed for new residential buildings [1]. As part of the development of the energy code, simulation analysis has been carried for new residential buildings to determine the most cost-effective energy
efficiency measures suitable for Arab regions. Building envelope and fenestration components are considered one of the fundamental design features of energy-efficient buildings.
RESIDENTIAL BUILDING CODES
The Final Draft of the New Arab Building Energy Codes was approved by the League of Arab States (2010). The code contains 12 Chapters and 7 Appendices. It contains the following chapters:
1. SCOPE AND COMPLIANCE 2. GENERAL REQUIREMENTS 3. BUILDING ENVELOPE 4. NATURAL VENTILATION 5. HEATING VENTILATION & AIR 6. CONDITIONING
7. SERVICE WATER HEATING SYSTEM 8. DAY LIGHTING
9. LIGHTING
10. ELECTRICAL POWER
11. WHOLE BUILDING PERFORMANCE 12. DEFINITIONS, ABBREVIATIONS & ACRONYM.
ENERGY IN ARAB COUNTRIES
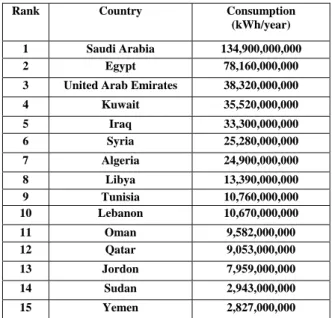
From the 1970s many countries throughout the world introduced building regulations aimed at reducing energy consumption in residential and commercial buildings, see table (1). Typically, these regulations concentrate on aspects of heat loss through the building envelope with minimum levels of insulation required being stated. Worldwide these regulations encompass resistance for individual opaque building elements. The simple prescriptive nature of most of the regulations reduces the need for complex calculation methods. Tables (2 & 3) show the crude oil and natural gas consumption during 2007 and the electricity consumption in most of the Arab Countries.
E le c tru c ity C o n s u m p tio n 2 0 0 8 /2 0 0 9
P ublic Lighting 6 .2 % Utilitie s 4 .2 % Gove rnm e nta l Entitie s 5 .0 % Agr ic ultur e 4 .1 % Indus tr y 3 3 .4 % Com m e rc ia l & O the r s 7 .8 % Re s ide ntia l 3 9 .2 %
Indus try A gric ulture U tilities P ublic Lighting G overnm ental E ntities R es idential C om m erc ia & O thers
Figure 1 Electricity Consumption 2008/2009
Table (1) Electricity Consumption for Selected Arab Countries
Table (3): Electricity Consumption in Arab Countries (2003)
Energy in Egypt
The current national energy supply mix in Egypt is; 95% from fossil fuel; (petroleum products 39.3% and natural gas 55.2%); 5% from renewable resources (mainly hydro and limited wind). The electricity generation activity utilizes around 30% of the fossil fuel and natural gas resources in addition to all the hydro and wind energies resources, see Fig.1.
BUILDING ENVELOP
Chapter two of the Code classified the climate of the Arab countries into several regions that have climatic conditions similar to selected cities of the Arab country. The climate must be identified in terms of the cooling degree-days based on 25 oC,
Arab
Countries Residential Industry Commercial
Egypt 37.1% 33.3% 2.5% Tunis 25.0% 47.0% -- Lebanon 5.0% 2.5% 2.2% Jordon 33.0% 31.0% 15.0% Bahrain 54.4% 17.4% 27.7% Saudi Arabia 51.1% 22.1% 10.2% Morocco 17.0% 34.0% 8.0% Tunis 16.0% 35.5% 9.0% Jordon 33.0% 31.0% 15.0% Algeria 36.8% 37.6% 6.2% Syria 49% 8% 31%
Table (2) Arab Energy Consumption 2007
Region Petroleum Consumption Dry Natural Gas Consumption Country (Thousand Barrels /Day) Billion Cubic feet Egypt 680.00 999 Libya 261.00 -- Morocco 184.00 -- Tunisia 88.50 -- Algeria 267.00 -- Sudan 85.70 -- Iraq 596.00 -- Jordan 106.00 79 Kuwait 325.00 441 Lebanon 94.00 0 Qatar 115.00 693 Saudi Arabia 2,210.00 2,594 Syria 269.00 221 United Arab Emirates 441.00 1,522 Yemen 141.00 -- Bahrain 36.00 400
Rank Country Consumption
(kWh/year)
1 Saudi Arabia 134,900,000,000
2 Egypt 78,160,000,000
3 United Arab Emirates 38,320,000,000
4 Kuwait 35,520,000,000 5 Iraq 33,300,000,000 6 Syria 25,280,000,000 7 Algeria 24,900,000,000 8 Libya 13,390,000,000 9 Tunisia 10,760,000,000 10 Lebanon 10,670,000,000 11 Oman 9,582,000,000 12 Qatar 9,053,000,000 13 Jordon 7,959,000,000 14 Sudan 2,943,000,000 15 Yemen 2,827,000,000
CDD25, and the heating degree-days based on 18.3 oC, HDD 18.3. Three methods should be used
to meet the building envelope requirements,
namely; perspective, trade-off compliance and whole building performance.
Perspective Requirements: the sum of the R-values of the insulation materials installed in the wall,
cavities and insulating sheeting (where used) must meet or exceed the minimum required "Wall R-value" for the appropriate climatic region, see tables 4.
Table (4) Recommended Thermal Resistance [2] for Different Arab Countries compared with leading Countries (m2.oC/W).
Envelope Trade-Off Compliance: The calculated Overall Thermal Transfer Value (OTTV, W/m2) requirements [4] for conditioned buildings may be used in the Prescriptive requirements.
To calculate the OTTV, the Solar Factors (SF) and the Orientation Factors (OF) must be calculated from the hourly, monthly and annual averages direct and diffuse solar radiations. The solar data were calculated for the eight orientations. were derived by normalizing the Maximum Solar Heat Gain Factors for June for each selected city in the Arab region [5].
Whole-Building Performance: The proposed design must comply with, if the annual (8760 hours) energy costs comply with the Standard design. The proposed design and the standard design must each be determined using the same approved energy analysis simulation tool, such as VDOE or Energy+.
Table (5): Glass Types Characteristics [4]
Natural Ventilation
The requirements in this section represent the minimum design parameters. It is recommended that the designer evaluate other energy conservation measures that may be applicable to all residential buildings.
The building form and external envelope must be designed and constructed to be able to satisfy the Natural Ventilation requirements, see table (8), in order to provide thermal comfort in occupied spaces and to reduce the energy consumption. These requirements are intended to reduce the energy consumption for conditioned spaces and to improve the thermal comfort of unconditioned spaces.
Country Roof Walls Floors Austria 3.3 1.42.0- 1.62.3 -Belgium 2.4-1.3 1.01.5- - Egypt 1.67 1.0 ---- France 4.0-2.5 1.52.0- 1.01.3 -Jordon 1.0 0.56 -- Kuwait 2.5 1.75 -- Greece 2.0 0.9 2.0-0.3 Italy 2.6 1.7 -- New Zealand 3.0-1.5 0.61.7- 0.91.7 -S pain 0.71.4- 0.60.7- 1.01.4 -Turkey 2.63 1.7 -- U K 2.9 1.0 -- USA(various) 7.0-3.5 2.03.5- 0.03.5 -West Germany 3.3-2.2 0.71.2- 0.81.8 -Saudi Arabia 1.754 1.3 -- Republic of Lebanon 2.27-1.75 1.85- 0.48 --- Name U SC SHGC TVIS Single Glazing_Clear 6.17 .95 .81 .88 Single Glazing_Blue 6.17 .71 .61 .57 Single Glazing_Grey 6.17 .69 .59 .43 Single Reflective (Class A) 1 Clear High Emissivity 5.41 .36 .31 .20
Single Reflective (A) Tint Medium Emissivity 5.11 .29 .25 .09 Double Glazing BronzeTint 2.74 .57 .49 .47 Double Glazing GreenTint 2.74 .57 .49 .66
Double Glazing Tint
Low Emissivity 1.78 .37 .28 .44
Double Glazing, Reflective (A) Clear Medium Emissivity (IG)2 2.35 .20 .17 .13 Double Glazing, Reflective (A)Tint, Medium Emissivity (IG) 2.35 .18 .15 .08
Table (6) OTTV, Degree Days Heating and Cooling for ten Climatic Regions for Arab Countries
Heating & Cooling Degree Days No. Climatic Region Example of Cities in the
Regions CDD25 HDD18.3
OTTV (W/m2)
1 Cold High Mountains Lebanon heights, Syria, Height of Iraqi 500< >1500 30
2 Moderate Cold Region Middle & west of Syria, North of Jordon, East of Lebanon,
South Sinai, Atlas Mountains 500< 1500 - 1000 40 3 Mediterranean Sea Cost Region West Lebanon, Syria, North Coast Africa 500< 1000-500 45 4 Al Badin Region North & West of Iraq 1000- 500 1500-1000 60 5 Desert Costal Regions West Desert, Read Sea Cost, North of Saudi Arabia 1000- 500 >500 55 6 Semi Desert Regions North Great Desert, Sinai, North West Saudi Arabia, South
Jordon, East Syria 1000- 500 1000 - 500 55 7 Desert Regions South of Egypt & Libya, Middle of Algeria, Middle if Iraq, North
of Saudi Arabia
1500- 1000 1000> 60 8 Tropical Desert Regions East & Middle of Saudi, Kuwait, south of Iraq & Egypt, North &
Middle of Sudan 2000-1500 1500 - 500 65 9 Desert Region very Hot North East Sudan, South East Saudi, South of Emirate 2000> >500 70
10 Tropical Region (Near Equator) South of Sudan, Pats of El Somali 1500 - 500 >500 55 Table (7): Degree Day Heating and Cooling for Selected Arab Cities for Different Categories.
City Lat, oN Log,
oE
Eleva
,m Tao,avg RH(%) Ws(m/s) DDC18.3 DDH25 Classification Category
Doha 25.2 51.6 12.0 28 56 2.9 92 1802 Dubai 25.3 55.3 5.0 28.1 51 3.0 27 1660 Dhahran 26.3 50.2 17.0 27.4 50 3.4 205 1840 Khartoum 15.6 32.5 382 28.6 21 4.1 2 1520 Kuwait 29.2 48.0 55.0 26.3 39 3.1 487 1912 Manama 26.3 50.7 2.0 26.9 60 3.6 151 1537 Jeddah 21.7 39.2 12.0 28.3 59 2.8 0 1370 DDC10> 6000 A Aswan 24.0 32..8 194.0 26.2 27 3.3 165 1385 Riyadh 24.7 46.7 612.0 26.2 29 2.7 340 1161 Laxer 25.7 32.7 88.0 24.7 40 1.8 270 1107 Baghdad 33.2 44.2 34 23.9 39 2.4 680 1495 4000<DDC10 <5000 B Cairo 30.1 31.4 74.0 21.9 58 2.9 397 409 Mousel 36.3 43.2 216 21.1 47 1.7 1153 1122 3000< DDC10 <4000 C Alexandria 31.2 30.0 7.0 19.9 67 3.2 561 153 Beirut 33.8 35.5 19.0 20.1 62 2.6 536 174 Agadir 30.3 9.6W 74.0 19.3 71 2.1 529 26 Sana'a 15.5 44.2 2190.0 18.4 39 1.5 503 4 Tunis 36.8 10.2 4.0 19.4 69 2.7 809 202 Tripoli 32.7 13.1 81.0 20.5 57 2.4 686 337 Latakia 35.5 35.8 7.0 18.4 67 2.3 904 100 Aleppo 36.2 37.2 393.0 17.6 58 3.6 1570 342 3000<DDC10< 4000 D Algeria 36.7 3.2 25.0 17.9 71 2.6 977 51 Damascus 33.5 36.5 609.0 16.7 53 4.6 1596 172 32.0 36.0 773.0 17.1 47 1.9 1504 127 DDC10< 3000 E
Table (8) Ventilation Requirements
LIGHTING
Table (9) shows the maximum allowable Lighting Power Density (LPD) for the overall dowelling unit and for each specific within the unit.
Heating, Ventilation and Air Condition
Table (10) shows the minimum pipe insulation thickness in mm. Piping shall be designed and installed in accordance to table
(1), dwelling unit and for each specific space within the dwelling unit. The minimum requirements for Energy efficiency (EER) for window or split units is 10 for cooling and 11 for cooling greater than 10 kW.
HOT WATER SYSTEM
Service water heaters, domestic boilers, storage tanks and pool heaters that are included in table 10 must comply with the relevant municipal codes.
Table (10) Minimum Pipe insulation thickness (mm)
Service Water Heating units for residential occupancy units of sizes greater than 100 liter storage and/or greater than 15 kW heating capacity must be located in a separate room remote from mishandling
Table (11) Water heating equipment Activity (adult male) Meta-bolic rate, M (W) Requirements For respiration: O2 concentration of 16.3% in Expired air (s-1) Requirement s To maintain CO2 at 0.5% assuming 0.04% CO2 In fresh air (1 s-1) Seated quietly 100 0.1 0.8 Light work 160 - 320 0.2 – 0.3 1.3 – 2.6 Moderat e work 320 - 480 0.3 – 0.5 2.6 – 3.9 Heavy work 480 - 650 0.5 – 0.7 3.9 – 5.3 Very heavy work 650 - 800 0.7 – 0.9 5.3 – 6.4 Illuminance (Lux) Space Lighting Power Density (W/m2) Minimum Maximum Bedroom 10 50 100 Living room 19 200 500 Reception room 19 200 500 Bath room 14 100 200 Kitchen 11 100 400 Lobby, Corridors, elevators and stairs 13 100 200 Total space (Flat) 15 - - Pipe Diameter (mm) 127 & > 63.5-102 50 25- 35 < 25 Range of Fluid Temperature (oC) Types of Pipes systems Heating Systems
Hot water & steam 88.9 76.2 38.1 63.5 63.5 152-232 Pressure/High Temperature 76.2 63.5 38.1 63.5 50.8 121-151 Pressure/ Medium Temperature 50.8 50.8 25.4 38.1 38.1 121-93 Pressure/Low Temperature 38.1 38.1 12,7 25.4 25.4 93-48 Low Temperature 50.8 50.8 38.1 25.4 25.4 Condensed Steam Cooling Systems 25.4 25.4 19.05 12.7 12.7 4.4-12.8 Child Water 38.1 38.1 38.1 25.4 25.4 < 4.4 Refrigerant or Brine Solution Component Rating Conditions Performance Requirement
Electric Inputs less than 12kW Capacity 50-450 Liters
Δ T < 45 oC
Efficiency not less than 90%
Gas Fired less than 22 kW
Δ T < 45 oC
Efficiency not less than 85%
Gas Fired larger than 22 kW
ΔT < 45 oC
Efficiency not less than 85%
Gas Fired less than 38 liters storage
Δ T = 50 oC
Efficiency not less than 80%
Table (9) shows the maximum allowable Lighting Power Density (LPD) for the overall
All piping forming part of a service water heating system and located outside the building envelope must be insulated to the level specified in the Insulation Code for heating system pipes. Where the pipe insulation has a thermal conductivity of more than, or less than, the range of the tables sited in the Insulation Code, thickness correction should be carried out in linear extrapolation of the table range.
ELECTRICAL POWER
The nominal cross-sectional area of wires and cables must be determined according to the Code of each Arab country of electrical installations in buildings, taking into consideration, the design current, ambient temperature, type of cable, type of insulation of cables, method of installation and grouping of cables.
WHOLE-BUILDING PERFORMANCE Annual energy costs analysis for the Standard Design and the Proposed Design must each be determined using the same approved energy analysis simulation tool. The climate data used in the energy analysis must cover a full calendar year (8,760 hours) and must reflect approved coincident hourly data for temperature, solar radiation, humidity and wind speed for the building location.
STUDY CASE
An apartment building was used as a base case (BC) for this study. The residential building is a five-story building facing the NW direction. The apartment unit, Middle-income, Mid-rise (the floor area is 105 m2).
The dimension of the building is 24m by 16m with a floor-to-floor height of 3.0 m. There are essentially two floors: a top floor, which would include roof loads, and a middle floor, which would not include roof loads. Climatic data needed to run the spread sheet was established to run the simulation for the different cases; such as WWR, SHGC, Roof insulation, etc.
The Overall Total Thermal Transfer Value (OTTV) for the building envelope indicates the amount of heat transferred into building through the building façades and roof per unit building envelope area. The OTTV equations for the walls and the roof were programmed into an Excel spreadsheet, developed by the author.
DISUCION AND RESULTS
Table (6) classified the Arab countries into 10 regions and every region have the CDD25, HDD18.3 and OTTV (W/m2). CDD range between 500 and 2000 while HDD ranges between 1500 and 500. The OTTV ranges between 30 and 70.
Table (7) classifies the Arab countries into five regions according to the DDC10, DDC18.3 and DDH25. For example, the first region contains Doha, Dubai and Kuwait where DDC10 > 6000 where the outdoor weather is very hot and humid. The second region includes Riyadh and Aswan where 4000 <DDC10 < 6000 and the weather is recognized as very hot and dry. The OTTV analysis was applied to each city. The effect of the WWR was analyzed from 0.1 to 0.9.
Figure (2) shows the variation between OTTVw and WWR. The variation is linear
when WWR increases the OTTVw increases.
WWR ≤ 30% satisfy the complied OTTV for Energy Efficiency. The regression analysis was applied to get a general linear equation between OTTV and WWR for Cairo and Kuwait.
OTTV=296.8*WWR+28.4 (KUW) (1) OTTV=323.9*WWR+21.3 (CAI) (2)
`
Figure (2) Relation between OTTV & WWR . OTTVw<>WWR 0.00 50.00 100.00 150.00 200.00 250.00 300.00 0 0.1 0.2 0.3 0.4 0.5 0.6 0.7 0.8 0.9 W W R(%) OT T V w (W /m 2)
Cairo Damascus Riyadh Baghdad Amman Beirut
Conclusion
It has been proven that increasing the glazing area of the façade, i.e. increasing the WWR, the OTTV increases, the building thermal efficiency decreases. The Total Overall Thermal Transfer value (OTTVw) for the exterior walls should not exceed 90 W/m2, ranges from 60 W/m2 to 90 W/m2. The OTTVr should not exceed 12W/m2 and could be taken as 10 W/m2
Acknowledgement
The author wishes to acknowledge the Chair person of the Arab Energy building Codes Prof. Dr. Omima A.S. Eldin.
References
1. Energy Efficiency Residential Building Draft Code (2010), Final Draft the Arab Countries by the Ministry of Housing, HBRC, Egypt.
2. Energy Efficiency Commercial Building Code of Vietnam (2002). Second Draft. 3. Robertson G.L. (1998). Residential Energy Code-A New Zealand Proposal, Proceeding Clean and Safe Energy Forever, VOL.2, pp. 926-930. 4. ASHRAE (1997). Hand Book of Fundamentals, ASHRAE, Atlanta, GA. 5. Energy Efficiency Residential Building
Code (2003), Ministry of Housing, HBRC, Egypt.
![Intracellular and nuclear binding of [3H]dihydrotestosterone in cultured genital skin fibroblasts of patients with severe hypospadias](data:image/gif;base64,R0lGODlhAQABAIAAAP///wAAACH5BAEAAAAALAAAAAABAAEAAAICRAEAOw==)