METHOD ARTICLE
Making health economic models Shiny: A tutorial
[version 2; peer review: 1 approved, 1 approved with
reservations]
Robert Smith
*, Paul Schneider
*School of Health and Related Research, University of Sheffield, Regents Court, Sheffield, S1 4DA, UK * Equal contributors
First published: 14 Apr 2020, 5:69
https://doi.org/10.12688/wellcomeopenres.15807.1 Latest published: 31 Jul 2020, 5:69
https://doi.org/10.12688/wellcomeopenres.15807.2
v2
Abstract
Health economic evaluation models have traditionally been built in Microsoft Excel, but more sophisticated tools are increasingly being used as model complexity and computational requirements increase. Of all the programming languages, R is most popular amongst health economists because it has a plethora of user created packages and is highly flexible. However, even with an integrated development environment such as R Studio, R lacks a simple point and click user interface and therefore requires some programming ability. This might make the switch from Microsoft Excel to R seem daunting, and it might make it difficult to directly communicate results with
decisions makers and other stakeholders.
The R package Shiny has the potential to resolve this limitation. It allows programmers to embed health economic models developed in R into interactive web browser based user interfaces. Users can specify their own assumptions about model parameters and run different scenario analyses, which, in the case of regular a Markov model, can be computed within seconds. This paper provides a tutorial on how to wrap a health economic model built in R into a Shiny application. We use a four-state Markov model developed by the Decision Analysis in R for Technologies in Health (DARTH) group as a case-study to demonstrate main principles and basic functionality. A more extensive tutorial, all code, and data are provided in a GitHub repository.
Keywords
Health Economics, R, RShiny, Decision Science
Open Peer Review
Reviewer Status Invited Reviewers 1 2 version 2 (revision) 31 Jul 2020 report version 1
14 Apr 2020 report report
Talitha L. Feenstra, University of Groningen, Groningen, The Netherlands
1.
Yiqiao Xin , University of Glasgow, Glasgow, UK
2.
Any reports and responses or comments on the article can be found at the end of the article.
Corresponding author: Robert Smith ([email protected])
Author roles:Smith R: Conceptualization, Investigation, Methodology, Project Administration, Validation, Visualization, Writing – Original Draft Preparation, Writing – Review & Editing; Schneider P: Conceptualization, Investigation, Methodology, Project Administration, Validation, Visualization, Writing – Original Draft Preparation, Writing – Review & Editing
Competing interests: No competing interests were disclosed.
Grant information: R.S. and P.S. are joint funded by the Wellcome Trust Doctoral Training Centre in Public Health Economics and Decision Science [108903] and the University of Sheffield.
The funders had no role in study design, data collection and analysis, decision to publish, or preparation of the manuscript.
Copyright: © 2020 Smith R and Schneider P. This is an open access article distributed under the terms of the Creative Commons Attribution License, which permits unrestricted use, distribution, and reproduction in any medium, provided the original work is properly cited.
How to cite this article: Smith R and Schneider P. Making health economic models Shiny: A tutorial [version 2; peer review: 1 approved, 1 approved with reservations] Wellcome Open Research 2020, 5:69 https://doi.org/10.12688/wellcomeopenres.15807.2 First published: 14 Apr 2020, 5:69 https://doi.org/10.12688/wellcomeopenres.15807.1
Amendments from Version 1
The changes made are all in response to the reviewers suggestions. For each comment by the reviewers we have responded with the exact change (see responses to reviewer comments below).
None of these changes change the fundamental teaching strategy of the tutorial, or the reasons why this tutorial paper was published, they are just relatively minor changes to the text used to clarify things which the reviewers found more difficult to follow, or felt we should have explained differently.
In two cases this resulted in changes to large chunks of text.
Running the model for a specific set of PSA inputs - We provide more detail on the way in which the f_MM_ sicksicker function works. This was in response to a request by reviewer 2 to do this.
Discussion – we add in more clarity about the limitations and strengths of the apps in response to the reviewers (in blue). This is in response to a request by reviewer 1 to do this.
Any further responses from the reviewers can be found at the end of the article REVISED
Introduction
As the complexity of health economic decision models increase, there is growing recognition of the advantages of using high level programming languages (e.g. R, Python, C++, Julia) to support statistical analysis. Depending on the model that is being used, Microsoft Excel can be relatively slow. Certain types of models (e.g. individual-level simulations) can take a very long time to run or become computationally infeasible, and some essential statistical methods can hardly be implemented at all (e.g. survival modelling, network meta-analysis, value of sample information), or rely on exporting results from other programs (e.g. R, STATA, WinBUGs).
Of all the high level programming languages, R is the most popular amongst health economists1. R is open source and supported by a large community of statisticians, data scientists and health economists. There are extensive collections of (mostly free) online resources, including packages, tutorials, courses, and guidelines. Chunks of code, model functions, and entire models are shared by numerous authors, which allow R users to quickly adopt and adapt methods and code created by others. Importantly for the UK, R is also currently the only programming environment accepted by NICE for HTA submissions, the alternative submission formats Excel, DATA, Treeage, and WinBUGs are all software applications2.
Despite the many strengths of the script based approach (e.g R) to decision modelling, an important limitation has been the lack of an easy-to-understand user-interface, which would be useful as it “facilitates the development and communication of the model structure” (p.743)1. While it is common practice for ’spreadsheet models’ to have a structured front tab, which allows decision makers to manipulate model assumptions and change parameters to assess their impact on the results, up until recently, R models had to be adapted within script files or command lines. Released in 2012, Shiny is an R-package that can be used to create a graphical, web browser based interface. The result looks like a website, and allows users to interact with underlying R models without the need to manipulate the source code3. Shiny has already been widely adopted in many different areas and by various organisations to present the results of statistical analysis4. Within health economics Shiny is currently being used to conduct network meta analysis5 and value of information analysis6,7.
Using Shiny, it is possible to create flexible user interfaces that allow users to specify different assumptions, change parameters, run underlying R code and visualise results. The primary benefit of this is that it makes script based computer models accessible to those with no programming knowledge - opening models up to critical inquiry from decision makers and other stakeholders8. Other benefits come from leveraging the power of R’s many publicly available packages; for example, allowing for publication quality graphs and tables to be downloaded, user specific data-files to be uploaded, open-access data to be automatically updated and, perhaps most importantly, to efficiently run comprehensive probabilistic sensitivity analyses in a fraction of the time that it would take in Microsoft Excel. Shiny web applications for R health economic decision models seem particularly useful in cases where model parameters are highly uncertain or unknown, and where analysis is conducted with heterogeneous assumptions (e.g. for different populations). Examples of well-designed shiny applications include, for example, the the Innovation and Value Initiative’s open-source rheumatoid arthritis individual patient simulation model, Bresmed’s ‘IntRface’ application, and the SHARP CKD-CVD outcomes model9–11.
While, from a transparency perspective, it is preferable that models constructed in R are made open-access to improve replicability and collaboration, it is not a requirement12. Sensitive and proprietary data and/or models can
be shared internally, or through password-protected web applications, negating the need to email zipped folders. Once an R model and a Shiny application have been created, they can also be easily adapted, making it sible to quickly update the model when new information becomes available. Several authors have pos-tulated that there is considerable potential in using Shiny to support and improve health economic deci-sion making. Incerti et al. (2019) identified web applications as being an essential part of modelling, stating that they “believe that the future of cost-effectiveness modeling lies in web apps, in which graphical interfaces are used to run script-based models” (p.577)13. Similarly, Baio and Heath (2017) predicted that R Shiny web apps will be the “future of applied statistical modelling, particularly for cost-effectiveness analysis” (p.e5)14. Despite these optimistic prognoses, adoption of R in health economics has been slow and the use of Shiny seems to have been limited to only a few cases. A reason for this might be the lack of accessible tutorials tailored towards an economic modeller audience.
Here, we provide a simple example of a Shiny web app, using a general four-state Markov model. The model is based on the ’Sick-Sicker model’, which has been described in detail in previous publications15,16 and in open source teaching materials by the DARTH workgroup17. The model was slightly adapted to implement probabilistic sensitivity analysis. This paper aims to provide a tutorial, designed specifically for those familiar with decision modelling in R, to create web-based user interfaces for R models using R Shiny.
Methods
While the focus of this tutorial is on the application of Shiny for health economic models, below we provide a brief overview of the “Sick-Sicker model”. For further details, readers are encouraged to consult previous publications by the DARTH group15,16,18 and the DARTH group website17.
The Sick-Sicker model is a four-state (Healthy, Sick, Sicker or Dead) time-independent Markov model. The cohort progresses through the model in cycles of equal duration, with the proportion of those in each health state in the next cycle being dependant on the proportion in each health state in the current cycle and a time constant transition probability matrix.
The analysis incorporates probabilistic sensitivity analysis (PSA) by creating a data-frame of PSA inputs (one row being one set of model inputs) based on cost, utility and state transition probability distributions using the function f_gen_psa and then running the model for each set of PSA inputs using the model function f_MM_sicksicker.We therefore begin by describing the two functions f_gen_psa and f_MM_sicksicker in more detail before moving on to demonstrate how to create a user-interface. In this tutorial, we follow Alarid-Escudero et al.’s (2019) coding framework and add to it the prefix ‘f_’ to denominate functions15.
Functions
The f_gen_psa function (see the file f_gen_psa.R in the open access repository: https://doi.org/10.5281/ zenodo.372705219) returns a data-frame of probabilistic sensitivity analysis inputs: transition probabilities between health states using a beta distribution, hazard rates using a log-normal distribution, costs using a gamma distribu-tion and utilities using a truncnormal distribudistribu-tion. It relies on two inputs, the number of simuladistribu-tions (PSA inputs), and the cost (which takes a fixed value). We set the defaults to 1000 and 50, respectively.
Running the model for a specific set of PSA inputs
The function f_MM_sicksicker (see the file f_MM_sicksicker in the open access repository: https://doi.org/10.5281/ zenodo.3727052) makes use of the with function, which applies an expression (in this case the rest of the code) to a data-set (in this case params, which will be a row of PSA inputs).
The function first calculates transition probabilities from each health state to each health state and uses these to fill a transition probability matrix (m_P). It then creates a matrix for the markov trace (m_TR) which has t+1 nrows and four columns (one for each health state). The ‘PROCESS’ part of the code then ‘loops’ through the markov model, using matrix multiplication (elicited using %*% in R), iteratively computing, for each period, the proportion of the population that is in each state.
In the ‘OUTPUT’ section of the code the markov trace (m_TR) is multiplied (again using matrix multiplication) with vectors of health state utilities (e.g. v_u_trt) and costs (e.g. v_c_trt), giving a vector of total costs and utilities in each time interval. These vectors are then discounted using a discount weight vector (e.g. v_dwe & v_dwe) to arrive at a single cost/QALY value. The resulting total discounted costs and QALY estimates for the treatment and the no-treatment group then are combined into a vector and returned from the function. In this simple example,
treatment only influences utilities and costs, not transition probabilities. For further details on the underlying model, we refer to the published source code19
Creating the model wrapper
When using a web application, it is likely that the user will want to be able to change parameter inputs and rerun the model. In order to make this simple, we recommend wrapping the entire model into a function. We call this function f_wrapper, using the prefix f_ to denote that this is a function.
The wrapper function has as its inputs all the parameters that we may wish to vary using R-Shiny. We set the default values to those of the base model in any report/publication. The model then generates PSA inputs using the f_gen_psa function, creates an empty table of results, and runs the model for each set of PSA inputs (a row from df_psa) in turn. The function then returns the results in the form of a data-frame with n=5 columns and n=psa rows. The columns contain the costs and QALYs for treatment and no treatment for each PSA run, as well as an ICER for that PSA run.
Model wrapper function
f_wrapper <— function(
#—— User adjustable inputs ——# # age at baseline
n_age_init = 25,
# maximum age of follow up
n_age_max = 110,
# discount rate for costs and QALYS
d_r = 0.035,
# number of simulations
n_sim = 1000,
# cost of intervention treatment in states sick and sicker
c_Trt = 50 ){
#—— Unadjustable inputs ——# # number of cycles
n_t <— n_age_max — n_age_init
# the 4 health states of the model:
v_n <— c("H" , "S1" , "S2" , "D")
# number of health states
n_states <— length(v_n)
#—— Create PSA Inputs ——#
df_psa <— f_gen_psa(n_sim = n_sim, c_Trt = c_Trt)
#—— Run PSA ——#
# Initialize matrix of results outcomes
m_out <— matrix(NaN,
nrow = n_sim, ncol = 5,
dimnames = list(1:n_sim, c("Cost_NoTrt", "Cost_Trt", "QALY_NoTrt", "QALY_Trt", "ICER")))
Figure 1. Diagram depicting how the Sick-Sicker app is structured.
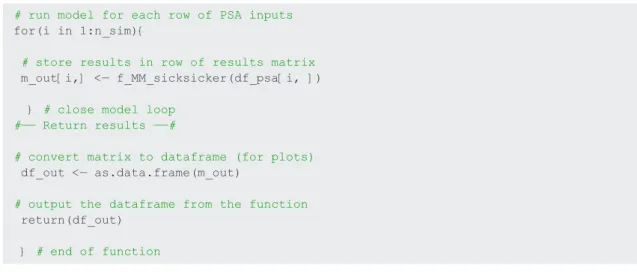
# run model for each row of PSA inputs
for(i in 1:n_sim){
# store results in row of results matrix
m_out[i,] <— f_MM_sicksicker(df_psa[i, ]) } # close model loop
#—— Return results ——#
# convert matrix to dataframe (for plots)
df_out <— as.data.frame(m_out)
# output the dataframe from the function
return(df_out)
} # end of function Integrating into R-Shiny
The next step is to integrate the model function into a Shiny web-app. This is done within a single R file, which we call app.R. This can be found within the GitHub repository here .
The app.R script has three main parts, each are addressed in turn below:
• set-up (getting everything ready so the user-interface and server can be created) • user interface (what people will see)
• server (R code running in the background)
Figure 1 depicts the relationship between the server and the user interface within the Shiny application. On a conceptual level, the user interface has three components: Shiny inputs (objects that the user can specify, e.g. by inputting a number), Shiny outputs (objects created on the server side, e.g. plots and tables), and non-interactive features (any fixed elements, such as texts, headings, logos etc.). The server works almost like a normal R session. It runs various R operations, including the model function, which takes non-Shiny inputs (defined only on the server side) and some Shiny inputs from the user interface. The results are then sent to the user interface and displayed as Shiny outputs.
Initial set-up
The set-up is relatively simple. First, load the R-Shiny package from your library so that you can use the shinyApp function. The next step is to use the source function in baseR to run the script that creates the f_wrapper function, being careful to ensure your relative path is correct (’./wrapper.R’ should work if the wrapper.R file is in the same folder as the app.R file).
Code initialization (within app.R) # install 'shiny' if haven't already.
# # install.packages("shiny") # necessary if you don’t already have the function
'shiny' installed.
# we need the function shiny installed, this loads it from the library. library(shiny)
# source the wrapper function.
source("./wrapper.R")
Creating the user interface function
The user interface is extremely flexible, we show the code for a very simple structure (fluidpage) with a sidebar containing inputs and a main panel containing outputs. We have done very little formatting in order to minimize the quantity of code while maintaining basic functionality. In order to get an aesthetically pleasing application, we recommend much more sophisticated formatting, relying on CSS, HTML and Javascript.
The example user interface displayed in Figure 2 and online on this website. The user interface is a fluidpage in a sidebarLayout (other types of layout are available). The sidebarLayout is made up of two components, a titlepanel and a sidebar layout display (which itself is split into a sidebar and a main panel). This is a basic structure used for teaching purposes, there are a plethora of templates available online.
The title panel contains the title “Sick Sicker Model in Shiny”, the sidebar panel contains two numeric inputs and a slider input (“Treatment Cost”, “PSA runs”, “Initial Age”) and an action button (“Run / update model”). The values of the inputs have ID tags (names), which are recognised and used by the server function, we denote these with the prefix “SI” to indicate they are ’Shiny Input’ objects (SI_c_Trt, SI_n_sim, SI_n_age_init). The action button also has an ID, this is not an input into the model wrapper f_wrapper so we leave out the SI and call it run_model.
The main panel contains two objects that have been output from the server: tableOutput(“SO_icer_table”) is a table of results, and plotOutput(“SO_CE_plane”) is a cost-effectiveness plane plot. It is important that the format (e.g. tableOutput) matches the format of the object from the server (e.g. SO_icer_table). Again, the SO prefix reflects the fact that these are Shiny Outputs. The two h3() functions are simply headings, which appear as “Results Table” and “Cost-effectiveness Plane”.
Shiny user interface code
ui <— fluidPage ( # creates empty page
# title of app
titlePanel("Sick Sicker Model in Shiny"), # layout is a sidebar—layout
sidebarLayout(
sidebarPanel( # open sidebar panel # input type numeric
numericInput(inputId = "SI_c_Trt", label = "Treatment Cost", value = 200,
min = 0, max = 400),
numericInput(inputId = "SI_n_sim", label = "PSA runs", value = 1000, min = 0, max = 400),
# input type slider
sliderInput(inputId = "SI_n_age_init", label = "Initial Age", value = 25,
min = 10, max = 80),
# action button runs model when pressed
actionButton(inputId = "run_model", label = "Run model") ), # close sidebarPanel # open main panel
mainPanel(
# heading (results table)
h3("Results Table"),
# tableOutput id = icer_table, from server
tableOutput(outputId = "SO_icer_table"),
# heading (Cost effectiveness plane)
h3("Cost—effectiveness Plane"),
# plotOutput id = SO_CE_plane, from server
plotOutput(outputId = "SO_CE_plane") ) # close mainpanel
) # close side barlayout
Creating the server function
The server is marginally more complicated than the user interface. It is created by a function with inputs and outputs. The observe event indicates that when the action button run_model is pressed the code within the curly brackets is run. The code will be re-run if the button is pressed again. Setting the parameter ignoreNULL to False lets the model run when it is initialised, i.e. when the app is started.
The first thing that happens when the run_model button is pressed is that the model wrapper function f_wrapper is run with the user interface inputs (SI_c_Trt, SI_n_age_init, SI_n_sim) as inputs to the function. The input prefix indicates that the objects have come from the user interface. The results of the model are stored as the data-frame object df_model_res.
The ICER table is then created and output (note the prefix output) in the object SO_icer_table. The func-tion renderTable generates a table from the model results to display it on the web interface See previous secfunc-tion on the user interface and note that the *tableOutput* function has as an input SO_icer_table. The function renderTable rerenders the table continuously so that the table always reflects the values from the data-frame of results created above. In this simple example we have created a table of results using code within the script. Normally we would use a custom function that creates a publication quality table that is aesthetically pleasing. There are different packages that provide this functionality15,20,21.
The cost-effectiveness plane is created in a similar process, using the renderPlot function to continuously update a plot, which is created using baseR plot function using incremental costs and QALYs calculated from the results dataframe df_model_res. For aesthetic purposes we recommend this is replaced by a ggplot2 or plotly plot, which have much improved functionality22,23. As with the results table, there are also numerous health economic modelling specific R packages that have plotting features15,20,21.
Shiny server function
server <— function(input, output){
# when action button pressed ... observeEvent(input$run_model, ignoreNULL = F, { # Run model function with Shiny inputs df_model_res = f_wrapper(
c_Trt = input$SI_c_Trt,
n_age_init = input$SI_n_age_init, n_sim = input$SI_n_sim)
#—— CREATE COST EFFECTIVENESS TABLE ——# # renderTable continuously updates table output$SO_icer_table <— renderTable({
df_res_table <— data.frame( # create dataframe Option = c("Treatment","No Treatment"),
QALYs = c(mean(df_model_res$QALY_Trt), mean(df_model_res$QALY_NoTrt)), Costs = c(mean(df_model_res$Cost_Trt), mean(df_model_res$Cost_NoTrt)), Inc.QALYs = c(mean(df_model_res$QALY_Trt) — mean(df_model_res$QALY_NoTrt), NA),
Inc.Costs = c(mean(df_model_res$Cost_Trt) — mean(df_model_res$Cost_NoTrt), NA),
ICER = c(mean(df_model_res$ICER), NA) ) # close data—frame
# round the data—frame to two digits
df_res_table[,2:6] = round(
df_res_table[,2:6],digits = 2)
# print the results table
df_res_table
}) # table plot end.
#—— CREATE COST EFFECTIVENESS PLANE ——# # render plot repeatedly updates.
output$SO_CE_plane <— renderPlot({
# calculate incremental costs and qalys
df_model_res$inc_C <— df_model_res$Cost_Trt — df_model_res$Cost_NoTrt df_model_res$inc_Q <— df_model_res$QALY_Trt — df_model_res$QALY_NoTrt
# create cost effectiveness plane plot
plot(
# x y are incremental QALYs Costs
x = df_model_res$inc_Q, y = df_model_res$inc_C,
# label axes
xlab = "Incremental QALYs", ylab = "Incremental Costs",
# set x—limits and y—limits for plot.
xlim = c( min(df_model_res$inc_Q, df_model_res$inc_Q*—1), max(df_model_res$inc_Q, df_model_res$inc_Q*—1)), ylim = c( min(df_model_res$inc_C, df_model_res$inc_C*—1), max(df_model_res$inc_C, df_model_res$inc_C*—1)),
# include y and y axis lines.
abline(h = 0,v = 0) ) # CE plot end
}) # renderplot end
}) # Observe event end
Running the app
The app can be run within the R file using the function shinyApp, which depends on the ui and server that have been created and described above. Running this creates a Shiny application in the local environment (e.g. your desktop). It is also possible to deploy the application onto the web from RStudio using the shinyapps.io server (using the publish button in the top right corner of the R-file in R-Studio). Alternatively, apps can be hosted on private servers and integrated into existing websites. Server specifications should be chosen to match model requirements: while simple Markov chain state transition models may run on almost any server, more computa-tionally burdensome models (e.g. agent-based models) may require considerable computing power. A step by step guide to the process of publishing applications can be found on the R-Shiny website or other online resources3,24.
Running the app shinyApp(ui , server)
Additional functionality
The example Sick-Sicker web-app that has been created is a simple, but functional, R-Shiny user interface for a health economic model. There are a number of additional functionalities, many of which are covered in an online book by Hadley Wickham24.
• fully customised user interface aesthetics. Since the user interface is translated into HTML and CSS it is possible to customise all components (such as colors, fonts, graphics, layouts and backgrounds)3,25.
• leverage many popular R packages to visualise model inputs (e.g. distributions) and outputs (e.g. plots and results tables)22,23,26.
• upload files containing input parameters and data to the app24. • download specific figures and tables from the app24.
• create a downloadable full report including model inputs and outputs24.
• send model results/report to an email address once the model has finished running27.
It is also possible to integrate all of the steps of health economic evaluation into one program. After select-ing a subgroup of studies to use as inputs for a network meta-analysis, and economic model assumptions, the user would be required to simply click a ’run’ button. They would then be presented with results of the network meta-analysis, economic model and value of information analysis in one simple user-interface. The app user would then also be able to download a report (or have it sent to an email address) with the model results and appropriate visualisations updated to reflect their assumptions.
Discussion
In this paper, we demonstrated how to generate a user-friendly interface for an economic model programmed in R, using the Shiny package. This tutorial shows that the process is relatively simple and requires limited additional programming knowledge than that required to build a decision model in R.
The movement towards script based health economic models with web based user interfaces is particularly useful in situations where a general model structure has been created with a variety of stakeholders in mind, each of which may have different assumptions (input parameters) and wish to conduct sensitivity analysis specific to their decision. For example, the World Health Organisation Department of Sexual and Reproductive Health and Research recently embedded a Shiny application into their website28. The application runs a heemod model20 in R in an external server, and allows users to select their country and specify country specific assumptions (input parameters), run the model and display results.
A well designed user interface can allow users to explore and better understand the relationship between model input and results. This allows users to tailor the health economic model to their specific situation and assumptions, without the expense of creating a new model. This may be particularly useful in the following scenarios: Firstly, in areas where one health economic decision model is applied in range of circumstances (e.g. in public health, models are often built to be used in a number of different countries). Secondly, when the full model source code can or may not be shared (e.g. for proprietary or privacy reasons). R-Shiny apps can be made available in a way that allows users to interact with the web interface, without revealing the model behind it. Finally, R shiny apps may enable stakeholders and decision makers, who would otherwise not be able to interact directly with statistical computer models, to experiment with and to reflect on various scenarios and the validity of model inputs and outputs.
However, in all of these scenarios, the ability for users to test different assumptions is not without limits: the available options to vary point estimates or the uncertainty around input parameters are defined by the model developer, and it is also not possible to specify alternative model structures or test any other aspect that the developer did not implement. Therefore, the model source code and data will still need to be made available to reviewers to allow for a thorough assessments of health economic models. Further investigation into how to communicate economic decisions models in a transparent and inclusive way is an important avenue of future research The authors’ experience of creating user-interfaces for decision models has led to the conclusion that the most efficient method is to work iteratively, starting with a very simple working application, and adding functionality step by step, testing the app at each iteration to ensure it works as intended. It is worth noting that the simple model chosen as an exemplar is a markov model, however the method described can be applied to any model built using R, regardless of model type. For example, in this case, the f_MM_sicksicker function could also be replaced by a function containing any other type of model (e.g. a DES model).
There are several challenges that exist with the movement toward script based models with web-based user-interfaces. The first is the challenge of up-skilling health economic modeller used to working in Microsoft Excel. We hope that this tutorial provides a useful addition to previous tutorials demonstrating how to construct decision models in R16. A second, and crucial challenge to overcome, is a concern about deploying highly sensi-tive data and methods to an external server. While server providers such as ShinyIO provide assurances of SSR encryption and user authentication clients with particularly sensitive data may still have concerns. This problem can be avoided in two ways: firstly, if clients have their own server and the ability to deploy applications they can maintain control of all data and code, and secondly, the application could simply not be deployed, and instead simply created during a meeting using code and data shared in a zip file. Finally, a challenge (and opportunity) exists to create user-interfaces that are most user-friendly for decision makers in this field; this is an area of important research that requires closer collaboration between decision makers, stakeholders and health economic decision model developers.
Conclusion
The creation of web application user interfaces for health economic models constructed in high level programming languages should improve their usability, allowing stakeholders and third parties with no program-ming knowledge to conduct their own sensitivity analysis remotely. This tutorial provides a reference for those attempting to create a user interface for a health economic decision model created in R. Further work is necessary to better understand how to design interfaces that best meet the needs of different decision makers.
Data availability
All data underlying the results are available as part of the article and no additional source data are required. Software availability
Source code available from: https://github.com/ RobertASmith/paper_makeHEshiny Archived source code at time of publication: https://doi.org/10.5281/zenodo.373089719. License: MIT license
Acknowledgements
We would like to thank Gianluca Baio, Nathan Green and all participants in the pilot tutorial held at the University of Sheffield for comments. All errors are the responsibility of the authors.
References
1. Jalal H, Pechlivanoglou P, Krijkamp E, et al.: An Overview of R in Health Decision Sciences.Med Decis Making. 2017; 37(7): 735–746.
PubMed Abstract |Publisher Full Text
2. National Institute for Health and Care Excellence (Great Britain):
Guide to the processes of technology Appraisal [Internet].
National Institute for Health and Care Excellence, 2014.
PubMed Abstract
3. Beeley C: Web application development with R using Shiny.Packt Publishing Ltd. 2016.
4. Gendron J: Introduction to R for Business Intelligence.Packt Publishing Ltd. 2016.
Reference Source
5. Owen RK, Bradbury N, Xin Y, et al.: Metainsight: An interactive web-based tool for analyzing, interrogating, and visualizing network meta-analyses using r-shiny and netmeta.Res Synth Methods. 2019; 10(4): 569–581.
PubMed Abstract |Publisher Full Text |Free Full Text
6. Strong M, Oakley JE, Brennan A: Estimating multiparameter partial expected value of perfect information from a probabilistic sensitivity analysis sample: a nonparametric regression approach.Med Decis Making. 2014; 34(3): 311–326.
PubMed Abstract |Publisher Full Text |Free Full Text
7. Baio G, Berardi A, Heath A: Bceaweb: A user-friendly web-app to use bcea. In: Bayesian Cost-Effectiveness Analysis with the R package BCEA, Springer, 2017; 153–166.
Publisher Full Text
8. Jansen JP, Incerti D, Linthicum MT: Developing Open-Source Models for the US Health System: Practical Experiences and Challenges to Date with the Open-Source Value Project.
Pharmacoeconomics. 2019; 37(11): 1313–1320.
PubMed Abstract |Publisher Full Text |Free Full Text
9. Hart R, Burns D, Ramaekers B, et al.: R and Shiny for Cost-Effectiveness Analyses: Why and When? A Hypothetical Case Study.PharmacoEconomics. 2020; 38(7): 765–776.
PubMed Abstract |Publisher Full Text
10. Incerti D, Curtis JR, Shafrin J, et al.: A flexible open-source decision model for value assessment of biologic treatment for rheumatoid arthritis.Pharmacoeconomics. 2019; 37(6): 829–843.
PubMed Abstract |Publisher Full Text
11. Schlackow I, Kent S, Herrington W, et al.: A policy model of cardiovascular disease in moderate-to-advanced chronic kidney disease.Heart. 2017; 103(23): 1880–1890.
PubMed Abstract |Publisher Full Text |Free Full Text
12. Hatswell AJ, Chandler F: Sharing is caring: the case for company-level collaboration in pharmacoeconomic modelling.
Pharmacoeconomics. 2017; 35(8): 755–757.
PubMed Abstract |Publisher Full Text
13. Incerti D, Thom H, Baio G, et al.: R You Still Using Excel? The Advantages of Modern Software Tools for Health Technology Assessment.Value Health. 2019; 22(5): 575–579.
PubMed Abstract |Publisher Full Text
14. Baio G, Heath A: When simple becomes complicated: why excel should lose its place at the top table. 2017.
Publisher Full Text
15. Alarid-Escudero F, Krijkamp EM, Pechlivanoglou P, et al.: A need for change! a coding framework for improving transparency in decision modeling.Pharmacoeconomics. 2019; 37(11): 1329–1339.
PubMed Abstract |Publisher Full Text |Free Full Text
16. Alarid-Escudero F, Krijkamp EM, Enns EA, et al.: Cohort state-transition models in R: From conceptualization to implementation.arXiv preprint arXiv: 2001. 2020; 07824.
Reference Source
17. DARTH Workgroup: Decision analysis in r for technologies in health. 2020.
Reference Source
18. Krijkamp EM, Alarid-Escudero F, Enns EA, et al.: Microsimulation Modeling for Health Decision Sciences Using R: A Tutorial.Med Decis Making. 2018; 38(3): 400–422.
PubMed Abstract |Publisher Full Text |Free Full Text
19. Robert S: RobertASmith/paper_makeHEshiny: Making health economics Shiny: a tutorial. 2020.
http://www.doi.org/10.5281/zenodo.3730897
20. Filipovic-Pierucci A, Zarca K, Durand-Zaleski I: Markov models for health economic evaluation modelling in r with the heemod package.Value Health. 2016; 19(7): A369.
Publisher Full Text
21. Baio G, Berardi A, Heath A: Bayesian Cost-Effectiveness Analysis with the R package BCEA. Springer, New York, NY, 2017; ISBN 978-3-319-55718-2.
Publisher Full Text
22. Sievert C: plotly for R. 2018.
Reference Source
23. Wickham H: ggplot2: Elegant Graphics for Data Analysis. Springer-Verlag New York, 2016; ISBN 978-3-319-24277-4.
Reference Source
24. Wickham H: Mastering shiny. 2020.
Reference Source
25. Shiny: Build your entire ui with html. 2020.
Reference Source
26. Dowle M, Srinivasan A: data.table: Extension of ‘data.frame‘. 2019. R package version 1.12.8.
Reference Source
27. Hester J: gmailr: Access the ’Gmail’ ’RESTful’ API. 2019. R package version 1.0.0.
Reference Source
28. World Health Organization: FGM Cost Calculator. 2020; [Accessed 22 July 2020].
Open Peer Review
Current Peer Review Status:
Version 2
Reviewer Report 03 August 2020
https://doi.org/10.21956/wellcomeopenres.17775.r39794
© 2020 Xin Y. This is an open access peer review report distributed under the terms of the Creative Commons
Attribution License, which permits unrestricted use, distribution, and reproduction in any medium, provided the original work is properly cited.
Yiqiao Xin
Health Economics and Health Technology Assessment, Institute of Health and Wellbeing,
University of Glasgow, Glasgow, UK
The authors have sufficiently addressed my comments. Thank you for producing this tutorial and
I believe it will be very useful to its audience. I have no further comments to make.
Competing Interests:
No competing interests were disclosed.
Reviewer Expertise:
Trial and model based economic evaluations, network meta-analysis, outcome
research, development of Shiny apps.
I confirm that I have read this submission and believe that I have an appropriate level of
expertise to confirm that it is of an acceptable scientific standard.
Version 1
Reviewer Report 10 July 2020
https://doi.org/10.21956/wellcomeopenres.17335.r39194
© 2020 Xin Y. This is an open access peer review report distributed under the terms of the Creative Commons
Attribution License, which permits unrestricted use, distribution, and reproduction in any medium, provided the original work is properly cited.
Yiqiao Xin
Health Economics and Health Technology Assessment, Institute of Health and Wellbeing,
University of Glasgow, Glasgow, UK
This paper provides a tutorial for those that have developed state transition models in R to be able
to develop a Shiny interface allowing stakeholders to scrutinize the assumptions. Overall this is a
well written paper for its specific audience, especially in the context of an increasing trend of
developing models in R. it also pointed to some useful references for people who are interested in
developing state transition models in R at first place, as well as those who have some experience
in R but want to build an interface. I particularly like figure 1 which is a very nice diagram depicting
the relationship between the ui.R and server.R.
Please find my comments as below.
In the Introduction, it will be useful to clarify what audience this paper is intended to.
Clearly this is not a tutorial for those people who never used R to develop models.
1.
In the Methods, the PSA section complicates the purpose of this tutorial which is teaching
people how to build a Shiny app for their models. Putting all the functions here in the main
text makes the tutorial look daunting than it should be. If the authors have to keep it,
probably consider moving it to appendix, or later on in the text, if the interface has an input
into the PSA. Afterall, my understanding is that this paper is not teaching people how to
build a state transition model and PSA in R.
2.
The authors mentioned a few times the use of ggplots/plotly or other programming
languages to make the interface aesthetically pleasing. For the benefit of users, can the
authors provide an example of an economic model app that embedded the codes that
provide aesthetically pleasing interface? if they don’t have one, it will be helpful if they could
reference a few existing Shiny apps for EE models that incorporated these features and
have codes openly available.
3.
The discussion section could be improved by further discussing the following points:
4.
a. Can this tutorial be scaled well to other types of economic models, e.g. Discrete event
simulation? It will be helpful to point the differences in building the ui and server when applied to
other type of models, and discuss the issues and caveats.
b. The authors could further discuss the usefulness of a Shiny interface for decision makers.
Although Shiny can achieve some level of visualisation of the results making it easier for decision
makers to examine the impact on the results when conducting sensitivity analysis, decision
makers can’t use it to further check the essential calculations and relationships between the
parameters. In other words, If decision makers have the knowledge of R coding, they may not
need to the Shiny interface to help visualise, whereas if they lack the knowledge of R coding, it is
still a barrier for them to check the fundamental structure of model which are coded in the
server.R file.
c. Does the Shiny app encounter capacity issues when running a large complex economic
model, especially when running PSA, or value of sample information? In our experience, a Shiny
app running complex simulations is memory demanding and developers will need to purchase the
plans provided by R Studio to be able to run on the server after publishing. It will be useful for the
authors to provide some suggestions or solutions if they have similar experiences.
Minor points:
There are some page numbers in bracket in the manuscript – is this required by the journal?
1.
some of them are not books but journal articles, and in some places where a journal article
was cited, these page numbers are not shown.
Page 7, after figure 2, first paragraph, “The title panel contains the title “Sick Sicker Model…..
and an Action Button (“Run/update model”).” Please be consistent in terms of upper/lower
case when referring to the input widget, i.e. “action button”.
2.
Same paragraph as above, line 4, it said ‘Note that this is an addition of the coding
framework provided by Alarid-Escudro et al., (2019)’. Not sure why this sentence is put here,
perhaps consider moving it to somewhere else as it seems can be applied to the whole
Shiny app development. Also, there is an extra ‘,’ at the end of the sentence.
3.
Page 8, ‘ Creating the server function’ section, third paragraph, line 2/3: “The function
renderTable
rerenders the table continuously so that the table always reflects the values …”
Calling it ‘rerender’ is a little confusing when describing the function 'renderTable'. It just
means it updates the output table each time after the input is updated by the end user.
4.
Page 9, in the Server.R codes, ‘# when action button pressed ...
observeEvent(input$run_model, ignoreNULL = F, {…”, what does the part ‘ignoreNULL = F’
do?
5.
In the discussion, it will be useful to provide a reference for the WHO Shiny app.
6.
Is the rationale for developing the new method (or application) clearly explained?
Yes
Is the description of the method technically sound?
Yes
Are sufficient details provided to allow replication of the method development and its use
by others?
Yes
If any results are presented, are all the source data underlying the results available to
ensure full reproducibility?
Yes
Are the conclusions about the method and its performance adequately supported by the
findings presented in the article?
Yes
Competing Interests:
No competing interests were disclosed.
Reviewer Expertise:
Trial and model based economic evaluations, network meta-analysis, outcome
research, development of Shiny apps.
I confirm that I have read this submission and believe that I have an appropriate level of
expertise to confirm that it is of an acceptable scientific standard.
Author Response 22 Jul 2020
Robert Smith
, University of Sheffield, Regents Court, Sheffield, UK
Thank-you for reviewing this paper and for your constructive comments, we have taken both
reviewers’ comments into account and tried to make changes where possible to improve the
paper. I provide responses to the comments one-by-one below:
R1: This paper provides a tutorial for those that have developed state transition
models in R to be able to develop a Shiny interface allowing stakeholders to scrutinize
the assumptions. Overall this is a well written paper for its specific audience,
especially in the context of an increasing trend of developing models in R. it also
pointed to some useful references for people who are interested in developing state
transition models in R at first place, as well as those who have some experience in R
but want to build an interface. I particularly like figure 1 which is a very nice diagram
depicting the relationship between the ui.R and server.R.
Thank-you, we hope it is useful for others trying to improve model transparency and aim to build
further teaching resources around it.
R1: In the Introduction, it will be useful to clarify what audience this paper is intended
to. Clearly this is not a tutorial for those people who never used R to develop models.
We have changed the text to specifically mention this, we have added the following sentence to
the last paragraph of the introduction section: “This paper aims to provide a tutorial for those
familiar with decision modelling in R to create web based user interfaces for R models using R
Shiny.”
R1: In the Methods, the PSA section complicates the purpose of this tutorial which is
teaching people how to build a Shiny app for their models. Putting all the functions
here in the main text makes the tutorial look daunting than it should be. If the
authors have to keep it, probably consider moving it to appendix, or later on in the
text, if the interface has an input into the PSA. Afterall, my understanding is that this
paper is not teaching people how to build a state transition model and PSA in R.
There is a conflict here between what different people may want from the paper (the other
reviewer wanted more detail on this function). The aim was to step the reader through this
example in detail, and since this deviates from the Sick-Sicker resources provided by DARTH we
think it should remain in the paper. We would have ideally put this in the appendix but Wellcome
Open Research does not allow appendices.
The authors mentioned a few times the use of ggplots/plotly or other programming
languages to make the interface aesthetically pleasing. For the benefit of users, can
the authors provide an example of an economic model app that embedded the codes
that provide aesthetically pleasing interface? if they don’t have one, it will be helpful if
they could reference a few existing Shiny apps for EE models that incorporated these
features and have codes openly available.
To address this ee have added examples in the text of some existing shiny applications that we
feel are well designed. In particular a lot of thought has been put into BresMed’s InterRface
(described in Rose Hart’s recent paper referenced in this amendment). However the code for the
InteRface tool has not been made open-source.
Can this tutorial be scaled well to other types of economic models, e.g. Discrete event
simulation? It will be helpful to point the differences in building the ui and server
when applied to other type of models, and discuss the issues and caveats.
We have added the following text to the discussion section, but in short, yes… and we hope to do
so in the future but for this paper we aimed for simplicity.
“It is worth noting that the simple model chosen as an exemplar is a markov model, however the
method described can be applied to any model built using R, regardless of model type. For
example in this case, the f_MM_sicksicker function could be replaced by a function containing any
type of model (e.g. a DES model).”
The authors could further discuss the usefulness of a Shiny interface for decision
makers. Although Shiny can achieve some level of visualisation of the results making
it easier for decision makers to examine the impact on the results when conducting
sensitivity analysis, decision makers can’t use it to further check the essential
calculations and relationships between the parameters. In other words, If decision
makers have the knowledge of R coding, they may not need to the Shiny interface to
help visualise, whereas if they lack the knowledge of R coding, it is still a barrier for
them to check the fundamental structure of model which are coded in the server.R
file.
We added the following paragraphs in the discussion section to clarify this important issue and
better explain the benefits (and limitations) of using R shiny applications to communicate health
economic decision models:
A well designed user interface can allow users to explore and better understand the relationship
between model input and results. This allows users to tailor the health economic model to their
specific situation and assumptions, without the expense of creating a new model. This may be
particularly useful in the following scenarios: Firstly, in areas where one health economic decision
model is applied in range of circumstances (e.g. in public health, models are often built to be
used in a number of different countries). Secondly, when the full model source code can or may
not be shared (e.g. for proprietary or privacy reasons). R shiny apps can be made available in a
way that allows users to interact with the web interface, without revealing the model behind it.
Finally, R shiny apps may enable stakeholders and decision makers, who would otherwise not be
able to interact directly with statistical computer models, to experiment with and to reflect on
various scenarios and the validity of model inputs and outputs.
However, in all of these scenarios, the ability for users to test different assumptions is not without
limits: the available options to vary point estimates or the uncertainty around input parameters
are defined by the model developer, and it is also not possible to specify alternative model
structures or test any other aspect that the developer did not implement. Therefore the model
source code and data will still need to be made available to reviewers to allow for a thorough
assessments of health economic models. Further investigation into how to communicate
economic decisions models in a transparent and inclusive way is an important avenue of future
research.
Does the Shiny app encounter capacity issues when running a large complex economic
model, especially when running PSA, or value of sample information? In our
experience, a Shiny app running complex simulations is memory demanding and
developers will need to purchase the plans provided by R Studio to be able to run on
the server after publishing. It will be useful for the authors to provide some
suggestions or solutions if they have similar experiences.
Again, a really useful point. We have never had an issue running a model remotely with ShinyIO…
It generally seems as fast or faster than a moderately expensive laptop. We know others use it for
PSA/VOI so suspect that the servers would be able to handle most models. That being said we
have never tried to do anything super-computationally burdensome - for this other providers
used to dealing with big data/big computation (e.g. Amazon Web Services) may be more suitable.
We have added the below text:
“Server specifications should be chosen to match model requirements: while simple Markov chain
state transition models may run on almost any server, more computationally burdensome
models e.g. agent-based models may require considerable computing power”
There are some page numbers in bracket in the manuscript – is this required by the
journal? some of them are not books but journal articles, and in some places where a
journal article was cited, these page numbers are not shown.
These are correct – they only apply to the print version of the documents, they are on the
published paper PDF versions.
Page 7, after figure 2, first paragraph, “The title panel contains the title “Sick Sicker
Model….. and an Action Button (“Run/update model”).” Please be consistent in terms
of upper/lower case when referring to the input widget, i.e. “action button”.
Thank-you for this, our mistake, now corrected in the text to all be lower case.
Same paragraph as above, line 4, it said ‘Note that this is an addition of the coding
framework provided by Alarid-Escudro et al., (2019)’. Not sure why this sentence is put
here, perhaps consider moving it to somewhere else as it seems can be applied to the
whole Shiny app development. Also, there is an extra ‘,’ at the end of the sentence.
We have moved this to the top of the methods section. Thank-you this is much clearer.
Page 8, ‘ Creating the server function’ section, third paragraph, line 2/3: “The function
renderTable rerenders the table continuously so that the table always reflects the
values …” Calling it ‘rerender’ is a little confusing when describing the function
'renderTable'. It just means it updates the output table each time after the input is
updated by the end user.
We have simplified this paragraph to read: “The function renderTable generates a table from the
model results to display it on the web interface.”
Page 9, in the Server.R codes, ‘# when action button pressed ...
observeEvent(input$run_model, ignoreNULL = F, {…”, what does the part ‘ignoreNULL
= F’ do?
Apologies we should have explained, we have added “Setting the parameter ignoreNULL to False
lets the model run when it is initialised, i.e. when the app is started.” to that paragraph.
In the discussion, it will be useful to provide a reference for the WHO Shiny app.
Thanks we have added a reference to this.
Competing Interests:
No competing interests.
Reviewer Report 01 July 2020
https://doi.org/10.21956/wellcomeopenres.17335.r38662
© 2020 Feenstra T. This is an open access peer review report distributed under the terms of the Creative
Commons Attribution License, which permits unrestricted use, distribution, and reproduction in any medium, provided the original work is properly cited.
Talitha L. Feenstra
Groningen Research Institute of Pharmacy, University of Groningen, Groningen, The Netherlands
This tutorial clearly explains the use of R shiny to present results from HE decision models to a
general audience, allowing them to change several input parameters and see the effects on the
model outcomes.
The text and R code that comes along with it on GitHub is mostly clear. I tried the code and it
worked without any issues after downloading. With just the paper in hand that would have been
somewhat more difficult, since parts of code are presented and it is not fully clear how they link
together.
The sourcing part is not complete e.g.
Overall this tutorial is a nice illustration and helpful if you want to start working with HE models
using Shiny. However the example is strongly simplified, up to the unrealistic (an intervention
which does not affect transition rates).
Since it is a tutorial, this paper has no results section.
In the introduction maybe it is relevant to refer to actual existing applied HE decision models in R
with Shiny interface
(e.g.http://dismod.ndph.ox.ac.uk/kidneymodel/app/, https://github.com/InnovationValueInitiative,
both with publications available:
Pharmacoeconomics 2019 ;37(6):829-843. doi: 10.1007/s40273-018-00765-2. A Flexible
Open-Source Decision Model for Value Assessment of Biologic Treatment for Rheumatoid Arthritis, D
Incerti, JR Curtis et al
1.
Heart. 2017;103(23):1880-1890.
doi: 10.1136/heartjnl-2016-310970. A Policy Model of Cardiovascular Disease in
Moderate-To-Advanced Chronic Kidney Disease. I Schlackow, S Kent et al
2. , I guess more will exist)
The argumentation/opinion that the future of health economics is in automated click and run
models is not at its place in the methods section. This should go to the discussion and be more
thoroughly supported by arguments. I wonder how conceptual model selection and input data
analysis to fill a HE decision model could be really performed using a pre-specified framework.
Surely this framework should be very flexible. It also seems to prohibit involvement of
stakeholders in decisions concerning model structure and input data analysis/interpretation.
How will the problem of structural uncertainty be addressed by models made available to
HE decision makers and other users to perform their own uncertainty analysis? The text in
the paper can improve from further clarification at some points.
○
The PSA function is not explained in the paper and this is the new part compared to the
SickSicker publication. So I would rather have expected some explanation on this (and
maybe less on the SickSicker, which is already published/explained)
○
What distributions were chosen for what model parameters? How could modelers apply this
code as a basis for adding a PSA into their own application and have it serve as input for a
Shiny? Ideally: the user would have the option to choose some of the PSA settings other
than just the number of runs, e.g. the type of distribution and/or the parameters in this
distribution.
○
The initial set-up part is unclear, and the code is not the same as the R code available online.
○
The discussion refers to "inform teaching content", what teaching is meant here? And whom
are taught?
○
Minor unclarities:
Using cost to refer to intervention cost is confusing. It also presumes the control has zero costs. It
is not clear whether the intervention cost is one-off or annually. But that might be explained in the
SickSicker paper.
Using numerous for the number of available packages and then referring to three seems a bit
overdone.
Health economics is more than HE decision modeling, I would refer to HE decision modeling, or
cost-effectiveness analysis rather than health economics which is a very broad field.
For some jurisdictions it would be functional to allow for two different discount rates (on
○costs and on health outcomes).
The app uses limits for the axes in the graph that move with numbers provided. This is of
course needed when users are unrestricted in the values they provide regarding
intervention costs, however as a result, seeing the results of having different intervention
costs, requires proper attention for the values at the y-axis, which change with every new
value provided by the user. It would be more informative to see the c/e cloud move rather
than the axis scale. Maybe that could be solved by having a range for the intervention costs
pre-specified (or alternatively let the axis limits depend on the treatment costs more like a
step function).
○