Effectiveness of Federal and State Government Polices
On Renewable Energy Generation
Undergraduate Research Opportunities Program
Qier Xue
University of Minnesota, Twin Cities
College of Food, Agricultural, and Natural Resource Sciences April 2015
Abstract
Renewable energy plays an important role in addressing some environmental problems such as climate change and environmental degradation, due to the fact that the environmental impact of using renewable energy are relatively small when compared to that of fossil fuels (EPA, 2014). As a result, political leaders have proposed different types of policies to encourage the use of renewable energy. This paper analyses the relationship between the renewable policies and the historical trends in renewable energy production in the Northern Lake States region, by studying and contrasting the differences between the states in the study region: Michigan, Minnesota and Wisconsin. Specifically, this paper focuses on the effectiveness of renewable energy policies on biomass-based electricity generation. Data analysis methods used in this research included time series analysis, qualitative research tools.
1. Background
Environmental issues such as climate change, pollution, ozone depletion, forest destruction, and dependence on imported oil have become general knowledge and concern. What these issues have in common is that energy generation and use are two major contributors (Dincer, 1999). In part to address these concerns, society leaders have proposed policy solutions. Frequently, these solutions include the increase in the use of one or more forms of renewable energy (McKendry, 2011). Renewable energy comes from fuel sources such as the sun, wind, some waste materials, and biomass. These fuel sources, when properly used, are replenished in relatively short periods of time without decreasing in amount and quality. The environmental impacts from renewable energy are also relatively small when compared to fossil fuels, such as oil and coal (EPA, 2014).
Among all the sources of renewable energy, biomass is the most common form, estimated to contribute 10 to 14% of the world’s energy supply (McKendry, 2011). Biomass is a biological material that is currently living or recently dead. It can be utilized as an alternative to fossil fuels
(DNR, 2014). When biomass is sustainably produced, the impact on the environment is just a fraction of that caused by traditional fuels, as they store carbon when growing and release it when combusting (Fargione, Hill, Tilman, Polasky, and Hawthorne, 2008). Biomass-based energy’s other advantages include their locally sourced nature, low levels of pollutants (especially sulfur dioxide), and potential to create jobs in rural communities (Union of Concerned Scientists, 2010). The various advantages of biomass as energy source and its potential contribution to fulfill energy and environmental needs in the United States have encouraged an increase in the number of federal- and state-issued policies to promote the expansion of biomass use in renewable energy production (Becker, Moseley, & Lee, 2010). Renewable energy policies include tax incentives, cost-share and grants programs, rules and regulations, financing, and procurement and technical assistance. These policies are numerous and vary in form but many have the common goal of increasing the use of biomass-based energy. One database lists almost 400 state and federal rules, regulations and policies for renewable energy (DSIRE, 2014).
The task of establishing the effectiveness of the renewable energy policies is not trivial, but is one that needs attention. The research proposed here contributes in addressing this need, by
studying and analyzing the different renewable policies and the trends in renewable energy production and consumption in the Northern Lake States region. Specifically, the study will focus on biomass-based electricity generation. The Northern Lake States region (comprising Minnesota, Wisconsin, and Michigan) was selected because this area has one of the highest forest and agriculture biomass densities in the U.S (S. L. Brown, Schroeder, & Kern, 1999). The large amount of forest and biomass resources offers great potential for bioenergy production in the region (Becker, Skog, Hellman, Halvorsen, & Mace, 2009). Table 1 summaries the three states’ current availability of biomass and wood resources in terms of the combined heat and power (CHP) installation capacity and the number of biomass and wood power plants. CHP is widely known as cogeneration, which utilizes a single fuel source to generate electricity and heat at the same time (EPA, 2015). The total capacity of Combined Heat and Power (CHP) Units was calculated based on the data provided by U.S. Department of Energy (DOE) (DOE, 2013). Their Combined Heat and Power Installation Database lists capacity (kW) of each type of fuel and of each organization in the state. Sum of biomass capacity of each state is calculated and shown in the table below. The number of biomass and wood power plants was found on the website of U.S. Energy Information Administration, EIA, which provides profile for each state including maps of state power plants (EIA, 2014).
Table 1 States Biomass and Wood Resources Availability State
Total Capacity (kW) of Biomass and Wood Fuel CHP
Units (DOE, 2013)
Number of Biomass and Wood Power Plants (EIA,
2014)
Michigan, MI 119,840 31
Minnesota, MN 121,117 15
Wisconsin, WI 58,149 22
2. Methodology
Historical data for biomass-based electricity generation and policy context was examined in the Northern Lake States region that includes Minnesota, Wisconsin, and Michigan. Federal and state databases were consulted for information about trends in biomass-based energy generation, including quantitative (amount of energy produced, in kWh or Btu for the timeframe of interest) and qualitative (e.g., types of biomass, technologies) information. Data of biomass-based electricity generation was found on Form-923 and predecessor forms of Power Plant Operation Report, published by EIA (EIA, 2014). Policy information was gathered from two online databases. One is Database of State Incentives for Renewable & Efficiency (DSIRE) (North Carolina State University), and the other one is CHP Policies and Incentives Database, (dCHPP) (EPA, 2014). The time period chosen for biomass-base electricity generation study was 1990 to 2012, partly due to the availability and limitation of the data provided by EIA. The time period for policy study was from 1978 to 2012. In addition, only biomass related policies are included, although the selected policies may have other eligible renewable technologies besides biomass. In addition, extensive review of the literature related to the topic has been done prior to the study
in order to gain an understanding of current knowledge on renewable energy, biomass technology, and to compile a list of renewable energy policy.
3. States Profile 3.1 Michigan
Known as the “Great Lakes State,” Michigan has almost one-half of its area in water. The state also has various energy resources, including natural gas and crude oil, as well as renewable resources. The abundant woody biomass provides the state with biomass sources, while hydroelectric power generation is limited due to the generally level terrain. Winds provide the state with another potential renewable resource. Michigan has cold winters and a large population (it is the 9th most populated state as of 2013) (Census, 2014); therefore, the state is a big consumer of energy. The residential sector is the leading energy consumer, followed closely by transportation and the industrial sector. Energy-intensive industrial activities in the state include automotive manufacturing as well as the forest industry, machinery manufacturing, fabricated metal products, and petroleum refining industries. According to the U.S. Energy Information Administration (EIA), in 2012, Michigan ranked 11th in the nation in energy consumption, with 2704.5 trillion Btu of energy; and ranked 35th on per capita energy consumption, with 274 million Btu.
Michigan relies heavily on traditional energy sources; about 82% of the total energy consumed in 2012 came from fossil fuel sources while only 6% came from renewable energy sources in general. As a result, Michigan’s greenhouse gas emissions are significant, ranking 10th in the nation in carbon dioxide emissions, with 157 million metric tons generation in 2011 (EIA, 2011). Looking at electricity generation alone, Michigan used coal for 54% of its net electricity generation in July 2013 (EIA, 2014), while renewables contributed less than 5% of the electricity generation delivered to the grid.
Michigan‘s renewable electricity generation comes predominantly from biomass, followed by hydroelectric power and wind energy (EIA, 2014). Biomass, much of it from Michigan’s almost 19 million acres of forest land, provided fuel for 42% of Michigan's renewable net electricity generation in 2013 (EIA, 2014). According to the Michigan Biomass, which is a coalition that advocates for the state’s grid-connected and wood-fired power plants, biomass is an alternative to electricity produced by fossil fuels and nuclear power, and it provides attributes not found in other types of renewable power, such as solar and wind. Therefore, biomass is the only energy source amongst the leading renewables in Michigan that can be produced and stored on a meaningful scale (Michigan Biomass, 2013).
3.2 Minnesota
Minnesota is part of the Great Lakes Region. The state is a large state with 86,939 square miles (DNR, 2014), ranked 12th in total area in the nation (EIA, 2014). Minnesota's climate is subject to polar air masses with occasional artic chills in the coldest season. According to EIA, the northern part of the state has reported freezing temperatures in every month each year and the southern portion of the state can experience prolonged heat spells in the summer.
Minnesota has no fossil fuel reserves because it does not have crude oil, natural gas, or coal production. However, it has great renewable resources potential. Wind energy facilities and hydroelectricity power plants are commonly found in the state. Minnesota owns fertile topsoil that gives the state very rich farmland. Its 17 million acres of forestlands provide ample biomass potential (DNR, 2013). Minnesota also has abundant cornfields, and the valuable crop provides feedstock for several ethanol plants in the state.
Minnesota’s energy consumption is within the middle third of the states. According to the U.S. Energy Information Administration (EIA), Minnesota ranked 18th in the nation in total energy consumption, with 1824.3 trillion Btu. Its per capita energy consumption ranked 18th as well with 339 million Btu. Industrial sector is the leading energy consumer in Minnesota, followed by transportation sector. In 2012, the energy consumed by the two sectors accounted for 35.2% and 26.2% of the state’s total energy consumption (EIA, 2014). Coal-fired power plants provide the largest share of Minnesota's net electricity generation. In the period of July 2014, 51.6% of the net electricity generation was from coal-fired power plants (EIA, 2014). Although coal is used predominantly for electricity production, renewable energy also plays an important role in this field. Nuclear power is a significant contributor to Minnesota’s electricity generation, and it provided 26.2% of the electricity production in July 2014 (EIA, 2014). The rest of the renewable energy for electricity generation comes from wind power, natural gas, biomass and conventional hydroelectric power. As a result of this combined used of fossil fuel resources and renewables, Minnesota’s carbon dioxide emissions is within the middle third of the states, ranked as 23rd in 2011, with 91 million metric tons.
In addition to nuclear and wind, Minnesota is a top producer of ethanol, with over 20 corn-based ethanol production plants. The state ranked fourth in the nation in ethanol production capacity in 2013 (DEED, 2014). Minnesota also has a biodiesel mandate, which requires that diesel fuel sold in the state contain at least 10% biodiesel during the months of April through September and at least 5% biodiesel during the remainder of the year (StarTribune, 2014).
3.3 Wisconsin
Wisconsin is located in the north-central United States. The state is bordered on three sides by navigable waterways: Lakes Superior and Michigan to the north and east, and the Mississippi and Saint Croix Rivers to the west. The waterways allow Wisconsin to ship and receive great amounts of resources, such as coal and oil. Wisconsin lacks conventional fossil fuel resources of its own but has significant renewable energy resources. It has strong agricultural economy, biomass, hydroelectric power plants and ethanol production. Wisconsin is also a leader in the nation in the market value of its agricultural products and it is the second largest dairy state, after California. Manure is converted to energy in anaerobic digesters. The northern highlands, occupied one third of the state, are heavily wooded and provide the state with ample biomass. Wisconsin’s energy consumption is within the middle third of the states. According to EIA, as of 2012, Wisconsin’s total energy consumption was 1,734 trillion Btu, ranked 21st in the nation, and ranked 24th on per capital energy consumption, with 303 million Btu (EIA, 2014). Similarly,
Wisconsin’s carbon dioxide emission ranked 20th as well, with 96 million metric tons emission in 2011.
Although Wisconsin lacks conventional fossil fuel resources of its own, fossil fuel resources still support most of the state’s energy production. Most of Wisconsin’s energy consumption is from coal and natural gas. In 2012, coal consumption was 373.3 trillion Btu and natural gas consumption was 410.3 trillion Btu, total counted as 46% of the state’s energy consumption. Biomass was only 136.5 trillion Btu, 8% of the state’s total energy consumption (EIA, 2012). In terms of electricity, coal has also dominated electricity generation in Wisconsin despite the fact that Wisconsin has no active coalmines and no recoverable coal reserves. According to EIA, as of July 2014, about 63.5% of net electricity generation was from Coal fired resources with 3315 GWh. Hydroelectricity counted for 2.7% and other renewable resources was only 4.6% (EIA, 2014).
Wisconsin has been developing its renewable resources to attain energy, led by the state’s Office of Energy Independence established in 2007. Wisconsin's goal is for all new installed electricity generation capacity to come from renewable energy resources to the extent that it is cost−effective and technically feasible. Currently, renewable resources provide less than one-tenth of the state's net electricity generation. Non-hydroelectric renewable generation is mostly from various forms of biomass, about 50%, mostly wood and wood waste, and the rest is from wind (EIA, 2014). In addition, as one of the top 10 corn producing states, Wisconsin began its ethanol production in 2001 and is now among the top one-fourth of ethanol-producing states. According to Wisconsin State Energy Office, Wisconsin's annual ethanol production capacity has reached 470 million gallons, making it the 9th largest ethanol producing state in the nation (Wisconsin State Energy Office, 2014).
4. Biomass-Bases Electricity Generation Trends Comparison
Figure 1 Comparison of Total Amount of Biomass-Based Electricity Generation Trend
Figure 1 shows historical trends of biomass-based electricity generation from 1990 to 2012 in the three selected states. Figure 1 illustrates the total amount of biomass-based electricity generation. The data shown is in gigawatt hour and it includes energy generated by utilities, individual power producers (IPP) and combined heat and power (CHP) sectors in the state. On the left axis, it shows the individual state’s total biomass-based electricity generation, and on the right axis, it shows that sum of the three states’ biomass-based electricity production.
0 1,000 2,000 3,000 4,000 5,000 6,000 7,000 0 500 1,000 1,500 2,000 2,500 3,000 1990 1991 1992 1993 1994 1995 1996 1997 1998 1999 2000 2001 2002 2003 2004 2005 2006 2007 2008 2009 2010 201 1 2012 T otal Bi omas s-b as ed El ec tr ic ity G en er ati on (G Wh ) S tate 's Bi omas s-b as ed El ec tr ic ity G en er ati on (G Wh )
Total Amount of Biomass-‐Based Electricity Generation Trend
MI MN WI
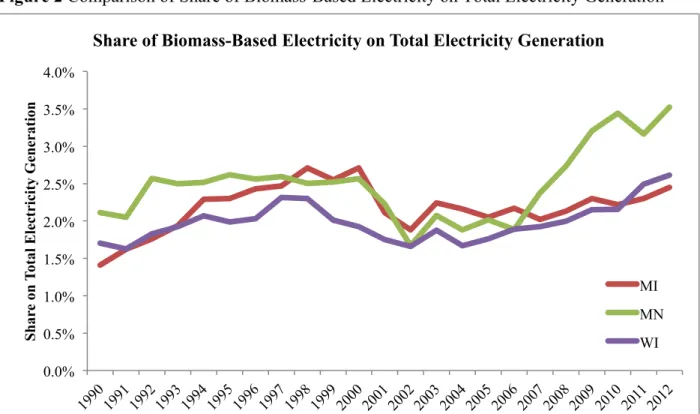
Figure 2 Comparison of Share of Biomass-Based Electricity on Total Electricity Generation
Figure 2 shows the share of biomass-based electricity generation on total electricity industry. The purpose of having Figure 2 is to help to identify if there are any difference between looking at the performance of biomass-based electricity generation alone or within the whole electricity. However, after comparing the two sets of data of each state, no major differences were found. The trend of the total amount and the trend of the share for each state generally follow the same pattern. Therefore, the following discussion uses the data found in Figure 1 as it is more straightforward. These figures were created based on the data found on Form-923 and predecessor forms of Power Plant Operation Report published by EIA (EIA, 2014).
In Figure 1, it can be seen a general increase for all three states in the first half of 1990s, became flat during the later half of 1990s, decreased sharply in around 2000 and went through fluctuation. Then it slowly recovered from 2002 and began to increase again around 2005 (2009 for Michigan).
5. Policy Profile
This section introduces the policies of different types that relates to biomass production. Table 2 provides a list view of the policy. The code of each policy is based on either it is a federal policy (FD) or a state policy (i.e. MI means Michigan); the year it was enacted (the last two digits of the year). “P” plus number does not necessary means the order of the policies enacted in the same year. However, the number should give the total amount of policies in the same year when added up. For example, the code “FD78P1” for Public Utility Regulatory Policies Act indicates that this policy was a federal policy that enacted in the year 1978. And there was only one biomass-related federal policy in 1978.
0.0% 0.5% 1.0% 1.5% 2.0% 2.5% 3.0% 3.5% 4.0% S h ar e on T otal El ec tr ic ity G en er ati on
Share of Biomass-Based Electricity on Total Electricity Generation
MI MN WI
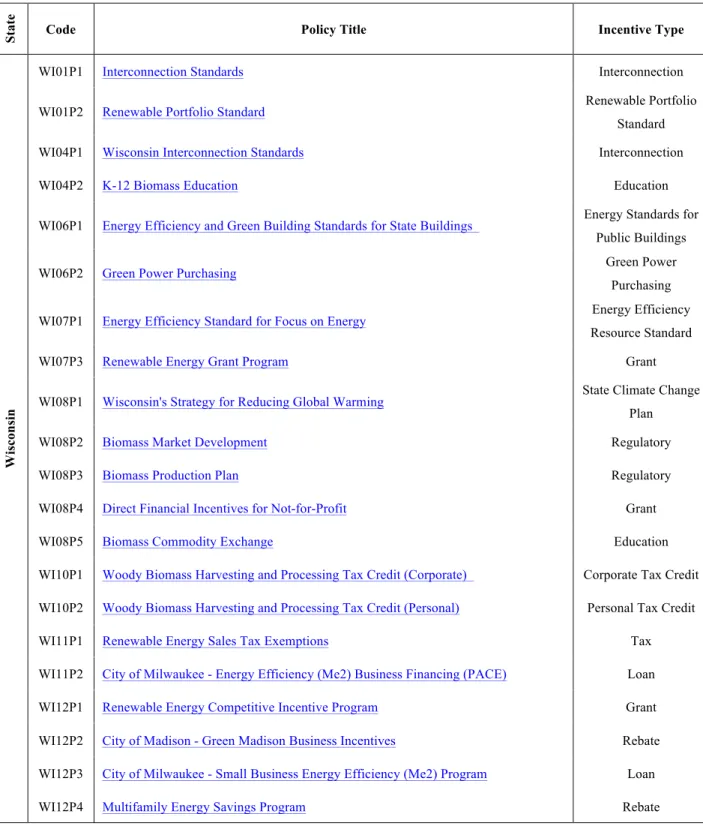
Table 2 Complete List of Federal and State Government Biomass-Related Plicies
St
at
e
Code Policy Title Incentive Type
Fe
de
ra
l
FD78P1 Public Utility Regulatory Policies Act Public Law FD86P1 Modified Accelerated Cost-Recovery System (MACRS) + Bonus Depreciation
(2008-2013)
Corporate Depreciation FD92P1 Renewable Electricity Production Tax Credit (PTC) Corporate Tax Credit FD97P1 The Climate Trust - Offset Request for Proposals Federal Grant
Program FD00P1 USDA - High Energy Cost Grant Program Federal Grant
Program FD02P1 USDA - Rural Energy for America Program (REAP) Loan Guarantees Federal Loan
Program FD03P1 USDA - Rural Energy for America Program (REAP) Grants Federal Grant
Program FD03P2 NARUC Model Interconnection Procedures and Agreement for Small DG Resources Interconnection FD05P1 Interconnection Standards for Small Generators Interconnection FD05P2 Tribal Energy Program Grant Federal Grant
Program FD05P3 Clean Renewable Energy Bonds (CREBs) Federal Loan
Program FD05P4 U.S. Federal Government - Green Power Purchasing Goal Green Power
Purchasing FD05P5 U.S. Department of Energy - Loan Guarantee Program Federal Loan
Program FD06P1 FERC Small Generator Interconnection Procedures (SGIP) and Agreement (SGIA) Interconnection FD06P2 Residential Energy Efficiency Tax Credit Personal Tax Credit FD08P1 Business Energy Investment Tax Credit (ITC) Corporate Tax Credit FD08P2 USDA - Repowering Assistance Biorefinery Program Federal Grant
Program FD08P3 Qualified Energy Conservation Bonds (QECBs) Federal Loan
Program FD09P1 IREC Model Interconnection Rules Interconnection FD11P1 USDA - Biorefinery Assistance Program Federal Loan
Table 2 Continued
St
at
e
Code Policy Title Incentive Type
Mi
ch
ig
an
MI83P1 Great Lakes Biomass State and Regional Partnership (GLBSRP) State Grant Program MI00P1 MI, Low-income and Energy Efficiency Fund (LIEEF) State Grant Program MI02P1 Alternative Energy Personal Property Tax Exemption Property Tax
Incentive
MI02P2 Refundable Payroll Credit Industry
Recruitment/Support MI02P3 Nonrefundable Business Activity Tax Credit Industry
Recruitment/Support
MI03P1 Biomass Curriculum Research and
Development MI03P2 Interconnection Standards Interconnection MI06P1 Renewable Energy Renaissance Zones Industry
Recruitment/Support MI06P2 Biomass Gasification and Methane Digester Property Tax Exemption Property Tax
Incentive MI06P3 City of Grand Rapids - Green Building Requirements for Municipal Buildings Energy Standards for
Public Buildings MI06P4 City of Ann Arbor - Green Power Purchasing Green Power
Purchasing MI07P1 Michigan's 21st Century Electric Energy Plan State Energy Plan MI07P2 City of Grand Rapids - Green Power Purchasing Policy Green Power
Purchasing MI08P1 Biomass Energy Program Grants State Grant Program
MI08P2 Net Metering Net Metering
MI08P3 Renewable Energy Standard Renewables Portfolio
Standard MI08P4 Interconnection Standards Interconnection MI08P5 Alternative Energy Portfolio Standard Renewables Portfolio
Standard MI08P6 Energy Efficiency in State Buildings Energy Standards for
Public Buildings
MI09P1 Climate Action Plan State Climate Change
Plan MI10P1 Local Option - Property Assessed Clean Energy PACE Financing
Table 2 Continued
St
at
e
Code Policy Title Incentive Type
Mi
ch
ig
an MI10P2 Energy Revolving Loan Fund - Clean Energy Advanced Manufacturing
Industry Recruitment/Support MI10P3 Energy Revolving Loan Fund - Public Entities State Loan Program MI11P1 City of Ann Arbor - PACE Financing PACE Financing
Mi n n es ot a
MN83P1 Net Metering Net Metering
MN83P2 Great Lakes Biomass State and Regional Partnership (GLBSRP) Grant Program MN88P1 Sustainable Agriculture Loan Program State Loan Program MN94P1 Value-Added Stock Loan Participation Program State Loan Program MN94P2 Renewable Energy Production Incentive Production Incentive MN95P1 Agricultural Improvement Loan Program State Loan Program MN95P2 Xcel Energy Wind and Biomass Generation Mandate Renewables Portfolio
Standard MN98P1 Methane Digester Loan Program State Loan Program MN99P2 Xcel Energy - Renewable Development Fund Grants Grant Program MN01P1 Minnesota Energy Planning Report 2001 State Energy Plan MN01P2 Renewable Energy Production Incentive Production Incentive MN01P3 Comprehensive Energy Savings Plan for State Facilities Energy Standards for
Public Buildings MN01P4 Interconnection Standards Interconnection MN04P1 Minnesota Interconnection Standards Interconnection MN05P1 Community-Based Energy Development (C-BED) Tariff Other MN07P1 Minnesota Energy Efficiency Resource Standard Renewables Portfolio
Standard MN07P2 Renewables Portfolio Standard Renewables Portfolio
Standard MN08P1 Minnesota Climate Mitigation Action Plan State Climate Change
Plan
Wi
sc
on
si
n WI82P1 Wisconsin Net-Metering Rules Net Metering WI83P1 Great Lakes Biomass State and Regional Partnership (GLBSRP) Grant
Table 2 Continued
St
at
e
Code Policy Title Incentive Type
Wi
sc
on
si
n
WI01P1 Interconnection Standards Interconnection WI01P2 Renewable Portfolio Standard Renewable Portfolio
Standard WI04P1 Wisconsin Interconnection Standards Interconnection
WI04P2 K-12 Biomass Education Education
WI06P1 Energy Efficiency and Green Building Standards for State Buildings Energy Standards for
Public Buildings
WI06P2 Green Power Purchasing Green Power
Purchasing WI07P1 Energy Efficiency Standard for Focus on Energy Energy Efficiency
Resource Standard
WI07P3 Renewable Energy Grant Program Grant
WI08P1 Wisconsin's Strategy for Reducing Global Warming State Climate Change
Plan
WI08P2 Biomass Market Development Regulatory
WI08P3 Biomass Production Plan Regulatory
WI08P4 Direct Financial Incentives for Not-for-Profit Grant
WI08P5 Biomass Commodity Exchange Education
WI10P1 Woody Biomass Harvesting and Processing Tax Credit (Corporate) Corporate Tax Credit WI10P2 Woody Biomass Harvesting and Processing Tax Credit (Personal) Personal Tax Credit WI11P1 Renewable Energy Sales Tax Exemptions Tax WI11P2 City of Milwaukee - Energy Efficiency (Me2) Business Financing (PACE) Loan WI12P1 Renewable Energy Competitive Incentive Program Grant WI12P2 City of Madison - Green Madison Business Incentives Rebate WI12P3 City of Milwaukee - Small Business Energy Efficiency (Me2) Program Loan WI12P4 Multifamily Energy Savings Program Rebate *Each policy title is clickable and will direct to the webpage or site that has the detailed description of the policy.
6. Analysis
In the previous sections, the paper presents the historical trend of electricity generation from biomass, and introduces the different types of policies that were enacted during the chosen time period. The study tries to determine if existing policies or newly issued policies could actually explain the changes in the biomass-based electricity generation trend.
As shown in Table 1, biomass productions policies started to be enacted as early as in1978. The federal policy Public Utility Regulatory Policies Act (PURPA) was enacted in 1978 in response to the 1973 energy crisis. One provision of PURPA was the requirement for increased use of energy cogeneration, which led to a big increase in the number of cogeneration plants. At the same time, the total amount of biomass energy increased constantly in the early half of the 1990s. Therefore, it is reasonable to think that PURPA had positive impact on biomass energy usage. It is also found that the number of policies started to grow after 2000. If the earlier statement is correct, it is expected to see an increase in the amount of biomass energy. However, the figure shows a sudden drop around the year 2000. According to the National Bureau of Economic Research (NBER), one recession took place in 2001. A recession is “a significant decline in economic activity spread across the economy, lasting more than a few months, normally visible in real gross domestic product (GDP), real income, employment, industrial production, and wholesale-retail sales” (NBER, 2014). Thinking that the impact of a recession on electricity generation may be severe, it is inappropriate to exam the effect of policy during the recession.
Additionally, according to Figure 1, another noticeable increase of the trend happened around the year 2006, and that was when a great number of polices were issued. For example, in 2005 and 2006, there were 7 federal policies and in 2006 and 2007, Michigan issued 6 policies. As many polices were enacted every year since 2005 and the trend of the total biomass-based electricity generation continued to grow, it is confident that policies have positive impacts on biomass energy production.
7. Conclusion
Many researches have found that energy generation and use are the key contributors to environmental issues that are challenging our quality of living today (Dincer, 1999). Political leaders have proposed various forms of policies to address these problems, and renewable energy, which has relatively low environmental impact, has become one of the solutions suggested. Some renewable energy policies have the goal of increasing the use of biomass-based energy, the most common form among all the sources of renewable energy. This study established the effectiveness of biomass production policies on biomass-based electricity generation through analyzing and comparing the three selected states’ background in energy consumption, renewable energy and policies. Based on the data analysis of the historical trend of electricity generation from biomass and the list of related policies issued during the selected time period, it is observed an increase in the electricity generation from biomass in the same time period that policies were issued. Therefore, the study comes to the conclusion that renewable energy policies have positive impacts on the increase of renewable energy usage in energy generation.
References
Billy J. Roberts. “Solid Biomass Resources by County.” National Renewable Energy Laboratory. (2014)
http://www.nrel.gov/gis/images/biomass_2014/national_biomass_solid_total_2014-01.jpg DEED. “Minnesota Clean Energy Economy Profile.” Minnesota’s Department of Employment
and Economic Development. (2014) Retrieved from:
http://mn.gov/deed/images/MN%20CleanEnergyEconomyProfile%20Full%20Report.pdf Dennis R. Becker, Cassandra Moseley, and Christine Lee. “A supply chain analysis framework
for assessing state-level forest biomass utilization policies in the United States.” Proceedings of Elsevier. (2010): n. page. Web. 21 Feb, 2012
Dennis R. Becker, Paul DeLong, Kathleen E. Halvorsen, Kenneth Skog, Allison Hellman, and Terry Mace. “The Lake States Outlook for Sustainable Forest Bioenergy and Biofuels
Production.” Proceedings of Pinchot Institute for Conservation. (2009): n. page. Web. 21 Feb, 2012
DOE. “U.S. DOE Combined Heat and Power Installation Database.” U.S. Department of Energy. (2013) Retrieved from: https://doe.icfwebservices.com/chpdb/state/MI)
DNR. “Biomass Program.” Minnesota Department of Natural Resources. (2013) Retrieved from: http://www.dnr.state.mn.us/forestry/biomass/index.html
DNR. “Minnesota Facts & Figures - Forests.” Minnesota Department of Natural Resources. (2013) Retrieved from: http://www.dnr.state.mn.us/faq/mnfacts/forests.html
DNR. “Minnesota Facts & Figures - Land.” Minnesota Department of Natural Resources. (2014) Retrieved from: http://www.dnr.state.mn.us/faq/mnfacts/land.html
DSIRE. “Database of State Incentives for Renewable Energy & Efficiency.” North Carolina State University and U.S. Department of Energy. (2014). Retrieved from:
http://www.dsireusa.org.
EIA. U.S. Energy Information Administration. (2014) Retrieved from: http://www.eia.gov EIA. “Electricity”. U.S. Energy Information Administration. (2014) Retrieved from: http://www.eia.gov/electricity/data/eia923/index.html
EIA. “Rankings: Total Energy Consumed per Capita, 2012.” U.S. Energy Information Administration. (2012) Retrieved from: http://www.eia.gov/state/rankings/
http://www.eia.gov/state/?sid=MI
EIA. “Michigan State Energy Profile.” U.S. Energy Information Administration. (2014) Retrieved from: http://www.eia.gov/state/print.cfm?sid=MI
EIA. “Minnesota.” U.S. Energy Information Administration. (2014) Retrieved from: http://www.eia.gov/state/?sid=MN
EIA. “Minnesota State Energy Profile.” U.S. Energy Information Administration. (2014) Retrieved from: http://www.eia.gov/state/print.cfm?sid=MN
EIA. “Rankings: Total Carbon Dioxide Emissions, 2011.” U.S. Energy Information
Administration. (2011) Retrieved from: http://www.eia.gov/state/rankings/?sid=MI#series/226 EIA. “Table C13. Energy Consumption per Capita by End-Use Sector, Ranked by State, 2012.” U.S. Energy Information Administration. (2012) Retrieved from:
http://www.eia.gov/state/seds/data.cfm?incfile=/state/seds/sep_sum/html/rank_use_capita.html& sid=US
EIA. “Today in Energy - E85 Fueling State Availability is Increasing.” U.S. Energy Information Administration. (2014) Retrieved from: http://www.eia.gov/todayinenergy/detail.cfm?id=15311 EIA. “Wisconsin.” U.S. Energy Information Administration. (2014) Retrieved from:
http://www.eia.gov/state/?sid=WI
EIA. “Wisconsin State Energy Profile.” U.S. Energy Information Administration. (2014) Retrieved from: http://www.eia.gov/state/print.cfm?sid=WI
EPA. United States Environmental Protection Agency. (2014) Retrieved from: http://www.epa.gov
EPA. “Green Power Market.” United States Environmental Protection Agency. Retrieved from: http://epa.gov/greenpower/gpmarket/index.htm
EPA. “dCHPP (CHP Policies and incentive database).” (2014) United States Environmental Protection Agency. Retrieved from: http://www.epa.gov/chp/policies/database.html
EPA. “Combined Heat and Power Partnership.” United States Environmental Protection Agency. (2015) Retrieved from: http://www.epa.gov/chp/basic/
Fargione, Hill, Tilman, Polasky, and Hawthorne. “Land Clearing and the Biofuel Carbon Debt.” Science. (2008): n. page. Web. 22 Feb, 2012
Ibrahim Dincer. “Renewable energy and sustainable development: a crucial review.” Proceedings of Pergamon. (1999): n. page. Web. 21 Feb, 2012
Michigan Biomass. “An Overview of Biomass Power in Michigan.” (2013) Retrieved from: http://michiganbiomass.com/docs/BiomassWhitepaper2013.pdf
Minnesota.gov. “Renewable Energy.” State of Minnesota. https://mn.gov/portal/natural-resources/renewable-energy/
NERL. National Renewable Energy Laboratory. U.S. Department of Energy. Retrieved from: http://www.nrel.gov
Peter McKendry. “Energy production from biomass (part 1): overview of biomass.” Proceedings of Elsevier. (2001): n. page. Web. 21 Feb, 2012
Sandra L. Brown, Paul Schroeder, and Jeffrey S. Kern. “Spatial distribution of biomass in forests of the eastern USA.” Proceedings of Elsevier. (1999): n. page. Web. 21 Feb, 2012
Daniel Savaloja. “Minnesota’s Biodiesel Mandate: Costly, Risky, Unfair.” StarTribune. (2014) Retrieved from: http://www.startribune.com/opinion/commentaries/265623301.html
Union of Concerned Scientists. “How Biomass Energy Works.” Union of Concerned Scientists. (2010)
http://www.ucsusa.org/clean_energy/our-energy-choices/renewable-energy/how-biomass-ener gy-works.html#c13
United States Census Bureau. “Population Clock.” (2014) Retrieved from: http://www.census.gov/popclock/
Wisconsin State Energy Office. “Ethanol.” (2014) Retrieved from: