Estimation of wind storm impacts over
Western Germany under future climate
conditions using a statisticaldynamical
downscaling approach
Article
Published Version
Pinto, J. G., Neuhaus, C. P., Leckebusch, G. C., Reyers, M.
and Kerschgens, M. (2010) Estimation of wind storm impacts
over Western Germany under future climate conditions using a
statisticaldynamical downscaling approach. Tellus Series A:
Dynamic Meteorology and Oceanography, 62 (2). pp. 188201.
ISSN 02806495 doi: https://doi.org/10.1111/j.1600
0870.2009.00424.x Available at
http://centaur.reading.ac.uk/32775/
It is advisable to refer to the publisher’s version if you intend to cite from the
work.
Published version at: http://dx.doi.org/10.1111/j.16000870.2009.00424.xTo link to this article DOI: http://dx.doi.org/10.1111/j.16000870.2009.00424.x
Publisher: WileyBlackwell
All outputs in CentAUR are protected by Intellectual Property Rights law,
including copyright law. Copyright and IPR is retained by the creators or other
www.reading.ac.uk/centaur
CentAUR
Central Archive at the University of Reading
Reading’s research outputs online
Tellus (2010), 62A, 188–201 C2009 The Authors
Journal compilationC2010 Blackwell Munksgaard
Printed in Singapore. All rights reserved
T E L L U S
Estimation of wind storm impacts over Western
Germany under future climate conditions using
a statistical–dynamical downscaling approach
ByJO AQ U IM G . P IN T O1∗, C H R IS T IA N P. N E U H AU S1, G R E G O R C . L E C K E B U S C H2,M A R K R E Y E R S1and M IC H A E L K E R S C H G E N S1, 1Institute for Geophysics and Meteorology,
University of Cologne, Kerpener Str. 13, 50923 Cologne, Germany;2Institute for Meteorology, Freie Universit¨at
Berlin, Carl-Heinrich-Becker-Weg 6–10, 12165 Berlin, Germany (Manuscript received 9 April 2009; in final form 16 November 2009)
A B S T R A C T
A statistical–dynamical regionalization approach is developed to assess possible changes in wind storm impacts. The method is applied to North Rhine-Westphalia (Western Germany) using the FOOT3DK mesoscale model for dynamical downscaling and ECHAM5/OM1 global circulation model climate projections. The method first classifies typical weather developments within the reanalysis period using K-means cluster algorithm. Most historical wind storms are associated with four weather developments (primary storm-clusters). Mesoscale simulations are performed for representative elements for all clusters to derive regional wind climatology. Additionally, 28 historical storms affecting Western Germany are simulated. Empirical functions are estimated to relate wind gust fields and insured losses.
Transient ECHAM5/OM1 simulations show an enhanced frequency of primary storm-clusters and storms for 2060–2100 compared to 1960–2000. Accordingly, wind gusts increase over Western Germany, reaching locally+5% for 98th wind gust percentiles (A2-scenario). Consequently, storm losses are expected to increase substantially (+8% for A1B-scenario,+19% for A2-scenario). Regional patterns show larger changes over north-eastern parts of North Rhine-Westphalia than for western parts. For storms with return periods above 20 yr, loss expectations for Germany may increase by a factor of 2. These results document the method’s functionality to assess future changes in loss potentials in regional terms.
1. Introduction
Winter storms are one of the most destructive natural hazards over Central Europe. Unlike tornados or hail, winter storms typ-ically affect large areas (e.g. several countries), are likely to cost billions of Euros, and may have huge societal impacts. For ex-ample, storm Kyrill in January 2007 led to a widespread disrup-tion of infrastructures, traffic, power shortages over large parts of Central Europe and claimed a total of 47 lives (Fink et al., 2009). Its estimated insured losses amount to around 4–4.5 bil-lion euro (SwissRe, 2008). Such winter storms typically appear under specific synoptic conditions (e.g. Ulbrich et al., 2001). For example, Raible (2007) and Pinto et al. (2009b) showed that extreme cyclones are more frequent in positive North Atlantic Oscillation (NAO) phases. Pinto et al. (2009b) attributed this
∗Corresponding author. e-mail: [email protected] DOI: 10.1111/j.1600-0870.2009.00424.x
fact to the wider area with good conditions for cyclone devel-opment, which extends over the whole North Atlantic (NA) in positive NAO phases. Recently, Leckebusch et al. (2008, here-after L08) have shown that a small number of typical weather developments (named primary storm clusters, PSCs) are associ-ated with a large number of winter storms over Germany in the last 50 yr. The obtained classification of weather developments is valid for Central Europe.
In order to analyse the regional impact of storms, mesoscale models often include a wind gust parameterization to estimate surface wind extremes (e.g. Goyette et al., 2003). In particu-lar, Pinto et al. (2009a) analysed 10 storms affecting Western Germany between 1990 and 1998 using ERA-40 reanalysis data (Uppala et al., 2005) as boundary conditions. Pinto et al. (2009a) used the mesoscale model FOOT3DK (Flow over Orographi-cally structured Terrain, 3-D K¨olner Version 3.10, see Section 3 in this paper for details) with an implemented wind gust estimate (WGE) after Brasseur (2001). The WGE-method proposes that surface gusts result from the deflection of air parcels flowing
higher in the boundary layer brought down by turbulent eddies, and takes into account the mean wind, the static stability and the turbulent structure of the atmosphere. Further, it permits the calculation of a bounding interval for the gust estimate, giving a range of likely magnitudes. Thus, the estimation of wind gusts is physically based and not purely empirical.
Many recent studies indicate that large-scale circulation in general and cyclone activity in particular will be affected by increasing greenhouse gas forcing (cf. Meehl et al., 2007; Ulbrich et al., 2009). Studies considering global circulation model (GCM) ensembles gave evidence that while the to-tal number of cyclones is slightly reduced over the Northern Hemisphere, the number of extreme storms may increase (e.g. Lambert and Fyfe, 2006; Leckebusch et al., 2006). Further, Stephenson et al. (2006) documented that most GCMs show a tendency towards more positive NAO under future climate conditions. Based on ECHAM5/OM1 (hereafter ECHAM5) en-semble simulations, Bengtsson et al. (2006) and Pinto et al. (2007b) did not find an overall increase of extreme systems with enhanced greenhouse gas forcing on hemispheric terms, but only over limited regions, e.g. over the eastern NA close to the British Isles. These changes are in turn associated with an extension of the polar jet into Europe (cf. Pinto et al., 2007b, their fig. 7) and an increased pressure gradient over Europe (Fink et al., 2009, their fig. 9) under future climate conditions. This region is the most important path for storms affecting Central Europe. Accordingly, enhanced extreme wind speeds over West-ern Europe are detected in regional climate models (RCMs; e.g. Beniston et al., 2007). Hence, enhanced loss potentials have been estimated for Western/Central Europe under future climate con-ditions (cf. Leckebusch et al., 2007; Pinto et al., 2007a). These results are not consensual and may be sensitive to the choice of GCMs/RCMs, scenarios, and methodologies to assess cyclone intensity/numbers, deep cyclone-induced storminess, strong sur-face winds or losses (e.g. Beniston et al., 2007; Christensen et al., 2007; Raible et al., 2008; Ulbrich et al. 2009).
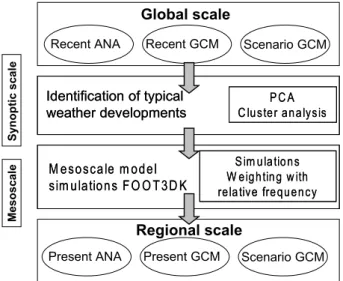
This work presents the development of a statistical–dynamical regionalization approach to infer possible changes in wind storm impacts due to climate change (cf. flowchart in Fig. 1). As an example, this approach is applied to the state of North Rhine-Westphalia (NRW, cf. Fig. 2), using the FOOT3DK mesoscale simulations to dynamically downscale the wind fields, and ECHAM5 GCM climate projections. First, FOOT3DK simu-lations are done for each of the weather developments. Consid-ering the relative frequency of the weather developments, the local wind gust climatology for present climate conditions is derived. Additionally, historical storms are simulated, and their wind gust fields (normalized with the wind climatology) are as-signed to insured losses attributed to the storms’ passage. This allows for the derivation of loss functions for recent climate con-ditions. Taking into account frequency changes of the weather developments under future climate conditions, the method per-mits the computation of wind climatologies for future climate
Fig. 1. Flow chart describing the steps for the statistical–dynamical downscaling methodology. With this methodology, climate parameters from the global scale are transferred to the regional scale. ANA: reanalysis data; GCM: global circulation model; PCA: principal component analysis. For further details see text.
conditions and thus the assessment of wind changes. Finally, this information and the estimated loss functions for historical storms allow for an assessment of changes in loss potentials over NRW.
The paper is organized as follows. Section 2 provides information on data and models. Section 3 describes the statistical–dynamical approach and its various components. Re-sults for historical storms and the derivation of the regional wind climatology for present climate conditions are presented in Sec-tion 4.1. SecSec-tion 4.2 deals with the impacts of anthropogenic cli-mate change on the wind climatology and loss potentials, while Section 4.3 focusses on the relevance of individual storm events. A short discussion concludes this paper.
2. Data and models
For this study, we consider different climate data sets: reanaly-sis data (ERA-40/ECMWF and NCEP) for recent day climate, RCM simulations with FOOT3DK for dynamically downscal-ing, wind data from German Weather Service for validation, ECHAM5 GCM climate projections, and insurance data to es-timate loss potentials. ERA-40 reanalysis data (Uppala et al., 2005; hereafter ERA) from European Centre for Medium Range Weather Forecasts (ECMWF) are used as boundary conditions for RCM simulations. ERA data is available on N80/T159
spec-tral truncated grids, corresponding roughly to 1.125◦×1.125◦,
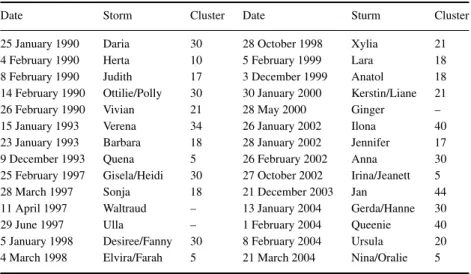
and has a 6-hourly time resolution. Data from January 1990 to February 2002 are used for the first 22 storms (cf. Table 1). For October 2002 to March 2004 (six storms), ECMWF Analysis is used at the same spatial and temporal resolution as ERA.
Fig. 2.(a) Weather chart corresponding to the passage of the cold front from Anatol over Germany on 00 UTC 4 December 1999 (taken from the Europ¨aischer Wetterbericht, 1999). The location of the study area is indicated by the black box. (b) Study area with NRW borders (black line), orography (colours, in m a.s.l.) and region names as given in the text.
Table 1. List of historical storms. Date, name (as given by the German Weather Service), and attributed cluster
Date Storm Cluster Date Sturm Cluster 25 January 1990 Daria 30 28 October 1998 Xylia 21 4 February 1990 Herta 10 5 February 1999 Lara 18 8 February 1990 Judith 17 3 December 1999 Anatol 18 14 February 1990 Ottilie/Polly 30 30 January 2000 Kerstin/Liane 21 26 February 1990 Vivian 21 28 May 2000 Ginger – 15 January 1993 Verena 34 26 January 2002 Ilona 40 23 January 1993 Barbara 18 28 January 2002 Jennifer 17 9 December 1993 Quena 5 26 February 2002 Anna 30 25 February 1997 Gisela/Heidi 30 27 October 2002 Irina/Jeanett 5 28 March 1997 Sonja 18 21 December 2003 Jan 44 11 April 1997 Waltraud – 13 January 2004 Gerda/Hanne 30 29 June 1997 Ulla – 1 February 2004 Queenie 40 5 January 1998 Desiree/Fanny 30 8 February 2004 Ursula 20 4 March 1998 Elvira/Farah 5 21 March 2004 Nina/Oralie 5
Note: Only storms between October and March are assigned to a cluster. Comparison of RCM simulations with ERA and ECMWF
Anal-ysis for the same storm (e.g. Anna, cf. Tab.1) show no system-atic bias. Clustering storm-related weather developments make use of NCEP reanalysis (Kistler et al., 2001; hereafter NCEP)
with 2.5◦×2.5◦resolution at 12-hourly intervals for the period
October 1958 to March 2004. Comprising a longer time period and being constantly updated, this compensates the limitation of the coarse resolution of NCEP. This study focuses on winter (October–March), as wind-related damage in Europe is caused mostly by winter storms (see e.g. Klawa and Ulbrich, 2003). Although some historical storms are actually not in winter (see
Table 1), such events belong to the weaker storms included on the list.
The flow conditions associated with the passage of storms over Western Germany are simulated with FOOT3DK. This model was developed for flow and dispersion simulations over complex orography (e.g. Br¨ucher et al., 2001) and has since been used in many different applications (e.g. Shao et al., 2001; Heinemann and Kerschgens, 2005; Sogalla et al., 2006). Detailed information on the model physics and the nesting procedure is given in Shao et al. (2001). For the present application, we con-sider a double nesting: the first simulation is performed with
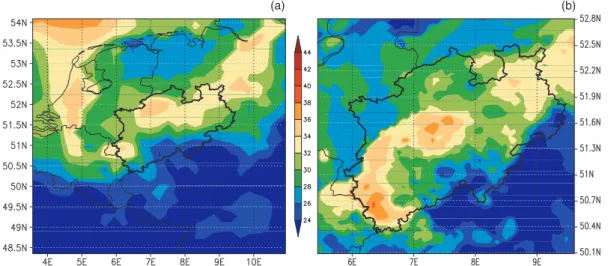
Fig. 3. Maximum wind gusts (in m s−1) during the episode of storm Anatol (2–4 December 1999) based on (a) the 20 km×20 km and (b) the
5 km×5 km FOOT3DK simulations.
20 km×20 km resolution (domain size 560 km×620 km,
Fig. 3a) using ERA boundary conditions. In a second step,
FOOT3DK is run with 5 km ×5 km resolution (300 km×
300 km; includes NRW and bordering areas, Fig. 3b) using the
20 km×20 km run as boundary conditions. Simulated fields
for the 72 hr centered on the passage of the storm over West-ern Germany are evaluated. FOOT3DK produces all necessary parameters for the application of the WGE-method. The WGE method is run as an ‘online’ diagnostic, i.e. the wind gusts are computed at each internal model step, and are therefore treated as an additional model output. The simulated wind gusts tend to be closer to observations for stronger storms. For weaker storms, wind gust estimates are typically too high. Station data from the German Weather Service (16 stations) was used to validate the obtained wind gust estimates (cf. Pinto et al., 2009a).
Furthermore, coupled GCM simulations of the ECHAM5 are taken into account (T63, 6-hourly data; cf. Jungclaus et al., 2005; Roeckner et al., 2006). The GCM data is used to assess possible changes in the frequency of the weather developments between recent and future climate conditions. Additionally, changes in frequency and intensity of cyclones and surface winds are con-sidered. Simulations for both recent climate (with historical
forcing reaching 367 ppm of CO2 concentrations in the year
2000; hereafter 20C) and enhanced GHG-forcing (SRES
sce-narios A1B and A2, reaching CO2 concentrations of 703 and
836 ppm in the year 2100, respectively; cf. Naki´cenovi´c et al., 2000) are considered. Three ensemble runs per scenario are used. Climate signals refer to changes between 2060–2100 and 1960–2000 in terms of ensemble averages. These periods were chosen in order to allow a comparison with previous studies by the authors.
Finally, homeowners’ comprehensive insurance loss data for the 28 historical storms (Table 1) is considered. This data is available for individual postal codes: for 1990–1992 for 4-digit postal codes (e.g. 5000), after 1993 for 5-digit postal codes
(e.g. 50937). The total number of postal codes is 438 and 864, respectively. A 5-digit postal code in NRW covers an average
area of about 15 km2. Additionally, reference total sums insured
for homeowners’ comprehensive insurance loss data for each postal code are available for every calendar year. These annual sums are indexed to a common reference value in order to com-pare different years (i.e. the effects of inflation and increase in insured values were removed from the time series). For further computations, we use loss ratios between occurred losses and total sums insured per postal code. Loss data was obtained from Westf¨alische Provinzial AGandDeutsche R¨uckversicherung AG in a joint research activity documented in Pinto et al. (2008).
Additional data was provided byProvinzial Rheinland AG.
3. Statistical–dynamical regionalization method
This statistical–dynamical regionalization method was devel-oped to assess the influence of climate change on wind storms impacts. In several consecutive steps, and starting with the analy-sis of the weather developments, the implications of the detected changes in terms of large-scale circulation (at GCM resolution) under future climate conditions are derived for regional and local scales. Our approach is similar to Fuentes and Heimann (2000), who developed their method specifically for alpine precipita-tion. As we include the weather developments described in L08 and FOOT3DK simulations validated in Pinto et al. (2009a), the following description focuses on the novel aspects of the present work and on its application to NRW.The main concept is summarized in the flowchart shown in Fig. 1. In a first step, the typical weather developments over
the NA and Europe (defined as 35◦W to 35◦E, and 35◦N to
70◦N) are investigated by means of an objective cluster analysis
(cf. L08). The clustering approach uses 12-hourly NCEP 1000 hPa geopotential height fields as an input variable. Only data from October through March is considered. A principal
component analysis is initially performed, retaining the 6 signif-icant leading principal components (determined using the ‘Rule N’-algorithm from Preisendorfer, 1988). The clustering itself is applied to 3-d periods constructed with these six principal components using a ‘K-means’ clustering algorithm. To select the optimum cluster classification (minimization of the objective function, cf. Hartigan and Wong, 1979), many different starting partitions were tested. Sensitivity tests showed that the most suit-able number of clusters was 55. The applied method permits the characterization of the time evolution of the regarded synoptic developments.
For Central Europe, L08 identifies four PSCs, which feature almost 72% of the historical extreme storm events and add only to 5.17% of all the cases. Their main characteristics are:
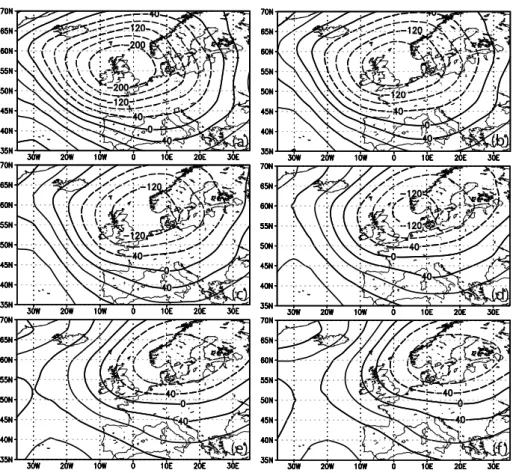
1. PSC 5 episodes feature cyclones travelling from the North-east Atlantic into the Baltic area with rising core pressure (cf. Fig. 4 for an example).
2. PSC 18 episodes are characterized by the transition from zonal to northwesterly flow above Central Europe featuring strong pressure gradients.
3. PSC 21 episodes feature deepening cyclones above the Norwegian Sea, which weaken and move slowly southeastward.
4. PSC 30 episodes are characterized by stationary steering lows between Iceland and Great Britain, with secondary lows propagating zonally over Central Europe.
These PSCs correspond respectively to PSC2, PSC4, PSC3 and PSC1 from L08. Further details and examples on the PSCs, including their associated cyclone tracks and wind finger prints over Europe, can be found in L08. These PSCs do not consist ex-clusively of extreme wind episodes: weather developments with similar (but weaker) pressure anomalies than a storm event (cf. Fig. 4) may also be assigned to a PSC. Clusters which rarely include storms are named secondary storm clusters (SSCs). In order to maintain the coherence with L08, we have kept their choice of SSCs, even though a few of the NRW storms (cf. Table 1) do not occur in any of the SSCs selected by L08.
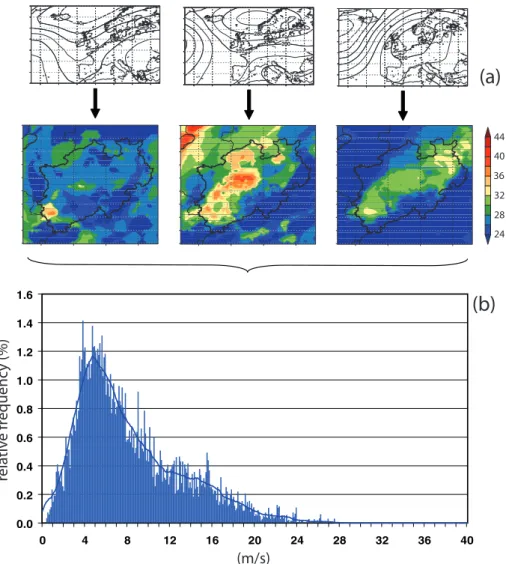
In a second step, the regional wind gust climatology is de-rived: simulations with FOOT3DK are performed for selected episodes for each of the 55 clusters (cf. flowchart in Fig. 5a). The number of individual simulations depends on the relevance of each cluster with respect to the upper percentiles of the wind gust climatology: eight simulations are performed for PSCs, four for SSCs, and one for all others (no storms). This optimized num-ber of simulations per cluster aims at enhancing the resolution
(a)
(b)
(d)
(f )
(c)
(e)
Fig. 4.Development of 1000 hPa geopotential height fields for a PSC 5 episode (3–5 October 1990). (a) 00 UTC 3 October, (b) 12 UTC 3 October, (c) 00 UTC 4 October, (d) 12 UTC 4 October, (e) 00 UTC 5 October and (f) 12 UTC 5 October. This episode is one of the nearest to the PSC 5 centroid. Values are given in gpm, negative values are represented as dashed lines.
0.0 0.2 0.4 0.6 0.8 1.0 1.2 1.4 1.6 0 4 8 12 16 20 24 28 32 36 40 44 40 36 32 28 24
(a)
(b)
(m/s)
relativ
e fr
equenc
y
(%)
Fig. 5. Flow chart describing computation of wind gust climatology. (a) For each weather development, RCM simulations are performed for selected episodes. Defined area and isoline contours for weather developments as Fig. 4, defined area and isoline contours for RCM simulations as Fig. 3b. Combining all RCM simulations for all clusters, the wind gust distribution is derived for each grid point. Panel (b) show an example of such wind gust distribution. For further details see text.
of the upper tail of wind gust distribution. The total number of simulations is 110. The selection of episodes is done subjec-tively among members close to the cluster centroid. However, care is being taken to include episodes of different ‘intensities’ (in terms of regional 1000 hPa geopotential height gradients). The wind climatology is derived from the RCM simulations and the relative frequency of the clusters. For each simulation and grid point, half-hourly wind gust values simulated during the 72 hr period are extracted. The full distribution for a grid point (cf. Example in Fig. 5b) is the sum of all those partial contribu-tions weighted with the relative frequency of each cluster. For clusters with multiple simulations (PSCs and SSCs), all runs are considered equally for the contribution of that cluster to the climatology. Next, the local 98th wind gust percentile values are derived. This threshold corresponds to the value above which damage may be expected (Klawa and Ulbrich, 2003). This value
is used later to normalize the simulated wind gust estimates for the historical storms.
The wind climatology for future climate conditions (2060–2100) is derived in the same way but using ECHAM5 data (cf. Fig. 1). We make the assumption that, on a first approx-imation, only the frequency of each of the synoptic developments may change. With this aim, the frequencies of the weather de-velopments are computed for present (20C, 1960–2000; as a reference) and future climate conditions(2060–2100; both A1B and A2 scenarios). In terms of the clustering approach, the cli-mate change signal is constructed by projecting the GCM data onto the empirical orthogonal functions attained from NCEP (cf. L08; their section 3.2). We consider the same clusters for both NCEP and ECHAM5 data and obtain comparable data sets for later analysis. However, similar clusters are obtained when the methodology is applied to GCM data directly (not shown).
17 18 19 20 21 22 23 24
16 (m/s) 0 10 20 30 40 50 60 (%)
(a)
(b)
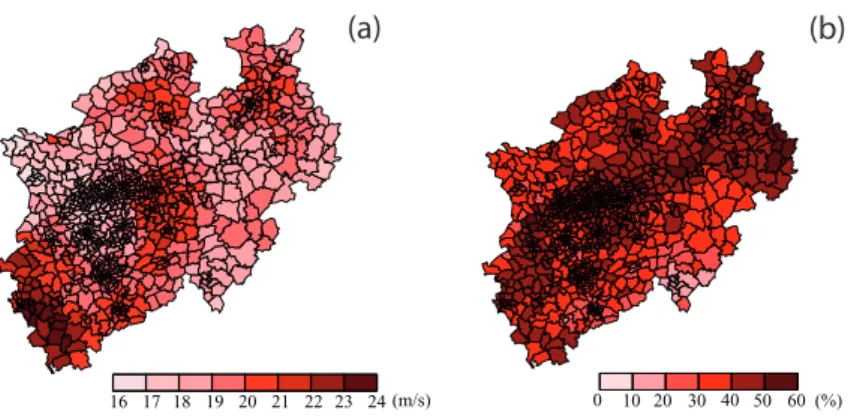
Fig. 6. (a) Climatological values of the 98th wind gust percentile for North
Rhine-Westphalia. (b) Maximum wind gusts for storm Anatol (as shown in Fig. 3b) normalised with (a). Data are presented for postal all codes (864 in total).
For the downscaling part, the FOOT3DK simulations considered for the NCEP-based climatology are used anew.
4. Results
4.1. Application to reanalysis data
In a first step, 28 storms which significantly affected Western Germany between 1990 and 2004 with respect to losses are se-lected (Table 1). For these storms, wind gust fields over NRW are simulated with FOOT3DK. Storm Anatol (Fig. 2a) is given as an example. Maximum wind gust values associated with its passage are shown in Fig. 3. The strongest gusts for most of the grid points over NRW are simulated around 18 UTC 3 Decem-ber, dominating the wind finger print shown in Fig. 3. For the
20 km×20 km simulation (Fig. 3a), the largest wind gusts over
NRW are simulated over the southwestern (Eifel) and
north-western (M¨unsterland) parts. In the 5 km×5 km run, the spatial
pattern of maximum wind gusts is slightly different (Fig. 3b):
the largest values are identified overEifel and central NRW
(Ruhr,where urban areas dominate), while the northwest is less affected. The main differences between the two runs may be attributed to the orography, which is better represented in the higher resolution run, resulting in a more realistic simulation of the local flow patterns. Detailed information on the validation against 16 synoptic stations can be found in Pinto et al. (2009a). Maximum wind gust fields for each storm are transposed from the model grid to the postal codes (see Section 3). This allows for an assignment to the insurance loss data. We assume that the occurred damage at any location is directly related to the local maximum wind gust, and thus consider only the maximum value during the 72-hr period. These gust values are normalized with the local 98th wind gust percentile (shown in Fig. 6a), which is representative for the reanalysis period. This approach is based on the assumption that construction is adapted to local wind conditions (cf. Klawa and Ulbrich, 2003). Hence, areas prone to being affected by losses can be identified. Fig. 6a shows the climatological 98th local wind gust percentile for all postal codes: darker areas indicate higher wind gusts than lighter areas.
The largest values are found overEifel(around 23 m s−1), while
overNiederrheinarea (further north), the values are somewhat
weaker (around 17 m s−1). Altogether, it documents the influence
of orography and/or urban areas on the modulation of wind gust fields under the dominant westerly/northwesterly flow. The 98th percentile wind gust values shown in Fig. 6a agree well with similar estimates obtained for 16 synoptic stations in NRW (not shown). As an example of a normalized with gust field, Fig. 6b shows results for Anatol (cf. Table 1). The largest values are found for the central and northern NRW, where values exceed the (climatological) 98th percentile values by more than 50%. The wind gust finger prints (at high spatial resolution) for all 28 storms are obtained in such a manner.
Normalized wind gust fields for all 28 storms are now com-pared with the insurance loss data. This enables the derivation
of loss functions for the recent past by relating over 20 0001
single damage values to normalized wind gusts values. The best functional relationship between both data sets (smallest mean square error) is found using exponential fits. Depending on the selected region, an empirical function with a power slightly lower than five is estimated. This estimate is on the upper range of the power values suggested by Munich Re (2002) based on the evaluation of the December 1999 storms (4–5 power). Based on these loss functions, the average expected value of claims is obtained by integrating the normalized wind gust values above
one (i.e.>98th percentile) over the estimated losses. This value
is an approximation for the potential annual losses of an area relative to others, and is valid for the historical period.
4.2. Climate change signal based on ECHAM5 data In this section, we investigate possible changes of the local wind climatology over NRW under anthropogenic climate change us-ing ECHAM5 simulations for present (20C, 1960–2000) and future climate conditions (A1B and A2 scenarios, 2060–2100). First, the relative frequencies of the 55 clusters are determined for 20C ensemble runs, showing some biases in comparison
1The given number in excess of 20 000 is the sum of all postal code loss
values (either 864 or 438) multiplied by the number of historical storms (28) modelled with FOOT3DK.
Table 2. Relative frequencies for PSCs and SSCs for NCEP and ECHAM5 20C, A1B, and A2
Cluster NCEP 20C A1B A2
5 1.91 1.93 2.47 2.46 18 1.39 1.09 1.10 1.27 21 0.66 0.55 0.69 0.78 30 1.22 1.06 1.45 1.62 4 2.37 2.10 2.18 2.25 6 2.11 2.03 2.38 2.40 10 1.56 2.01 2.26 2.41 11 0.82 1.69 1.50 1.93 17 2.14 2.23 3.03 3.22 24 1.48 2.52 2.16 2.46 31 1.95 1.85 2.05 2.15 34 1.51 1.70 2.53 2.71 37 1.91 2.35 2.69 2.42 PSCs 5.17 4.63 5.71 6.13 SSCs 15.86 18.47 20.80 21.94 Others 78.97 76.90 73.49 71.93
Notes: The upper part shows the relative frequency of the four PSCs, the middle part the relative frequencies for SSCs. The aggregated frequencies for PSCs, SSCs, and others are given in the lower part of the table.
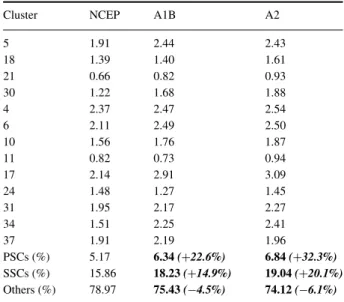
to the NCEP results (Table 2). To enable a better interpreta-tion of the climate signal, the A1B and A2 values are corrected using the ratio between the original 20C and the NCEP val-ues. Table 3 displays the corrected relative frequency of the PSCs and SSCs: the relative frequency of PSCs increases for the A1B (A2) scenario by 22.6% (32.3%). The frequency of PSC 21 and PSC 30 (which have a strong impact on extreme wind events over Western Germany; cf. L08, their fig. 6) is particu-larly enhanced. The alterations for PSCs and SSCs relative fre-quencies are statistically significant at the 99%-confidence level (Table 3).
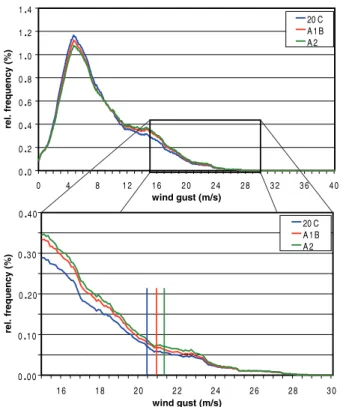
Local wind climatologies for the late 21st century are derived using the corrected relative frequencies (cf. Table 3). The present climate FOOT3DK simulations are used again (cf. Section 3). The enhanced number of storms per PSC identified for future climate conditions is also considered (cf. Appendix). However, final results with and without this correction are very similar. Figure 7 shows the modifications of the wind gust distribution for a selected single grid point as example: the blue line
cor-responds to the discrete distribution (in 0.1 m s−1intervals) for
present climate conditions, while the red (green) line indicates the changed distribution for A1B (A2) conditions. The inset of Fig. 7 focuses on the change of the tail end of the distributions, and the 98th wind gust percentiles are marked as vertical lines. The relative changes of the 98th wind gust percentiles are shown in Fig. 8 for all postal codes. Only small changes are detected
(typically below 0.5 m s−1) for the A1B scenario, while they
reach 5–6% for the A2 scenario (roughly 1 m s−1). Accordingly,
Table 3. Corrected frequencies for PSCs and SSCs for NCEP and ECHAM5 A1B and A2
Cluster NCEP A1B A2
5 1.91 2.44 2.43 18 1.39 1.40 1.61 21 0.66 0.82 0.93 30 1.22 1.68 1.88 4 2.37 2.47 2.54 6 2.11 2.49 2.50 10 1.56 1.76 1.87 11 0.82 0.73 0.94 17 2.14 2.91 3.09 24 1.48 1.27 1.45 31 1.95 2.17 2.27 34 1.51 2.25 2.41 37 1.91 2.19 1.96 PSCs (%) 5.17 6.34(+22.6%) 6.84(+32.3%) SSCs (%) 15.86 18.23(+14.9%) 19.04(+20.1%) Others (%) 78.97 75.43(−4.5%) 74.12(−6.1%)
Notes: The upper part shows the relative frequency of the four PSCs, the middle part the relative frequencies for SSCs. The aggregated frequencies for PSCs, SSCs and others are given in the lower part of the table. For A1B and A2, the relative frequency change relative to NCEP is given in %. Significant differences at 99% confidence level are in bold, t-test on winter basis.
changes are statistically significant (99% confidence level) for almost all (few) individual postal codes for the A2 scenario (A1B-scenario) (significance not shown).
Based on these results, possible alterations in expected loss potentials are assessed. We focus on the hypothesis that no changes in construction robustness to resist wind storms will occur in future decades (‘no adaptation’; cf. Pinto et al., 2007a, their section 6). The average expected value of claims for the 2060–2100 period is obtained using the wind gust distributions for A1B and A2 and integrating them using the empirical loss function (cf. Section 4.1). Finally, the difference to present con-ditions is taken. The data are analysed for subregions of NRW (typically with about 100 postal codes) to guarantee a sufficiently large sample. A statistically significant increase of annual
av-erage loss for NRW by+8% (A1B-scenario) and+19%
(A2-scenario) is estimated for NRW (2060–2100 versus 1960–2000). However, and similar to the pattern shown in Fig. 8, there are strong regional differences: changes in annual average loss
es-timates range from+5–6% over western NRW to+36% over
M¨unsterlandandOstwestfalen.
4.3. Relevance of individual events to climate change signal
While seeking reinsurance cover for natural catastrophes, an in-surance company mainly has one fundamental scenario in mind:
0
.
0 0.
2 0.
4 0.
6 0.
8 1.
0 1.
2 1.
4 0 4 8 1 2 1 6 2 0 2 4 2 8 3 2 3 6 4 0 wind gust (m/s) rel. f requ e nc y ( % ) 20 C A 1 B A 2 0.
0 0 0.
1 0 0.
2 0 0.
3 0 0.
4 0 1 6 1 8 2 0 2 2 2 4 2 6 2 8 3 0 wind gust (m/s) rel. f requ e nc y ( % ) 20 C A 1 B A 2Fig. 7.Example of wind gust distributions for station Exter (postal code 32602) for present and future climate conditions. The wind gust distributions shown as relative frequency (ordinate%) versus wind gust value (abscissa, m s−1). Only running means are shows. Blue: 20C/NCEP; red: A1B; green: A2. The inset below shows a zoom of the upper tail of the distribution. The 98th percentiles values for each curve are marked with vertical lines.
a single event (e.g. a severe windstorm like Kyrill in 2007) may cause enormous damage and may destroy a significant part of the total sum insured. Reinsurance companies offer a special contract type to cover this scenario. A Catastrophe Excess of Loss (Cat-XL) protects the insurer’s portfolio against the part of the event loss which exceeds a certain amount that is arranged in the contract (e.g. Liebwein, 2000). Such contracts are typically renewed each calendar year. Hence, one extreme event may have a huge impact in the annual balance of an insurance company. In
order to obtain some additional information on these important aspects, we investigate the contribution of single events to an-nual losses for Germany. This approach (following Klawa and Ulbrich, 2003) also considers wind (gust) exceedance of the local 98th percentile, but unlike the empirical approach used
in the previous sections, assumes a third power function (V3).
This choice of power is motivated by the physical evidence that the cube of wind speed is proportional to the advection of ki-netic energy (e.g. as used for wind energy purposes). Here, raw damage data for individual storms is analysed (cf. Pinto et al. 2007a, their section 3.1.). Due to the low resolution of the GCM, which includes only one grid point over NRW, considerations are done for a larger area which includes the whole of Germany. As NRW is one of the regions in Germany mostly affected by winter storms, and the large majority of storms hitting Germany also affect NRW (cf. Deutsche R¨uck, 2005), changes of similar sign and relative intensity may be expected for Germany and NRW. These facts enable a qualitative comparison between both approaches.
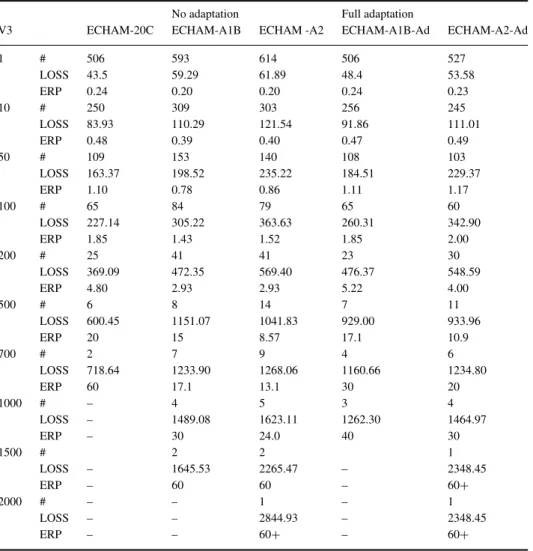
Results of the number of events and their average raw damage (LOSS) are shown in Table 4. The data is shown for selected raw damage thresholds and reveals a significant increase in the frequency of most extreme storms for future climate conditions (Table 4, columns A1B, A2). In particular, largest changes are obtained for storms which affect larger areas, and for which a higher intensity in terms of vorticity and ‘raw damage’ may be assumed (cf. Table 6). Furthermore, there is a number of GCM storms with intensities not found under present climate condi-tions (raw damage above 1000, on lower part of Table 4). For each threshold, a rough estimate of the return period (ERP in Table 4) for storms of this magnitude is given to obtain a hint at possible changes of return periods of storms of different inten-sities. This value is determined by simply dividing the number of years (120, as we have three ensemble members comprising 40 yr) by the number of events (for each threshold). This ap-proach is simple in comparison to others using extreme value statistics (e.g. Della-Marta et al., 2009). Hence, our estimated return period for rare events (lower half of the table) must be understood as an ‘indicative’ measure only and should thus be regarded with caution. Our estimated changes in return period
-2 -1 0 +1 +2 +3 +4 +5 (%)
(a)
(b)
Fig. 8. Changes of 98th wind gust percentile for future climate conditions versus present climate conditions based on transient ECHAM5 simulations. (a) SRES scenario A1B minus 20C. (b) SRES scenario A2 minus 20C. Relative changes are given in%. Data are presented for postal codes (864 in total). Reference periods are 1960–2000 (20C) and 2060–2100 (A1B, A2).
Table 4. Raw damage statistics for ECHAM5 20C, A1B and A2
No adaptation Full adaptation
V3 ECHAM-20C ECHAM-A1B ECHAM -A2 ECHAM-A1B-Ad ECHAM-A2-Ad
1 # 506 593 614 506 527 LOSS 43.5 59.29 61.89 48.4 53.58 ERP 0.24 0.20 0.20 0.24 0.23 10 # 250 309 303 256 245 LOSS 83.93 110.29 121.54 91.86 111.01 ERP 0.48 0.39 0.40 0.47 0.49 50 # 109 153 140 108 103 LOSS 163.37 198.52 235.22 184.51 229.37 ERP 1.10 0.78 0.86 1.11 1.17 100 # 65 84 79 65 60 LOSS 227.14 305.22 363.63 260.31 342.90 ERP 1.85 1.43 1.52 1.85 2.00 200 # 25 41 41 23 30 LOSS 369.09 472.35 569.40 476.37 548.59 ERP 4.80 2.93 2.93 5.22 4.00 500 # 6 8 14 7 11 LOSS 600.45 1151.07 1041.83 929.00 933.96 ERP 20 15 8.57 17.1 10.9 700 # 2 7 9 4 6 LOSS 718.64 1233.90 1268.06 1160.66 1234.80 ERP 60 17.1 13.1 30 20 1000 # – 4 5 3 4 LOSS – 1489.08 1623.11 1262.30 1464.97 ERP – 30 24.0 40 30 1500 # 2 2 1 LOSS – 1645.53 2265.47 – 2348.45 ERP – 60 60 – 60+ 2000 # – – 1 – 1 LOSS – – 2844.93 – 2348.45 ERP – – 60+ – 60+
Notes: For thresholds defined based on a minimum raw damage (left-hand column), average number (#, upper row), and average raw damage (LOSS, middle row) of single damage events are shown. The estimated return periods (ERP) are given in the lower row for each threshold. Reference periods are 1960–2000 (20C) and 2060–2100 (A1B, A2). Columns A1B and A2 correspond to data considering no adaptation to climate change, columns A1B-Ad and A2-Ad considering full adaptation.
(Table 4) show a clear tendency towards a shortening of return periods of wind storms under changed climate conditions. In par-ticular, loss expectations for storms with return periods above 20 yr may increase by a factor of 2 (cf. lower half of Table 4).
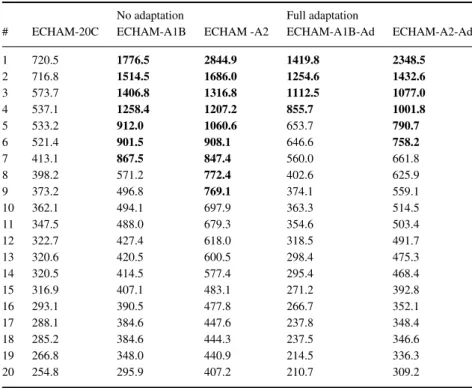
An alternative measure for quantifying possible changes in extreme events is using a rank statistical approach. This method compares the relative ranking of events (i.e. position in terms of magnitude) between different data sets and is very robust as there is no need of any assumptions regarding data distribution (unlike extreme value statistics). In our case, we analyse changes of ranking between the different time periods. Results show clear ranking modifications between future and present climate conditions: a rank 1 event (the highest raw damage value) for 20C is only rank 8 for A1B and rank 10 for A2 (cf. Table 5). Even if the statistics with full adaptation (i.e. all buildings are
renewed in order to withstand future wind climate; cf. Pinto et al., 2007a; their section 6) are considered, a rank 1 event for present climate conditions becomes rank 5 for A1B and rank 7 for A2 (both 2060–2100). Even for full adaptation, results still show a significant increase in average cost per storm, while the changes in the number of events (and hence the shortening of the return periods) is only detectable above the 200 raw damage threshold (Table 4, rows 4–5).
5. Discussion and conclusions
The present work documents the development and application of a statistical–dynamical regionalization approach to infer possi-ble changes in wind storm impacts for future decades. Our anal-ysis identifies increased values of upper wind percentiles over
Table 5. Rank statistics for raw damage events for ECHAM5 20C, A1B and A2 No adaptation Full adaptation
# ECHAM-20C ECHAM-A1B ECHAM -A2 ECHAM-A1B-Ad ECHAM-A2-Ad 1 720.5 1776.5 2844.9 1419.8 2348.5 2 716.8 1514.5 1686.0 1254.6 1432.6 3 573.7 1406.8 1316.8 1112.5 1077.0 4 537.1 1258.4 1207.2 855.7 1001.8 5 533.2 912.0 1060.6 653.7 790.7 6 521.4 901.5 908.1 646.6 758.2 7 413.1 867.5 847.4 560.0 661.8 8 398.2 571.2 772.4 402.6 625.9 9 373.2 496.8 769.1 374.1 559.1 10 362.1 494.1 697.9 363.3 514.5 11 347.5 488.0 679.3 354.6 503.4 12 322.7 427.4 618.0 318.5 491.7 13 320.6 420.5 600.5 298.4 475.3 14 320.5 414.5 577.4 295.4 468.4 15 316.9 407.1 483.1 271.2 392.8 16 293.1 390.5 477.8 266.7 352.1 17 288.1 384.6 447.6 237.8 348.4 18 285.2 384.6 444.3 237.5 346.6 19 266.8 348.0 440.9 214.5 336.3 20 254.8 295.9 407.2 210.7 309.2
Notes: Listed are the raw damage values for the top 20 events for each data set. Reference periods are 1960–2000 (20C) and 2060–2100 (A1B, A2). Columns A1B and A2 correspond to data considering no adaptation to climate change, columns A1B-Ad and A2-Ad considering full adaptation. For all A1B and A2 columns, values larger than rank 1 for 20C (720,5) are in bold. Western Germany using transient ECHAM5 ensemble
simula-tions and FOOT3DK for dynamical downscaling. In particular, largest 98th wind gust percentile changes are observed for north
and north-eastern NRW (up to 1 m s−1 for the A2 scenario,
which corresponds to around+5%), while alterations are
com-paratively small in the southwest. The resulting increase in
an-nual average losses for NRW are+8% (A1B) and+19% (A2),
respectively. In regional terms, the largest changes in insured losses are again found for north and northeastern NRW, where the annual average losses may increase by up to 36%. Addition-ally, we have identified an increased number of events affecting Germany for future climate conditions. Considering only storms with return periods above 20 yr, loss expectations may increase by a factor of 2. Accordingly, shifts in the storm ranking be-tween present and future climate conditions are identified. This analysis gives evidence of a significant change in the frequency and intensity of storms over Germany in future decades.
These results are consistent with, e.g. Bengtsson et al. (2006) and Pinto et al. (2009b), who identified an increased number of extreme cyclones moving over the British Isles and the North Sea (hence directly affecting Western Germany) in ECHAM5 sim-ulations. For this area and the same GCM simulations, Della-Marta and Pinto (2009) identified significantly shorter return periods of intense storms at the end of the 21st century (us-ing the Laplacian of mean sea level pressure as a measure of
cyclone intensity), which agrees with the increase of loss ex-pectations estimated in the present study. Estimated changes in terms of wind gusts and average losses obtained in the present study are consistent with results using the direct ECHAM5 out-put (Pinto et al., 2007a), even though our changes of upper wind percentiles are typically weaker. Our results agree better with Fink et al. (2009), who estimate changes in extreme wind gusts using RCM simulations driven with ECHAM5 boundary condi-tions (cf. their fig. 10). The differences to both previous studies may be attributed to different methodologies applied.
The developed methodology is easily applicable to other nearby regions. While the statistical part of the methodology will remain unchanged (clusters are valid for western and cen-tral Europe as a whole), RCM simulations for new domains (e.g. entire Germany) will be necessary to dynamically downscale the wind finger prints. Hence, the proposed statistical–dynamical approach may be potentially used in a much wider scope, which would help to assess uncertainties, and presents a valid alterna-tive to pure dynamical or pure statistical approaches for climate change studies (e.g. Beersma and Buishand, 2003; Jacob et al., 2007).
Focussing on climate change, our analysis of ECHAM5 sce-narios reveals an increased number of storms within the PSCs for the end of the 21st century. This result suggests further investigations focussing on how the frequency of wind storms,
cyclone frequencies, intensities, and associated mean sea level pressure gradients may change within each of the PSCs and SSCs. While previous studies point to significant changes in these variables due to climate change (e.g. Leckebusch et al., 2006; Pinto et al., 2007b; Fink et al., 2009), it is necessary to analyse which (and to what extend) weather developments (particularly the PSCs) are affected, thus providing a better es-timation of wind changes on a regional scale.
6. Acknowledgments
This work was partially funded by the German Research Foundation (DFG) within the Collaborative Research Cen-tre 419 (SFB 419): Environmental Problems of an Industrial Conurbation–scientific solution strategies and socioeconomic
implications. We are thankful toWestf¨alische Provinzial AGand
Deutsche R¨uckversicherung AG, particularly to Elke Freund and Thomas Axer, for providing us with high resolution loss data, suggestions and discussions. Additional data was provided by Provinzial Rheinland AG. JGP thanks Manuel Prechtl, Thomas Bistry, Andreas Reiner, Eberhard Faust and Nina Gerresheim for many interesting discussions over the years.
The reanalysis data was obtained from the European Cen-tre for Medium Range Weather Forecast (ECMWF) and the National Centers for Enviromental Prediction (NCEP). We thank the German Weather Service for synoptic data, the MPI for Meteorology (Hamburg, Germany) for support and ECHAM5 data, and the DKRZ/WDCC (Hamburg, Germany) and the ZAIK/RRZK (Cologne, Germany) for computing resources. We thank Prof. Peter Speth, Andreas Kr¨uger and Kai Born for many discussions. We are grateful to Lars Kirchh¨ubel, Melanie Karre-mann and Luise Fr¨ohlich for help in the preparation of some fig-ures and tables. We thank Christoph Raible and two anonymous reviewers for their detailed comments that helped to improve the manuscript.
7. Appendix: analysis of storm changes for PSCs
Previous results by the authors have shown that annual loss (and particularly its standard deviation) may significantly increase during the 21st century (e.g. Pinto et al., 2007a) due to an en-hanced frequency of extreme cyclones affecting Europe (e.g. Pinto et al., 2007b; Della-Marta and Pinto, 2009). Here, we have analysed if the number of wind storms within the PSCs remains unchanged (or not) under future climate conditions. Only storms leading to exceedance of the 98th percentile over a large area of Germany are considered. Thresholds of 6, 9 and 13 affected grid points are chosen, corresponding roughly to 35, 53 and 65% of the surface of Germany (17 grid points in total). Results show that the number of wind storms per PSC increases with a larger magnitude (Table 6) than the relative frequency of the PSCs themselves (cf. Table 2). This is particularly clear for the larger storms affecting at least half of Germany (9 and 11 gridTable 6. Total number of storms for ECHAM5 20C, A1B and A2 Storm Cluster 20C [N] A1B-20C [%] A2–20C [%] 1/3 05 47 +93.6 +57.4 (6 GP) 18 40 +15.0 −22.5 21 26 +100.0 +15.4 30 27 +77.8 +100.0 Sum 140 +69.29 +35.0 1/2 05 24 +141.7 +62.5 (9 GP) 18 21 +38.1 0.0 21 13 +176.9 +46.2 30 19 +42.1 +94.8 Sum 77 +94.8 +50.7 2/3 05 13 +176.9 +76.9 (11 GP) 18 15 +20.0 −26.7 21 9 +144.4 +44.4 30 12 +58.3 +100.0 Sum 49 +93.9 +44.9
Notes: Total number of storms for 20C (in GCM 120 yr) and relative changes (%) for A1B-20C and A2–20C are given for each PSC (5, 18, 21, 30). Values are listed for different thresholds based on the extension of the affected area over Germany: 1/3 at least 6 grid points; 1/2 at least 9 grid points; 2/3 at least 11 grid points (total number is 17). Sums of all four PSCs are given in bold.
points), and for PSC 5 and 21. Typically, such storms are also more intense (using the Laplacian of mean sea level pressure as measure, an approximation of relative geostrophic vorticity; cf. Murray and Simmonds, 1991; Pinto et al., 2005), as verified by analyzing the associated cyclone track data (not shown). This is a clear evidence that the frequency of large/intense storms within the PSCs does change for future climate conditions. This effect is taken into account by adjusting the weights of the FOOT3DK simulations when computing the regional climatology for future climate conditions. The effects of this correction for the clima-tology (in particular for 98th percentile) and in terms of climate change impacts are quite small. The possibility to consider such aspects is one of the advantages of statistical–dynamical meth-ods compared to purely dynamical approaches.
References
Beersma, J. and Buishand, T. 2003. Multi-site simulation of daily pre-cipitation and temperature conditional on the atmospheric circulation.
Climate Res.25, 121–133.
Bengtsson, L., Hodges, K. I. and Roeckner, E. 2006. Storm tracks and climate change.J. Climate19, 3518–3543.
Beniston, M., Stephenson, D. B., Christensen, O. B., Ferro, C. A. T., Frei, C. and co-authors. 2007. Future extreme events in European climate: an exploration of regional climate model projections.Clim. Change81, 71–95.
Brasseur, O. 2001. Development and application of a physical approach to estimating wind gusts.Mon. Wea. Rev.129, 5–25.
Br¨ucher, W., Kessler, C., Kerschgens, M. and Ebel, A. 2001. Simulation of traffic-induced air pollution on regional to local scales.Atmos. Environ.34, 4675–4681.
Christensen, J. H., Hewitson, B., Busuioc, A., Chen, A., Gao, X. and co-authors. 2007. Regional Climate Projections. In:Climate Change 2007: The Physical Science Basis. Contribution of Working Group I to the Fourth Assessment Report of the Intergovernmental Panel on Climate Change(eds S. Solomon, D. Qin, M. Manning, Z. Chen, M. Marquis, K. B. Averyt, M. Tignor and H. L. Miller). Cambridge University Press, Cambridge, United Kingdom and New York, NY, USA, pp. 847–940.
Della-Marta, P. M., Mathis, H., Frei, C., Liniger, M. A., Kleinn, J. and co-authors. 2009. The return period of wind storms over Europe.Int. J. Climatol.29, 437–459.
Della-Marta, P. M. and Pinto, J. G. 2009. Statistical uncertainty of changes in winter storms over the North Atlantic and Europe in an ensemble of transient climate simulations.Geophys. Res. Lett.36, L14703, doi:10.1029/2009GL038557.
Deutsche R¨uck. 2005.Sturmdokumentation 1997–2004, Publication of the Deutsche R¨uck Reinsurance Company. D¨usseldorf, 180 pp. (in German, www.deutsche-rueck.de).
Europ¨aischer Wetterbericht. 1999. published by the German Weather Service (Deutscher Wetterdienst; http://www.digento.de/ titel/105694.html)
Fink, A. H., Br¨ucher, T., Ermert, E., Kr¨uger, A. and Pinto, J. G. 2009. The European Storm Kyrill in January 2007: synoptic evolution and considerations with respect to climate change.Nat. Hazards Earth Syst. Sci.9, 405–423.
Fuentes, U. and Heimann D. 2000. An improved statistical dynamical downscaling scheme and its application to the Alpine precipitation climatology.Theor. Appl. Climatol.65, 119–135.
Goyette, S., Brasseur, O. and Beniston, M. 2003. Application of a new wind gust parameterisation: multiple scale studies performed with the Canadian regional climate model.J. Geophys. Res.108(D13), 4374, doi:10.1029/2002JD002646.
Hartigan, J. A. and Wong, M. A. 1979. A K-means clustering algorithm.
Appl. Stat.28, 100–108.
Heinemann, G. and Kerschgens, M. 2005. Comparison of methods for area-averaging surface energy fluxes using high-resolution non-hydrostatic simulations.Int. J. Climatol.25, 153–167.
Jacob, D., B¨aring, L., Christensen, O. B., Christensen, J. H., de Castro, M. and co-authors. 2007. An inter-comparison of regional climate models for Europe: model performance in present-day climate.Clim. Change81, 31–52.
Jungclaus, J. H., Botzet, M., Haak, H., Keenlyside, N., Luo, J. J. and co-authors. 2005. Ocean circulation and tropical variability in the coupled model ECHAM5/MPI-OM.J. Climate19, 3952–3972. Kistler, R., Kalnay, E., Collins, W., Saha, S., Woollen, J. and co-authors.
2001. The NCEP/NCAR 50-year reanalysis: monthly-means CD-ROM and documentation.Bull. Am. Meteor. Soc.82, 247–267. Klawa, M. and Ulbrich, U. 2003. A model for the estimation of storm
losses and the identification of severe winter storms in Germany.Nat. Hazards Earth Syst. Sci.3, 725–732.
Lambert, S. J. and Fyfe, J. C. 2006. Changes in winter cyclone fre-quencies and strengths simulated in enhanced greenhouse warming experiments: results from the models participating in the IPCC diag-nostic exercise.Clim. Dyn.26, 713–728.
Leckebusch, G. C., Koffi, B., Ulbrich, U., Pinto, J. G., Spangehl, T. and Zacharias, S. 2006. Analysis of frequency and intensity of winter storm events in Europe on synoptic and regional scales from a multi-model perspective.Clim. Res.31, 59–74.
Leckebusch, G. C., Ulbrich, U., Fr¨ohlich, E. L. and Pinto, J. G. 2007. Property loss potentials for European mid-latitude storms in a changing climate.Geophys. Res. Lett.34, L05703, doi:10.1029/ 2006GL027663.
Leckebusch, G. C., Weimer, A., Pinto, J. G., Reyers, M. and Speth, P. 2008. Extreme wind storms over Europe in present and future climate: a cluster analysis approach.Meteorol. Z.17, 67–82.
Liebwein, P. 2000. Klassische und moderne Formen der R¨uckversicherung. Verlag Versicherungswirtschaft. Karlsruhe ISBN-13: 978-3884877944 (in German)
Meehl, G. A., Stocker, T. F., Collins, W. D., Friedlingstein, P., Gaye, A. T. and co-authors. 2007. Global Climate Projections. In:Climate Change 2007: The Physical Science Basis. Contribution of Working Group I to the Fourth Assessment Report of the Intergovernmental Panel on Climate Change(eds S. Solomon, D. Qin, M. Manning, Z. Chen, M. Marquis, K. B. Averyt, M. Tignor and H. L. Miller). Cambridge University Press, Cambridge, United Kingdom and New York, NY, USA, pp. 747–845.
Munich Re 2002. Winterstorms in Europe (III), Analysis of loss poten-tials. Publication of the Munich Re, Order Number: 302-03109 (in English, www.munichre.com).
Murray, R. J. and Simmonds, I. 1991. A numerical scheme for tracking cyclone centres from digital data. Part I: develop-ment and operation of the scheme. Aust. Meteorol. Mag. 39, 155–166.
Naki´cenovi´c, N., Alcamo, J., Davis, G., de Vries, B., Fenhann, J. and co-authors. 2000.IPCC Special Report on Emissions Scenarios. Cam-bridge University Press, CamCam-bridge, United Kingdom and New York, NY, USA, 599 pp.
Pinto, J. G., Spangehl, T., Ulbrich, U. and Speth, P. 2005. Sensitivities of a cyclone detection and tracking algorithm: individual tracks and climatology.Meteorol. Z.14, 823–838.
Pinto, J. G., Fr¨ohlich, E. L., Leckebusch, G. C. and Ulbrich, U. 2007a. Changes in storm loss potentials over Europe under modified climate conditions in an ensemble of simulations of ECHAM5/MPI-OM1.
Nat Hazards Earth Syst Sci7, 165–175.
Pinto, J. G., Ulbrich, U., Leckebusch, G. C., Spangehl, T., Reyers M. and Zacharias, S. 2007b. Changes in storm track and cyclone activity in three SRES ensemble experiments with the ECHAM5/MPI-OM1 GCM.Clim. Dyn.29, 195–210.
Pinto, J. G., Freund, E. and Axer, E. 2008. Nordrhein-Westfalen: St¨urme nehmen stark zu.Versicherungswirtschaft63, 106–109 (in German, www.vvw.de).
Pinto, J. G., Neuhaus, C. P., Kr¨uger, A. and Kerschgens, M. 2009a. Assessment of the wind gust estimates method in mesoscale mod-elling of storm events over West Germany. Meteorol. Z. 18, 495–506.
Pinto, J. G., Zacharias, S., Fink, A. H., Leckebusch, G. C. and Ulbrich, U. 2009b. Factors contributing to the development of extreme North Atlantic cyclones and their relationship with the NAO.Clim. Dyn.32, 711–737.
Preisendorfer, R. W., 1988.Principal Component Analysis in Meteorol-ogy and Oceanography. Elsvier, Amsterdam, 425 pp.
Raible, C. C. 2007. On the relation between extremes of midlatitude cyclones and the atmospheric circulation using ERA40.Geophys. Res. Lett.34, L07703. doi:10.1029/2006GL029084
Raible, C. C., Della-Marta, P. M., Schwierz, C., Wernli, H. and Blender, R. 2008. Northern Hemisphere extratropical cyclones: a comparison of detection and tracking methods and different reanalyses.Mon. Wea. Rev.136, 880–897.
Roeckner, E., Brokopf, R., Esch, M., Giorgetta, M., Hagemann, S. and co-authors. 2006. Sensitivity of simulated climate to horizontal and vertical resolution in the ECHAM5 atmosphere model.J. Clim.19, 3771–3791.
Shao, Y., Sogalla, M., Kerschgens, M. and Br¨ucher, W. 2001. Effects of land-surface heterogeneity upon surface fluxes and turbulent condi-tions.Meteorol. Atmos. Phys.78, 157–181.
Sogalla, M., Kr¨uger, A. and Kerschgens, M. 2006. Mesoscale modelling of interactions between rainfall and the land surface in West Africa.
Meteorol. Atmos. Phys.91, 211–221.
Stephenson, D. B., Pavan, V., Collins, M., Junge, M. M., Quadrelli, R. and co-authors. 2006. North Atlantic Oscillation response to tran-sient greenhouse gas forcing and the impact on European winter climate: a CMIP2 multi-model assessment. Clim. Dyn. 27, 401– 420
SwissRe. 2008.Natur- und Man-made-Katastrophen im Jahr 2007: hohe Sch¨aden in Europa. Sigma, Nr. 1/2008, Swiss Re publishing, Z¨urich (in German, http://www.swissre.com).
Ulbrich, U., Fink, A. H., Klawa, M. and Pinto, J. G. 2001. Three extreme storms over Europe in December 1999.Weather 56, 70– 80.
Ulbrich, U., Leckebusch, G. C. and Pinto, J. G. 2009. Cyclones in the present and future climate: a review.Theor. Appl. Climatol.96, 117–131.
Uppala, S. M., Kallberg, P., Hernandez, A., Saarinen, S., Fiorino, M. and co-authors. 2005. The ERA-40 Reanalysis.Quart. J. Roy. Meteor. Soc.