STRADITIZE
Digitizing pollen diagrams and more
Installation
Author
Motivation
Demo
How to navigate
This presentation has been prepared for a PICO presentation at the EGU 2018 in Vienna, Austria. To facilitate the navigation, a lot of
hyperlinks are used. Almost every item in this presentation is clickable: click buttons like this to be linked to other connected frames
click the navigation bar above with the sections, Home, Help, About, etc. (including the dots) to navigate in the presentation
click on navigation buttons like this
<
1/2
>
to show you more of the current frame.click on many of the images to get more information or a close-up
click the or the icon to go back to the menu
click the buttons at the lower left and lower right that bring you to the next slide
How to navigate
This presentation has been prepared for a PICO presentation at the EGU 2018 in Vienna, Austria. To facilitate the navigation, a lot of
hyperlinks are used. Almost every item in this presentation is clickable: click buttons like this to be linked to other connected frames
click the navigation bar above with the sections, Home, Help, About, etc. (including the dots) to navigate in the presentation
click on navigation buttons like this
<
2/2
>
to show you more of the current frame. For example this text.click on many of the images to get more information or a close-up
click the or the icon to go back to the menu
click the buttons at the lower left and lower right that bring you to the next slide
STRADITIZE
An open-source program for digitizing pollen
diagrams and other types of stratigraphic data
Vienna, Austria, April 10th, 2018
Philipp Sommer, Basil A.S. Davis and Manuel Chevalier
Davis Group, Institute of Earth Surface Dynamics (IDYST) University of Lausanne
Author
Author
Philipp Sommer
Institute of Surface Dynamics (IDYST) University of Lausanne (UNIL)
B ˆatiment G ´eopolis - Room 4413 CH - 1015 Lausanne
E-mail philipp.sommer@unil.ch
Telefon +41 21 692 35 40
Github https://github.com/Chilipp/
Webpage https://wp.unil.ch/davisgroup/philipp-sommer/
Acknowledgments
Dr. Basil Davis, palaeoclimatologist
Prof. Jed Kaplan, geographer, climate
modeler, ...
Manuel Chevalier, palaeoclimatologist
Shawn Koppenh ¨ofer, informatician Andrea Kay, archaeologist Leanne Phelps, human ecologist Olivier Cartapanis
⇐
Author
Abstract
⇒
Abstract
In an age of digital data analysis, gaining access to data from the pre-digital era – or any data that is only available as a figure on a page – remains a problem and an under-utilized scientific resource. Whilst there are numerous programs available that allow the digitization of scientific data in a simple x-y graph format, we know of no semi-automated program that can deal with data plotted with multiple horizontal axes that share the same vertical axis, such as pollen diagrams and other stratigraphic figures that are common in the Earth sciences. STRADITIZE (Stratigraphic Diagram Digitizer) is a new open-source program that allows stratigraphic figures to be digitized in a single semi-automated operation. It is designed to detect multiple plots of variables analyzed along the same vertical axis, whether this is a sediment core or any similar depth/time series.
The program is written in python and supports mixtures of many different diagram types, such as bar plots, line plots, as well as shaded, stacked, and filled area plots. The package provides an extensively documented graphical user interface for a point-and-click handling of the semi-automatic process, but can also be scripted or used from the command line. Other features of STRADITIZE include text recognition to interpret the names of the different plotted variables, the automatic and semi-automatic recognition of picture artifacts, as well an automatic measurement finder to exactly reproduce the data that has been used to create the diagram. Evaluation of the program has been undertaken comparing the digitization of published figures with the original digital data. This generally shows very good results, although this is inevitably reliant on the quality and resolution of the original figure.
Motivation
http://www.neotomadb.org,http://www.europeanpollendatabase.net
Large-scale climate
reconstructions
Global Pollen databases make large scale climate
reconstructions possible
But they lack of old publications from the 20th century whose data has never been published
Motivation
Idea behind straditize
Use unpublished datasets, digitized from the published pollen diagram to fill the gaps.
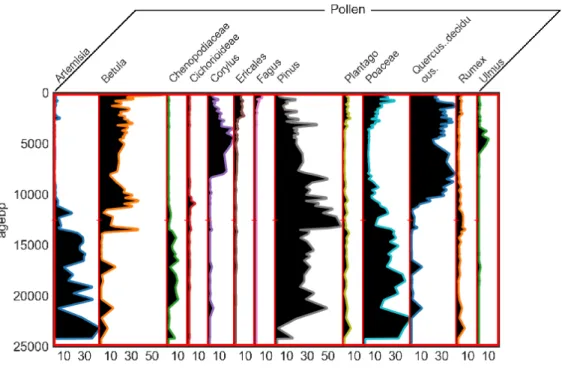
Pollen Diagrams:
One column per pollen taxa
All share one axis, e.g. time or depth
Challenges
different kinds of pollen
diagrams (bar plots, area plots, line plots, mixed plots, . . . )
<
1/3
>
(Y ao et al., 2017)Motivation
Challenges
different kinds of pollen
diagrams (bar plots, area plots, line plots, mixed plots, . . . )
bad quality of (old) diagrams
<
2/3
>
Challenges
different kinds of pollen
diagrams (bar plots, area plots, line plots, mixed plots, . . . )
bad quality of (old) diagrams many unimportant features, such as exaggerations, letters, horizontal lines, etc.
<
3/3
>
Installation
Installation
The package is written in Python and hosted on Github:
https://github.com/Chilipp/straditize
and can be installed
1 from source:
git c l o n e h t t p s :// g i t h u b . com / C h i l i p p / s t r a d i t i z e . git cd s t r a d i t i z e
p y t h o n s e t u p . py i n s t a l l
2 using pip (https://pypi.org/)
pip i n s t a l l s t r a d i t i z e
3 or using anaconda (https://anaconda.org/chilipp)
c o n d a i n s t a l l - c c h i l i p p s t r a d i t i z e
More installation methods will be provided soon.
Dependencies
The python package depends on different libraries
numpy and scipy: numeric python libraries (Jones et al., 2001)
matplotlib: python visualization package (Hunter, 2007)
psyplot: interactive visualization framework (Sommer, 2017a)
scikit-image: image processing package for python (van der Walt et al., 2014)
Pillow: The image handling library (Clark et al., 2016)
The graphical user interface is based on the psyplot-gui package
(Sommer, 2017b) which is programmed using the Qt bindings of PyQt (Summerfield, 2007).
Home Help About Abstract Motivation Install Demo
Demo
Demo
1 Load the picture. +
2 Select the diagram part. + 3 Convert to binary image. +
Automatically separate the columns.
5 Automatically digitize the full data. +
6 Edit the measurements. +
<
1/6
>
Home Help About Abstract Motivation Install Demo
Demo
Demo
1 Load the picture. +
2 Select the diagram part. +
3 Convert to binary image. + 6 Edit the measurements. +
<
2/6
>
Home Help About Abstract Motivation Install Demo
Demo
Demo
1 Load the picture. +
2 Select the diagram part. + 3 Convert to binary image. +
Automatically separate the columns.
5 Automatically digitize the full data. +
6 Edit the measurements. +
<
3/6
>
Home Help About Abstract Motivation Install Demo
Demo
Demo
1 Load the picture. +
2 Select the diagram part. + 3 Convert to binary image. +
4 Automatically separate the columns. +
<
4/6
>
Home Help About Abstract Motivation Install Demo
Demo
Demo
1 Load the picture. +
2 Select the diagram part. + 3 Convert to binary image. +
4 Automatically separate the columns. + 5 Automatically digitize the full data. +
Edit the measurements.
<
5/6
>
Demo
1 Load the picture. +
2 Select the diagram part. + 3 Convert to binary image. +
4 Automatically separate the columns. + 5 Automatically digitize the full data. +
6 Edit the measurements. +
<
6/6
>
Demo
Supported picture types
Straditize uses Pillow (Clark et al., 2016) to read and write images. Internally these images are then converted to an RGBA mode.
Therefore all common image formats are supported, such as PNG, JPEG, TIFF, etc.
Back to demo
Home Help About Abstract Motivation Install Demo
Demo
The diagram part
<
1/3
>
Back to demoThe diagram part is the area where the data is shown without the axes and is selected by the user (red rectangle)
everything black
represents data
Based on this data, the column starts are
estimated
(automatically)
Home Help About Abstract Motivation Install Demo
Demo
The diagram part
<
2/3
>
Back to demoThe diagram part is the area where the data is shown without the axes and is selected by the user (red rectangle) It is converted to a binary image where everything black
represents data
Based on this data, the column starts are
estimated
(automatically)
The diagram part
<
3/3
>
Back to demoThe diagram part is the area where the data is shown without the axes and is selected by the user (red rectangle) It is converted to a binary image where everything black
represents data
Based on this data, the column starts are
estimated
(automatically)
Demo
Digitization
Back to demo
After having removed all features that do not
represent data, the data is digitized based on the
diagram type area/
line
take the last non-data point +
bars find distinct bars and manually split over-lapping bars +
stacked area
manually select the
features for each
column +
Digitization of an area or line plot diagram
This class of stratigraphic diagrams is the most popular within the pollen diagrams.
For the digitization, we use the distance of the most right data pixel to
the column start. Back to digitization
Home Help About Abstract Motivation Install Demo
Demo
Digitization of a bar diagram
⇒ ⇒ ⇒
Bars are distinguished automatically based on white space between the data and/or a drastic
increase
If the difference between overlapping bars is low, they are identified
automatically and can easily be splitted
manually
<
1/2
>
Back to digitizationDigitization of a bar diagram
⇒ ⇒ ⇒
Bars are distinguished automatically based on white space between the data and/or a drastic
increase
If the difference between overlapping bars is low, they are identified
automatically and can easily be splitted
manually
<
2/2
>
Back to digitizationDemo
Digitization of a stacked diagram
⇒
⇒
⇒
⇒
⇒
For digitizing a stacked area diagram, the user has to manually distinguish the columns. They can be selected by colors, patterns, connectivity or manually using a rectangle or polygon selector.
Back to digitization
Finding of measurements
Bac
k
to
demo
1 For each column (taxa) find the regions of potential extrema
(minimum or maximum, grey + signs)
2 Find the overlaps within the columns to estimate the exact position
of the measurements
References I
A. Clark, Hugo, A. Murray, A. Karpinsky, C. Gohlke, B. Crowell, D. Schmidt, A. Houghton, S. Johnson, and et al. Pillow: 3.1.0. Jan 2016. doi:
10.5281/zenodo.44297.
J. D. Hunter. Matplotlib: A 2d graphics environment.Computing in Science Engineering, 9(3):90–95, May 2007. ISSN 1521-9615. doi:
10.1109/MCSE.2007.55.
E. Jones, T. Oliphant, P. Peterson, et al. SciPy: Open source scientific tools for Python, 2001. URLhttp://www.scipy.org/. [Online; accessed 2017-02-18].
P. S. Sommer. The psyplot interactive visualization framework.The Journal of Open Source Software, 2(16), aug 2017a. doi: 10.21105/joss.00363. URL
https://doi.org/10.21105/joss.00363.
P. S. Sommer. Chilipp/psyplot-gui: v1.0.1: Graphical user interface for the psyplot package. Aug 2017b. doi:10.5281/zenodo.845726. URL
https://doi.org/10.5281/zenodo.845726.
M. Summerfield.Rapid GUI Programming with Python and Qt (Prentice Hall Open Source Software Development). Prentice Hall, 2007. ISBN 978-0132354189. URLhttps://www.amazon.com/Programming-Python-Prentice-Software-Development/dp/0132354187?SubscriptionId= 0JYN1NVW651KCA56C102&tag=techkie-20&linkCode=xm2&camp=2025&creative=165953&creativeASIN=0132354187.
S. van der Walt, J. L. Sch ¨onberger, J. Nunez-Iglesias, F. Boulogne, J. D. Warner, N. Yager, E. Gouillart, T. Yu, and the scikit-image contributors. scikit-image: image processing in Python.PeerJ, 2:e453, 6 2014. ISSN 2167-8359. doi:10.7717/peerj.453. URL
http://dx.doi.org/10.7717/peerj.453.
F. Yao, C. Ma, C. Zhu, J. Li, G. Chen, L. Tang, M. Huang, T. Jia, and J. Xu. Holocene climate change in the western part of taihu lake region, east china.
Palaeogeography, Palaeoclimatology, Palaeoecology, 485:963 – 973, 2017. ISSN 0031-0182. doi:https://doi.org/10.1016/j.palaeo.2017.08.022.
URLhttp://www.sciencedirect.com/science/article/pii/S0031018217301062.
G ´eopolis, Lausanne, Switzerland
Bac k to author pageInstitute of Surface Dynamics (IDYST) - University of Lausanne (UNIL) B ˆatiment G ´eopolis - CH - 1015 Lausanne