Important disclosures and certifications are contained from page 22 of this report.
We assign a BBB corporate credit rating to OBOS BBL, as well as A- and BBB to the secured and unsecured bonds, respectively.
OBOS BBL (OBOS/the company/the group) is the largest co-operative building association in the Nordics, owned entirely by its members. We analyse and describe OBOS on a group level in this report, unless noted otherwise. Since its inception in 1929, the group has acted as a prominent homebuilder in the Norwegian market. After serving mainly the municipality of Oslo for more than half a century, the company has expanded its business across s market position in Norway is 21% when the market share of BWG Homes AB is taken into consideration. Through this acquisition in 2014, OBOS has also gained an important footprint in the Swedish market. Being a co-operative building association, OBOS does not pay back to its members through dividends but rather through member-based advantages and corporate social responsibility projects. Internally generated profits are thus used to expand its business further and, consequently the acquisition activity in OBOS remains at a high level. The company is engaged in major long-term development projects, which will require substantial investments.
OBOS delivered all-time high financial results in 2015, clearly harvesting the fruits of its investments over the past years. Although the group operates across various industries, for instance through OBOS-banken, most of the segments are directly or indirectly affiliated to the core homebuilding business. OBOS aims to build up to 4,000 homes each c.400,000 members have a first priority right to buy any home built by the company. The commercial property segment is often engaged in the same projects as the homebuilding segment, as a significant amount of building complexes in the central areas are being built with commercial activities. The high activity in both homebuilding and commercial property is being facilitated by the benign real estate
mark -term perspective, it is able to
OBOS BBL traces its roots back to 1929, when the company was granted the role of building organ for the municipality of Oslo. The group has contributed greatly to urban planning in the capital by developing neighbourhoods in areas such as Ensjø, Sagene and Kværnerbyen, as well as satellite towns near the capital, such as Lambertseter. After the Norwegian housing market was deregulated in the 1980s, OBOS changed its role from being a local homebuilder to a competitive player in the Norwegian real estate market. The banking crisis of the early 1990s hampered the Norwegian housing market and, consequently, numerous building firms went bankrupt. OBOS and Selvaag were among the few building firms that avoided bankruptcy during this turbulent period. The subsequent period from 2000 until today has been fruitful, as the company has seen both organic growth and growth through acquisitions.
Over the past 85 years, the group has sealed its position as a well-recognised company with a highly solid reputation and we consider OBOS to be a quality brand. Today, the company consists of four main segments: homebuilding, property management and advisory, commercial property and banking, insurance and real estate agency (REA). Chart 1 summarises the organis
OBOS is the largest co-operative building association in the Nordic region, owned by its 393,923 members as of 31 December 2015. It is established in most parts of Norway, with its members scattered through almost all the municipalities. OBOS members have a seniority-based priority option to buy residential units built by the company. The company has grown substantially over the past few years, both organically and through various mergers and acquisitions. In 2014, OBOS gained almost 20,000 new members through its merger with StorBergen Boligbyggelag. The merger with Ålesund Boligbyggelag in 2015 added a further 5,924 members. The acquisition of the BWG Homes AB and Fornebulandet group serves as an example of how OBOS manifests its market position through strategically important acquisitions. BWG Homes is better known in Norway through its Block Watne entity, which typically builds small houses and apartments on the outskirt
394 370 339 323 303 260 0 50 100 150 200 250 300 350 400 450 2015 2014 2013 2012 2011 2010
We are confident that OBOS is in good shape to maintain and even increase the number of memberships. With solid annual growth in homebuilding, the company could attract new members through the main incentives embedded in the membership, namely the priority right to buy a property built and developed by OBOS. Currently, each member initially has to contribute NOK300 in capital injection, which comes in addition to a member fee of NOK200 per year.
at growth-related projects and corporate social engagements at the mem
amounting to NOK80m throughout 2015, should be channelled back to the members through various member advantages in the community.
Through the acquisition of BWG Homes, OBOS has established a strong and significant position as a homebuilder in Sweden through the well-known brands Kärnhem, Myresjöhus and SmålandsVillan. OBOS currently ranks as the industry leader when measured in amounts of properties under development.
Despite being a co-operative building association with origins in the Oslo area, OBOS has expanded substantially both geographically and operationally. Oslo and Akershus are still by far the largest geographical segments, with approximately two-thirds of members s footprint in Norway is now spread across several regions. That OBOS has also established a solid basis for its operations through its acquisition of BWG Homes has further credit positive implications for the company.
has been homebuilding. However, throughout its history, OBOS has expanded its operations widely by offering services affiliated closely to its main business, be it for instance property management and consulting, real estate agency, or banking services to households. All the various segments are operating as separate entities within the group, being either a subsidiary or an associated company of OBOS. Although OBOS offers a variety of services related to homebuilding, the operational diversification is not so strong, as all the affiliated segments are more or less economically interdependent. OBOS-banken can be viewed as the segment most distant from the core business, as the bank also provides loans to non-members. However, the bank accounted for only 1% of group revenues at the end of 2015
and around 77% do not
assign much weight to the diversification that OBOS-banken provides to the group.
Most also closely
related to the main homebuilding and commercial property business, such as the investments in AF Gruppen ASA and Veidekke ASA. In January 2016, OBOS also acquired 6.8% of the shares in Multiconsult ASA
players within project management and consulting on commercial property, construction and other infrastructure projects
the utility sector. Currently, OBOS has shares in 18 utility projects, totalling production of 390GWh. Through the subsidiary OBOS Energi, the company produces 32,5GWh each year.
construction, we do not deem the overall operational diversification as very strong.
13% 13% 11% 11% 11% 9% 9% 8% 8% 7% OBOS** Mesterhus Nordbohus Blink Hus Byggman Norgeshus Selvaag Bolig Systemhus Block Watne BoligPartner 64% 7% 6% 6% 5% 3% 1% 8% Oslo/akershus Innlandet Østfold Hordaland Vestfold Rogaland Midt-Norge Others
This section describes and assesses the main segments in OBOS, including homebuilding, property management and advisory, commercial property and bank, insurance and real estate agency. The three former segments represent
revenue stream, totalling as much as 95% for 2015.
The Homebuilding segment is where the core business of OBOS is conducted. In 2015, homebuilding accounted for as much as 70% of group revenues. Although OBOS also sees substantial growth within the other segments, we believe that management will keep the revenue contribution from homebuilding at a minimum 50% of the total group revenue. The project revenues in this segment almost doubled from 2014 to 2015, reaching NOK8.1bn. As BWG Homes was recognised in the accounts as of H2 14, 2015 is the first year in which the company was fully consolidated, explaining the large deviation between the 2015 and 2014 figures. The P&L in 2014 was also affected by one-off costs related to the acquisition of BWG Homes.
In 2015, OBOS sold 3,903 properties, of which the com
3,432 units. According to management, OBOS aims to sell approximately 4,000 properties each year. Moreover, it intends to keep the land bank stable, implying that the same amount of homes must be added to the land bank annually. Hence, the acquisition strategy for the land bank to a high degree corresponds to the sales levels.
s acquisition of Nydalen Næringseiendom in Oslo in 2015, at a cost of approximately NOK1bn, was funded by a NOK950m private placement bond issued the by the OBOS Nye Hjem entity. Currently, this is a commercial property area in which
around 1,100 homes. Investments such as that in Nydalen Næringseiendom set the stage s homebuilding growth in future and as long as the area remains in its current shape, rental income from Schibsted also facilitates the company.
The sales ratio, i.e. the ratio of sold units as a percentage of total homes in production, s internal policies for homebuilding in Norway, no building projects should be started before the sales ratio is at least 50%. Contrary to many other companies in the same industry, the sales ratios are calculated on the basis of a sales value and not the number of properties. If the company does not reach this minimum target level of sales ratios, it is obliged to submit a guarantee for the the end of 2015, the number of unsold properties stood at 212 properties, of which 122 were related to the BWG Homes companies. Historically, the sales ratio and the number of unsold properties have been at a more or less stable and low level, which underpins the solid foundation in the homebuilding business. 69% 6% 9% 1% 15% Homebuilding Prop. mng. advisory Commercial prp. Bank, insurance and REA
67% 68% 69% 70% 71% 72% 0 2,000 4,000 6,000 8,000 10,000 12,000
2015 2016E 2017E 2018E 2019E Segment revenues % of total revenues 800 1016 819 2931 3903 130 150 170 190 0 1,000 2,000 3,000 4,000 5,000 2011 2012 2013 2014 2015
OBOS sold properties (l.h.s) House price index (31.12; r.h.s)
We need to highlight that the homebuilding sector in general is very susceptible to the cyclical housing and commercial property markets. This makes it hard to factor in a clear and visible future outlook, both operationally and financially. At the end of the day, the profitability of this segment depends on real economic conditions. At the same time, the credit profile is somewhat strengthened by property management and consulting being far more stable segments than homebuilding itself. However, the outlook for further development of revenues from property management and consulting is largely dependent on the housing and commercial property market; hence, these segments cannot be deemed entirely non-cyclical.
Revenues from property management and advisory services were NOK694m in 2015, corresponding to an increase of 11% from 2014. Currently, OBOS has management agreements with c.3,000 property companies, covering almost 200,000 properties in total. The company also manages properties that OBOS has not built. Additionally, OBOS has accounting and debt collection agreements with c.1,800 customers. Although this segment is the third largest in the group, its revenues were only 7% of group revenues in 2015. OBOS is also growing non-organically in this segment and in October 2015 the company acquired 60% of the shares in Stema Rådgivning, which is a Norwegian engineering advisory company providing services within project management and
management within the building and construction sector.
In OBOS Forretningsbygg, OBOS provides rental, operational and management services of commercial properties. This segment, which is the second largest in the group, accounted for around 10% of group revenues in 2015, with the letting part of the segment contributing 60% of the segment revenues. As in the other main segments, the growth in this segment can to a significant degree be attributed to non-organic growth, with new projects pushing up the activity level and revenues. The opening of Scandic Ørnen Hotel in 2014, the new Oslo hospital at Mortensrud in 2015 and the Oslo Cancer Cluster Innovation Park (OCCI) in 2015 are all examples of the strong engagement OBOS has in prominent commercial property projects. Last year, the company also commenced its building project in Lillestrøm outside Oslo, where it is building residential units, a hotel, offices, a shopping centre and car parking. OBOS expects to complete the project in 2017, with an expected investment cost of NOK1.6bn. The company also owns three of the 60 largest shopping centres in Norway. Chart
property type.
In total, the vacancy ratio in OBOS Forretningsbygg was 4.1% at year-end 2015, down from 4.8% the previous year. Looking at the group as a whole, the vacancy ratio was 4.0% last year. We consider the vacancy ratio to be at a sufficiently low level.
As of 2013, banking services in OBOS were organised under an own subsidiary, OBOS-banken. The bank had total assets of approximately NOK23bn at year-end 2015, up from
loan growth, as well as the ramp-up of the liquidity portfolio over 2015.
5% 6% 7% 0 200 400 600 800 1,000
2015 2016E 2017E 2018E 2019E Segment revenues % of total revenues 8% 9% 10% 0 500 1,000 1,500
2015 2016E 2017E 2018E 2019E Segment revenues
OBOS-banken has sold loans of NOK7.5bn to the mortgage company Eika Boligkreditt, through which OBOS gets a funding channel to the covered bond market. Eika Boligkreditt funds the loans by issuing covered bonds and it charges OBOS an administration fee. OBOS also gets a portion of the income that Eika makes on its loan margins. The distribution agreement between OBOS-banken and Eika Boligkreditt is expiring on February 2017, and on 11 January 2016 OBOS-banken applied to the Norwegian Financial Service Authority to establish its own mortgage company. The rationale behind creating an own mortgage company would be that the company finds it more rational to fund its loan book in the covered bond market, without paying s ambition to be a full-scope bank, having the same funding opportunities as other ordinary Norwegian banks.
Eika is likely to continue to administrate the already transferred loan portfolio from OBOS-banken, meaning that OBOS-banken will maintain a significant loan portfolio and funding in Eika Boligkreditt in coming years. Currently, OBOS owns 11.7% of the shares share of Eika
company as a healthy development in order to become a full-service bank. Economically, we also think it makes sense that OBOS-banken gets the opportunity to fund its loan portfolio through its own mortgage company.
Over the past few years, the bank has seen high volume growth. Although margin growth has historically been at a high level, we have witnessed more subdued margins lately. Consequently, this has contributed negatively to the overall revenue in the bank in 2015. Net interest was NOK225m in 2015, classified as financial income in the group accounts. The operational income of the bank and insurance segment consisted of commissions from Eika Boligkreditt and insurance fees, in total amounting to NOK101m in 2015 and accounting for only 1% of group revenues. The year-on-year loan growth in the household and corporate customer market in 2015 was 24% and 14%, respectively. As OBOS-banken has transferred only loans to the housing co-operatives ( borettslag ) to Eika Boligkreditt, the loan growth in the household segment is not affected by changes in
We are pleased to see that OBOS-banken is expanding its loan business substantially, as we have assessed the base level as relatively low. However, we cannot ignore the fierce price competition among Norwegian banks and, although we do not doubt OBOS-steadier level after a while. We also expect future loan growth to be related mainly to the increase in the OBOS member base. When the bank has set up its own mortgage company and succeeded in cheaper funding of its loan portfolio, we would expect the bank to be in shape to gain a stronger market position.
implementation of IFRS is recognised using the fair value option (FVO), with changes being recognised in the P&L. Higher credit margins over 2015 therefore reduced the fair value of debt and hence contributed positively to the P&L by NOK99m last year. On the
P&L by almost NOK33m in 2015.
0.0% 0.5% 1.0% 90 95 100 105 110 115 120
2015 2016E 2017E 2018E 2019E Segment revenues
% of total revenues
14%
9%
77%
OBOS employees Non-members
OBOS members 84% 73% 57% 0% 10% 20% 30% 40% 50% 60% 70% 80% 90% 2013 2014 2015
On the back of a repricing of
OBOS-larger reductions on deposits than on loans. This has pushed down the deposit ratio in the bank from 73% in 2014 to 57% in 2015, as displayed in Chart 13. However, the competition for deposits is strong, and the bank is therefore focused on improving its market position to attract more customers.
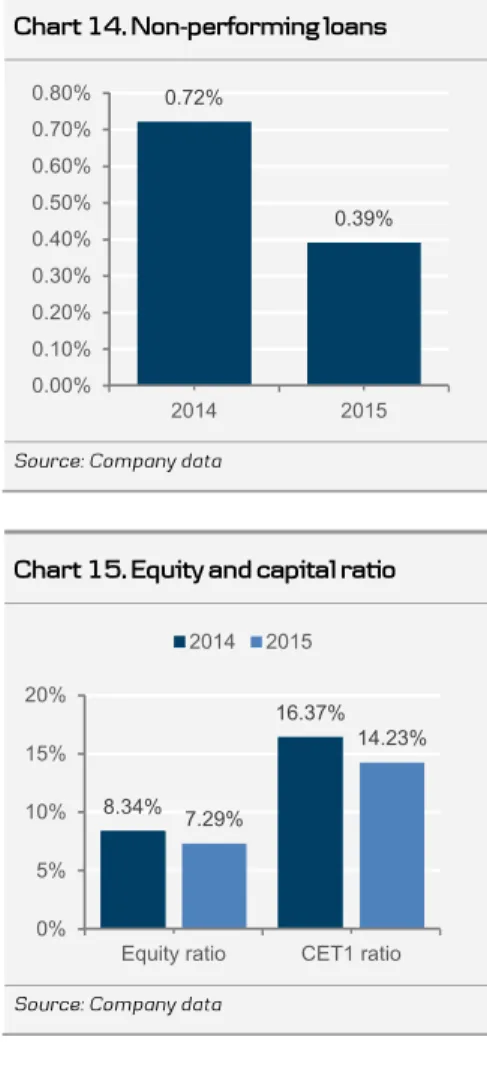
We consider the credit risk in OBOS-banken to be at a satisfactory low level. Non-performing loans, defined as loans that have not been serviced for more than 32 days, accounted for 0.39% of gross loans in the bank last year, down from 0.73% in 2014.
OBOS- h a relatively
loans related to the acquisition from BNP Paribas accounted for two-thirds of these. We are pleased to see that OBOS-banken has managed to curb the default ratio materially, giving us sufficient comfort on the credit management in the bank. OBOS-banken is also compliant with the regulatory capital and liquidity requirements.
Table 2 displays estimated key financials for OBOS BBL and the group excluding the bank segment. As the financial profile of a bank is relatively more leveraged and very different from that of a non-financial company, the credit metrics in the group are materially affected when we incorporate figures from OBOS-banken. In order for us to evaluate the credit profile of OBOS ignoring the data noise that we can get by aggregating figures from a bank, we also eliminate figures from OBOS-banken for certain metrics. For instance, the net debt/EBITDA for 2015 declines from 9.4x to 4.6x when we rule out the banking segment.
In the group accounts, net interest revenues from OBOS- are
consolidated as financial income, in contrast to financial reporting.
However, commission fees are recognised as operational income in both the group and
interest income from the bank as non-operational income. Thus, we do not need to eliminate the
already-exceed the total operational costs, the EBITDA contribution from the bank is negative. Therefore, when we eliminate OBOS-banken entirely from our calculation, this gives us a slightly higher estimated group EBITDA, as illustrated in Table 2.
0.72% 0.39% 0.00% 0.10% 0.20% 0.30% 0.40% 0.50% 0.60% 0.70% 0.80% 2014 2015 8.34% 16.37% 7.29% 14.23% 0% 5% 10% 15% 20%
Equity ratio CET1 ratio 2014 2015
Real estate agency sales are executed through the real estate agency, which sold approximately 2,650 houses in 2015. Most of the sales of new homes (project-related sales) are transferred to the homebuilding segment and the financial figures in this segment thus relate predominantly to homes sold in the second-hand market. The real estate agency contributed only 1.5% of group revenues in 2015. Hence, we consider this segment to be immaterial for the overall credit profile. However, in order for OBOS to deliver the entire range of services related to homebuilding and sales, the real estate agency plays an important role.
s holdings largely in the major construction and homebuilding companies Veidekke and AF Gruppen. Total dividends s holdings amounted to NOK954m at the end of 2015, up materially from NOK463m the year before. OBOS saw substantially higher gains in 2015, with a gain of NOK896m being realised on the back of the sale of shares in Veidekke and AF s holdings in Veidekke and AF Gruppen are 17.8% and 16.9%, respectively, down from 23% and 22.1% prior to the sales. In March 2016, OBOS also acquired a 2% stake in the largest construction and homebuilding company in the
price was around NOK300m.
In 2014, OBOS sold 617 letting homes to the municipality of Oslo. Post the sale, OBOS retains 306 letting units, of which 55 units are recognised in the accounts of the commercial property segment. OBOS does not consider the letting service to be profitable enough to focus on this kind of business. Rather it prefers to spend the capital on the other segments and this is why OBOS acquired BWG Homes at the same time as it divested its holdings of letting properties.
2531 2479 2575 127 509 499 0 500 1,000 1,500 2,000 2,500 3,000 3,500 2015 2014 2013
Second hand sales Project sales
2.0% 6.8% 16.9% 17.8% JM Multiconsult AF Gruppen Veidekke
The turbulent condition of the Norwegian economy has manifested itself throughout 2015 and into 2016. The shockwaves from the cuts in investments by exploration and production companies are washing over the industries of Norway. The unemployment rate has increased in multiple regions of the country and increased credit risk has materialised among offshore and onshore companies. However, the low interest rate environment has ensured that Norwegian house prices overall are still increasing.
In 2015, housing prices in Norway increased by approximately 5% y/y and the average price for second-hand homes came in at around NOK46,000 per square metre. On the other hand, housing prices in Stavanger, the city with the highest exposure to the Norwegian oil industry, declined by 8% over the same period.
s related businesses, is suffering the most from the current oil market downturn in Norway. The unemployment rate in Rogaland is the highest in Norway, with 4.3% of the population in the province being unemployed by December 2015. Taking the gloomy conditions of the province into consideration, we find comfort in OBOS having limited operations in that area. Only 3% of Norwegian OBOS members are from Rogaland.
Achieving equilibrium of demand and supply in the Norwegian housing market has been challenging over the past few years. In Oslo, for instance, almost 3,000 homes are built each year, while building activity should stand at 6,000-7,000 in order to cover population growth due to high immigration. That demand for new homes in Oslo is far much higher than is being supplied is contributing to inflating house prices. We argue that this mismatch is likely to prevail in coming years. First, we expect population growth in Norway and Sweden to remain high. Over the past five years, the populations of Oslo and Stockholm have increased by 10% and 9.5%, respectively. Norwegian authorities estimate that the population in Oslo will increase further from 650,000 today to 820,000 in 2030. Second, we do not believe that the Norwegian government will be significantly more efficient when it comes to submitting building permissions. Although these slow bureaucratic processes have been on the agenda in many political parties, we have seen little improvement. A smoother and more efficient regime for allocating building will thus be pivotal to increasing building
100 120 140 160 180 200 220 240 15-Q4 14-Q4 13-Q4 12-Q4 11-Q4 10-Q4
Entire country Oslo and Bærum
Stavanger Bergen 400,000 500,000 600,000 700,000 800,000 900,000 1,000,000 15-Q4 13-Q4 11-Q4 09-Q4 07-Q4
In order for OBOS to follow its aggressive growth strategy, the company is reliant on both short-term and long-term funding. According to management, the company will continue to raise debt through both bank and market-based funding.
The group issues debt in the funding markets through three different entities: OBOS, OBOS Forretningsbygg and OBOS-banken. The group has an explicit goal to have an investment grade rating, and it appears to be determined to control its credit profile in order to maintain its rating.
Total revolving credit facilities at the company stand at c.NOK3.5bn and c.NOK2.5bn for the group and the parent company, respectively. The company intends to have credit facilities sufficient to refinance outstanding market funding maturing over the coming 12 months. Outstanding short-term bond debt amounted to c.NOK1bn at year-end 2015, sufficiently lower than the undrawn RCF.
The following table summarises the credit facilities of the company and its associated companies.
utstanding bonds are as follows.
Total consolidated interest-bearing debt shall not exceed 50% of value-adjusted equity and interest-bearing debt (excluding debt in OBOS-banken) for the group excluding OBOS-banken.
Total interest-bearing debt in the parent company shall not exceed 35% of the parent -adjusted equity and interest-bearing debt.
the bond being secured in similar manner.
The company shall not bear guarantees in subsidiaries and associated companies that in total exceed NOK600m.
bonds, only one is being amortised, i.e. the private placement bond issued by OBOS Nye Hjem on the back of the c.NOK1bn acquisition of Nydalen Næringseiendom. In our opinion, the group has a sound debt structure and maturity profile, as illustrated in charts 20 and 22. The refinancing risk is higher in
2018-20 b we do not assign much
risk to the prospective maturity walls.
0% 20% 40% 60% 80% 100% 0 10,000 20,000 30,000 40,000 50,000 Total debt (l.h.s) Equity Debt ratio (r.h.s) 93% 6% 2%
Unsecured Secured Subordinated
800 1,000 2,200 1,850 2,300 770 20 1,076 770 220 0 500 1,000 1,500 2,000 2,500 3,000 3,500 2016 2017 2018 2019 2020 OBOS-banken bond balloons OBOS excl. OBOS-banken balloons
As part of the transition from NGAAP to IFRS as of 2015, OBOS has changed its principle of accounting revenues on construction projects, from recognising revenue as construction progresses to recognising revenue at a single time, i.e. at completion on delivery of the home property. When recognising in line with progress of the construction, revenue has been recognised on a percentage-of-completion basis. As at the end of 2015, the impact of the accounting change was a reduction in revenues of NOK279m. When construction is completed and homes are delivered to the buyers, OBOS will be able to recognise this amount.
If we take account of pro forma 2014 financial figures, in which the company applies IFRS light , total equity increases from NOK9.3bn to NOK12.3bn. The substantial change is explained mainly by an adjustment in the balance sheet with investment properties being recognised at their fair value. The fair value spikes in investment properties were NOK220m in 2015 and NOK320m in 2014, with the 2014 figures treated on a pro forma basis.
In order to assess the financial profile of OBOS, we need to evaluate both the historical performance and the future outlook for the company. As the overall performance of the group is highly dependent on the Norwegian and Swedish housing market, our forecasts are largely made in light of our macro view on these markets and are subject to high uncertainty. As mentioned above, we believe that housing prices in both Norway and Sweden will continue to remain high going forward.
In our forecasts, we estimate that the sales growth in the main homebuilding segment is 20% in 2016 and 10% in 2017, reaching a long-term momentum of 5% from 2018 until the end of our forecast window. We consider these forecasts to be conservative, given that sales in homebuilding on average have increased by 45% annually over the past three years. We forecast that sales growth in affiliated segments including property management and advisory, as well as the commercial property segments, will be 10% and 15% in 2016, respectively. From 2017 and onwards, we pencil in an annual sales growth of 5% for both sectors, materially lower than the historical three-year averages of 19% p.a. and 14% p.a., respectively. All in all, we apply a conservative approach in our forecasts, taking into consideration the possibility of lower activity because of the depressed real estate market in the coming years.
As at the end of 2015, the profitability, calculated as the EBITDA margin, was 19%. Over the past three years, the company has managed to achieve an EBITDA margin of at least 20%, which bodes well for the sustainability of the OBOS business model. In our forecast period, we see an annual EBITDA margin of 17-18%. We are also confident that management will be able to continue expanding its business within the relatively more profitable segments, enabling the company to maintain its current profitability level. Our forecast EBITDA margin reflects our conservative approach.
0% 5% 10% 15% 20% 25% 0 5,000 10,000 15,000 20,000 2015 2016E2017E2018E2019E Net sales EBITDA EBITDA margin 0% 5% 10% 15% 20% 25% 0 1,000 2,000 3,000 4,000 5,000 FFO Capex FFO / Net debt
OBOS has historically retained all profits within the group, and it plans to follow the same strategy, ruling out any profit model that pays dividends to its 400,000 members. Accumulated cash in the company is used in various strategic investments, be it acquisition of shares in other major companies or for instance acquisition of land to expand the homebuilding business. Therefore, we believe that OBOS will invest all excess cash above a certain level in different projects and companies. In our opinion, the strategy of not paying
s
OBOS has acquired Ulven AS in Oslo, with Storebrand and Fabritius as the selling parties. The acquisition became effective on 1 February 2016, providing OBOS with a land area of 232,000 square metres. Through the Ulven project, OBOS aims to develop a new residential area with up to 3,000 units and commercial properties employing approximately 5,000 people. In our opinion, the Ulven acquisition acts as proof of the strong long-term growth ambitions. OBOS intends to develop the Ulven area gradually over the coming 15-20 years, with the first project being initiated in Q1-Q2 16. The cost of the initial project is approximately NOK450m.
We project average capex for homebuilding and estimate the average land cost to be NOK8,000 per square metre. There are regional differences in the land price, with the central and more attractive areas having a land price in the range of NOK10,000-13,000 square metre and the cheaper regions having a land price between NOK3,000 and NOK5,000 per square metre. OBOS aims to build 3,000-4000 homes each year, including the homebuilding undertaken through BWG Homes. Assuming that the average size of each home is 70 sq m, the annual land investment for homebuilding would be c.NOK1.7bn. In our projections, we also assume average annual commercial property investments of c.NOK500m. We forecast the total annual capex to be NOK2.4bn on average.
We ar s projects are
undertaken along with other building companies, which curbs the level of capital binding in each project. In our opinion, this in turn reduces project-specific risks and facilitates a more diversified building portfolio for OBOS.
In order for OBOS to maintain its growth strategy, it is pivotal that it has a large land bank, which gives numerous opportunities for further residential and commercial homebuilding. At year-end 2015, the entire group land bank consisted of around 38,000 homes, of which OBOS had an economic share of 33,000. The land bank underpins the company large growth ambitions and also highlights that OBOS carries a long-term scope in its investments. In the 2015 balance sheet, the land bank was recognised with a book value of NOK6.3bn, corresponding to around 20% of total assets.
s free cash flow profile relies on the degree to which the internally generated cash is used as capex. In our forecast, the annual estimated FCF is negative over the coming five years. The FCF profile is also hampered by the build-up of working capital in the company. Loans to customers and deposits are recognised as working capital in the group accounts and an increased loan book compared with deposits will elevate the working capital level accordingly. In our opinion, the inclusion of loans and deposits in the working capital distorts the real picture of the cash profile in OBOS. However, focusing on funds for operations into account instead, we see that the operational cash flow profile is improving materially over the forecast window (as illustrated in Chart 24).
0% 20% 40% 60% 80% 100% Q4 20152016E2017E2018E2019E2020E Bond debt (excl. Short term) Short term debt
Our modelling of liability instalments and interest expenses is split between bond liabilities and long- and short-term debt. We assume that principal payments on maturing bonds are fully replaced by new bonds with corresponding bond terms and, similarly, that long-term debt instalments are rolled over in their entirety. We also assume that the company adds a higher amount of debt than is about to mature in 2016. Moreover, we roll over short-term debt.
At the end of 2015, debt/EBITDA and net debt/EBITDA in the company were 10.1x and 9.4x, respectively. OBOS can actually end up maintaining its current level of leverage ratio by increasing debt further on the back of higher profitability. As we estimate a
stronger EBITDA e ratio, defined
as EBITDA/net interest expenses, is also growing gradually in our forecasts.
Total equity in OBOS stood at NOK14.6bn at the
share capital was only NOK77m. This translates into an equity ratio of 28% in 2015. Excluding OBOS-banken from the group figures, the equity ratio stood at 44% last year. In our forecasts, the equity ratio is also going to increase gradually.
Having a sound liquidity position is of high importance to OBOS, as the company will be able to meet its short-term liabilities without being forced to refinance or sell assets. In order to estimate the liquidity position as at the end of 2015, we take account of cash
-term bonds, as well as government and municipality bonds, which accumulate to NOK310m. On the liability side, we sum up short-term debt and 2016 capex. As can be seen from Chart 28, available cash exceeds cash in use with more than adequate headroom. If we compare total interest-bearing debt to cash and marketable securities including undrawn committed facilities, liquid assets appear to be half of total interest-bearing debt at year-end 2015. We are confident that OBOS will keep its satisfactory liquidity position intact going forward. -10,000 -7,500 -5,000 -2,5000 2,500 5,000 7,500 10,000
2014 2015 2016E 2017E 2018E 2019E New debt
Debt repayment Free cash flow (FCF) Cash and cash equivalents
8.1x 9.4x 9.1x 9.5x 9.1x 8.7x 5.6x 4.6x 4.8x 5.0x 4.8x 4.6x 0.0x 2.0x 4.0x 6.0x 8.0x 10.0x
2014 2015 2016E 2017E 2018E 2019E Net debt/EBITDA
Net debt/EBITDA excl. OBOS-banken
0% 10% 20% 30% 40% 0 5,000 10,000 15,000 20,000 25,000
Equity Equity ratio
4,188 6,672 -2,000 4,155 -5,000 0 5,000 10,000 15,000
Cash outflow Cash inflow Short term debt Cash & Equivalents CAPEX Committed facilities
OBOS has invested in companies from various sectors and conducts banking services through OBOS-banken. However, as revenues from homebuilding and real estate related services account for as much as 70% of total group revenues, we believe we could still apply an approach in which we focus on the core business. We should also be s investments in companies such as Veidekke, AF Gruppen and JM are all investments closely related to homebuilding and commercial property. OBOS-banken is still a small segment compared with the segments related to the core business. The credit metrics and the credit profile of a bank are highly different from those of a real estate and homebuilding company. Thus, we also evaluate certain credit metrics by disregarding the contribution from the banking segment.
One alternative methodology could be to deem OBOS as an investment holding company, i.e. a company with operations in at least three industry sectors via equity participations in operation companies. Nevertheless, we still believe that the methodology for home and co-operatives properly addresses the risk and the core business in OBOS.
We consider the business risk profile of OBOS to be satisfactory, as the company has a very solid market position within the homebuilding and real estate sector in Norway. With a stronger geographical and operational diversification, we believe that OBOS can improve its credit profile further. S&P considers the real estate sector to be a low-risk industry from a competitive risk and growth perspective but with an intermediate level of revenue and profitability cyclicality. Hence, we cannot ignore the risk of the industry being hit by a significant fall in the housing and commercial property market. However, in such scenario, we believe that OBOS will scale down its growth activities substantially. As the group is a co-operative association, profit is retained within the group and is directed mainly at growth-related projects. Moreover, OBOS has a long-term perspective in many of its investments, making it less susceptible to exogenous market general policy of gaining a sales ratio of at least 50% before it commences on a building project in Norway also supports the business profile.
We characterise financial risk profile as intermediate. The aggressive growth is a , which have to be invested somewhere. However, from a credit risk point of view, aggressive debt-funded growth in general could be an obstacle for an improved credit profile. ales growth has been very strong over the past few years but, applying a more conservative approach, we have pencilled in weaker sales growth ahead. If we include the figures from OBOS-banken, the leverage ratio level appears to be high. However, when we also evaluate the leverage profile at year-end 2015 without taking account of the bank, net debt/EBITDA decreases substantially, better fitting an investment grade company within the real estate sector. The solidity in OBOS, defined by the equity ratio at year-end 2015, also increases from 28% to 44% if we exclude the bank figures. The liquidity position in OBOS is adequate, as available cash is exceeding cash in use by a sufficiently large amount.
Ev s business and financial risk profiles, we assign a BBB credit rating
OBOS has an extensive and valuable asset base, which provides comfort to bondholders in terms of sufficient recovery under normal circumstances. We use the balance sheet figures at the end of 2015 to estimate the value of the asset base. The land bank and buildings are booked at NOK2.7bn. The company does not use a professional third party to estimate the fair value of the land bank. Due to our conservative approach and as we believe that the turnover ratio on the land bank is sufficiently high, we do not project any increased in value for the land bank above what is already booked on the balance sheet. Neither do we incorporate more debt than already issued in 2015. Investment properties were recognised with a value of NOK7.7bn at year-end 2015, embedded with a fair value change of NOK220m. Sites under development, amounting to NOK10.8bn, also add to the healthy asset pool of OBOS.
NOK21.2bn, as illustrated in Chart 30.
On the liability side, we take account of secured, unsecured and subordinated debt. We include both bank debt and all the outstanding bonds in our exercise. Bonds issued by OBOS BBL, OBOS Forretningsbygg and OBOS-banken and the private placement executed by OBOS Nye Hjem are all incorporated in the liability pool. Banks and secured bondholders rank pari passu and have senior priority above unsecured bondholders, who
will be recovered only if there is asset value l overy.
default in the parent company OBOS BBL, provided that the loan amount is exceeding NOK100m. However, this cross-default does not apply for the issuers OBOS Forretningsbygg and OBOS-banken. Management intends to have as clean and independent a loan structure as possible in these two entities. In our stress test, we assume that the entire group faces a default scenario, so that all creditors claim recovery from the asset pool at the same time.
distressed value. We assume that 60% of the assets are encumbered. If the secured bondholders are not fully recovered through the sale of the encumbered assets, they rank pari passu with the unsecured bondholders with regard
loan amount. This increases the secure our assumption on encumbrance ratio.
In order to rate the outstanding bonds in the group, we conduct a stress test in which we simulate a default scenario with a dramatic downturn in the Norwegian and Swedish real estate and commercial property market. In our scenario, negative macroeconomic shocks have a severe impact on new housing demand and asset values. We apply various haircuts on the asset value, ranging from 10% to 50%, and subsequently estimate the recovery of secured and unsecured creditors. As can be seen from the recovery table and chart, the secured creditors are fully recovered even if the asset value declines 30%. Almost half the red in the same scenario. Although a haircut of more than 30% seems very harsh, especially when we take historical value changes in previous stressed periods in Norway into consideration, we adhere to the conservative side and allow a more severe recession in our exercise. Thus, we assign more weight to the 20-40% haircut range.
On the back of the recovery analysis, we assign an A- rating to the secured bonds, two notches above the corporate rating. For the unsecured bonds, we assign the same rating as that of the company, i.e. BBB .
100% 100% 100% 92% 81% 61% 54% 47% 37% 29% 10% 20% 30% 40% 50%
Level of asset value reduction
Chief Executive Officer: Daniel Kjørberg Siraj. Chief Financial Officer: Ove B. Haupberg. Chief Director, Homebuilding: Arne Baumann.
Chief Director, Property Management & Advisory: Morten Aagenæs. Chief Director, Bank, Insurance & Real Estate Agency: Boddvar Kaale. Chief Director, Commercial Property: Nils M. Bøhler.
Chief Director, Management Administration: Anne Elisabet Thurmann-Nielsen.
Financial Director: E. Marianne Aalby. Financial Chief: Harald Evensen. Funding Manager: Thomas Tronstad.
-20% -10% 0% 10% 20% 30% -15,000 -10,000 -5,000 0 5,000 10,000 15,000 20,000
2014 2015 2016E 2017E 2018E 2019E Operating revenues Operating expenses EBITDA margin -10,000 -7,500 -5,000 -2,500 0 2,500 5,000 7,500 10,000
2014 2015 2016E 2017E 2018E 2019E New debt
Debt repayment Free cash flow (FCF) Cash and cash equivalents
7.6x 7.8x 8.0x 8.2x 8.4x 8.6x 8.8x 9.0x 9.2x 0 5,000 10,000 15,000 20,000 25,000 30,000
2015 2016E 2017E 2018E 2019E Net debt Equity Net debt/EBITDA
2.1x 3.5x 4.6x 4.5x 4.9x 5.3x 0.0x 1.0x 2.0x 3.0x 4.0x 5.0x 6.0x
1,570 1,020 3,276 2,620 2,520 0 500 1,000 1,500 2,000 2,500 3,000 3,500 2016 2017 2018 2019 2020 8.1x 9.4x 9.1x 9.5x 9.1x 8.7x 5.6x 4.6x 4.8x 5.0x 4.8x 4.6x 0.0x 1.0x 2.0x 3.0x 4.0x 5.0x 6.0x 7.0x 8.0x 9.0x 10.0x
2014 2015 2016E 2017E 2018E 2019E Net debt/EBITDA Net debt/EBITDA excl. OBOS-banken
Thomas Hovard Head of Credit Research +45 45 12 85 05
hova@danskebank.com
Sondre Dale Stormyr Offshore rigs +47 85 40 70 70 sost@danskebank.com Haseeb Syed Industrials +47 85 40 54 19 hsy@danskebank.com Henrik René Andresen
Credit Portfolios +45 45 13 33 27
hena@danskebank.com Iver Christian Båtvik Seismic +47 95 97 74 45 ibt@danskebank.com Gabriel Bergin Strategy, Industrials +46 8 568 80602 gabe@danskebank.com Brian Børsting Industrials +45 45 12 85 19 brbr@danskebank.com Emil Hjalmarsson
Real Estate, Construction +46 8 568 80634 emih@danskebank.com Lars Holm Financials +45 45 12 80 41 laho@danskebank.com Louis Landeman TMT, Industrials +46 8 568 80524 llan@danskebank.com Jakob Magnussen Utilities, Energy +45 45 12 85 03 jakja@danskebank.com Øyvind Mossige Oil services +47 85 40 54 91 omss@danskebank.com Niklas Ripa
High Yield, Industrials +45 45 12 80 47 niri@danskebank.com Bjørn Kristian Røed Shipping +47 85 40 70 72 bred@danskebank.com Mads Rosendal
Industrials, Pulp & Paper +46 8 568 80594 madro@danskebank.com Katrine Jensen Financials +45 45 12 80 56 katri@danskebank.com Knut-Ivar Bakken Fish farming +47 85 40 70 74 knb@danskebank.com Pegah Ahmarinejad Real Estate +46 8 568 80593 pahm@danskebank.com Bendik Engebretsen Industrials +47 85 40 69 14 bee@danskebank.com
This research report has been prepared by Danske Bank Markets, a division of Danske Bank A/S ( Danske Bank ). The authors of the research report are Haseeb Syed, Senior Analyst, and Bendik Engebretsen, Analyst.
Each research analyst responsible for the content of this research report certifies that the views expressed in the research research report. Each responsible research analyst further certifies that no part of the compensation of the research analyst was, is or will be, directly or indirectly, related to the specific recommendations expressed in the research report.
Danske Bank is authorised and subject to regulation by the Danish Financial Supervisory Authority and is subject to the rules and regulation of the relevant regulators in all other jurisdictions where it conducts business. Danske Bank is subject to limited regulation by the Financial Conduct Authority and the Prudential Regulation Authority (UK). Details on the extent of the regulation by the Financial Conduct Authority and the Prudential Regulation Authority are available from Danske Bank on request.
The research reports of Danske Bank are prepared in accordance with the Danish Society of Financial Ana rules of ethics and the recommendations of the Danish Securities Dealers Association.
Danske Bank has established procedures to prevent conflicts of interest and to ensure the provision of high-quality research based on research objectivity and independence. These procedures are documented in Danske request that might impair the objectivity and independence of research shall be referred to Research Management not report to other business areas within Danske Bank.
Research analysts are remunerated in part based on the overall profitability of Danske Bank, which includes investment banking revenues, but do not receive bonuses or other remuneration linked to specific corporate finance or debt capital transactions.
Danske Bank, its affiliates, subsidiaries and staff may perform services for or solicit business from OBOS BBL and may hold long or short positions in, or otherwise be interested in, the financial instruments mentioned in this research report. The Equity and Corporate Bonds analysts of Danske Bank and undertakings with which the Equity and Corporate Bonds analysts have close links are, however, not permitted to invest in financial instruments that are covered by the relevant Equity or Corporate Bonds analyst or the research sector to which the analyst is linked. Danske Bank, its affiliates and subsidiaries are engaged in commercial banking, securities underwriting, dealing, trading, brokerage, investment management, investment banking, custody and other financial services activities, may be a lender to OBOS BBL and have whatever rights are available to a creditor under applicable law and the applicable loan and credit agreements. At any time, Danske Bank, its affiliates and subsidiaries may have credit or other information regarding OBOS BBL that is not available to or may not be used by the personnel responsible for the preparation of this report, which might affect the analysis and opinions expressed in this research report.
Within the previous 12 months, Danske Bank has acted as Co-Lead Manager of a public offer of credit bonds for OBOS-banken AS.
As an investment bank, Danske Bank, its affiliates and subsidiaries provide a variety of financial services, including investment banking services. It is possible that Danske Bank and/or its affiliates and/or its subsidiaries might seek to become engaged to provide such services to OBOS BBL in the next three months.
Danske Bank has made no agreement with OBOS BBL to write this research report. Parts of this research report have been disclosed to OBOS BBL. No recommendations or opinions have been disclosed to OBOS BBL and no amendments have accordingly been made to the same before dissemination of the research report.
Calculations and presentations in this research report are based on standard econometric tools and methodology as well as publicly available statistics for each individual security, issuer and/or country. Documentation can be obtained from the authors on request.
Major risks connected with recommendations or opinions in this research report, including a sensitivity analysis of relevant assumptions, are stated throughout the text.
This research report will be updated on an annual basis.
See the front page of this research report for the date of first publication.
Investment recommendations are based on the expected development in the credit profile as well as relative value compared with the sector and peers.
As at 31 December 2015 Danske Bank Markets had investment recommendations on 54 corporate bond issuers. The distribution of recommendations is represented in the distribution of recommendations column below. The proportion of issuers corresponding to each of the recommendation categories above to which Danske Bank provided investment banking services in the previous 12 months ending 31 December 2015 is shown below.
This research has been prepared by Danske Bank Markets (a division of Danske Bank A/S). It is provided for informational purposes only. It does not constitute or form part of, and shall under no circumstances be considered as, an offer to sell or a solicitation of an offer to purchase or sell any relevant financial instruments (i.e. financial instruments mentioned herein or other financial instruments of any issuer mentioned herein and/or options, warrants,
The research report has been prepared independently and solely on the basis of publicly available information that Danske Bank considers to be reliable. While reasonable care has been taken to ensure that its contents are not untrue or misleading, no representation is made as to its accuracy or completeness and Danske Bank, its affiliates and subsidiaries accept no liability whatsoever for any direct or consequential loss, including without limitation any loss of profits, arising from reliance on this research report.
The opinions expressed herein are the opinions of the research analysts responsible for the research report and reflect their judgement as of the date hereof. These opinions are subject to change and Danske Bank does not undertake to notify any recipient of this research report of any such change nor of any other changes related to the information provided in this research report.
This research report is not intended for, and may not be redistributed to, retail customers in the United Kingdom or the United States.
This research report is protected by copyright and is intended solely for the designated addressee. It may not be written consent.
This research report was created by Danske Bank A/S and is distributed in the United States by Danske Markets Inc., a U.S. registered broker-dealer and subsidiary of Danske Bank A/S, pursuant to SEC Rule 15a-6 and related interpretations issued by the U.S. Securities and Exchange Commission. The research report is intended for -6. Danske Markets Inc. accepts responsibility for this research report in connection with distribution in the United States solely to
Danske Bank is not subject to U.S. rules with regard to the preparation of research reports and the independence of research analysts. In addition, the research analysts of Danske Bank who have prepared this research report are not registered or qualified as research analysts with the NYSE or FINRA but satisfy the applicable requirements of a non-U.S. jurisdiction.
Any U.S. investor recipient of this research report who wishes to purchase or sell any Relevant Financial Instrument may do so only by contacting Danske Markets Inc. directly and should be aware that investing in non-U.S. financial instruments may entail certain risks. Financial instruments of non-non-U.S. issuers may not be registered with the U.S. Securities and Exchange Commission and may not be subject to the reporting and auditing standards of the U.S. Securities and Exchange Commission.