Analytical And Numerical Study Of Kramers’ Exit
Problem II
∗
Alexander Spivak
†, Zeev Schuss
‡Received 10 December 2002
Abstract
Kramers’ exit problem is concerned with noise activated escape from a po-tential well. In case the noise strength, ", (temperature measured in units of potential barrier height) is small this becomes a singular perturbation problem. It is shown that actually, most of the probability of the exit points on the sepa-ratrix is located at a distanceO(√") from the saddle point and the probability vanishes altogether at the saddle point. The stochastic dynamics of the escaping trajectories, conditioned on not returning to a given critical energy contour, are studied analytically and numerically.
1
Introduction
This paper continues the research started in “Analytical and Numerical Study of Kramers’ Exit Problem I” (see [1]). We remind the reader that the main purpose of this work is to give a complete description of the exit distribution in the Kramers problem which is concerned with the motion of a Brownian particle in afield of force. The motion is described by the dimensionless Langevin equation
¨
x+βx˙+U (x) =s2βw˙, (1) where U(x) is a potential that forms a well with barrier height normalized to 1, β is the dissipation constant, normalized by the frequency of vibration at the bottom of the well, is dimensionless temperature, normalized by the barrier height, and w is˙
standard Gaussian white noise [2]. If is a small parameter (e.g., if the barrier of the well is high), the stochastic trajectories of eq.(1) stay inside the well for a long time, but ultimately escape [2].
To describe the escape process the Langevin equation is converted to the phase plane system
˙
x=y
˙
y=−βy−U (x) +√2βw˙. (2)
∗Mathematics Subject Classifications: 60H10, 82C31, 46N55, 47N55.
†Department of Sciences, Academic Institute of Technology, POB 305, Holon 58102, Israel ‡Department of Mathematics, Tel-Aviv University, Tel-Aviv 69978, Israel
The domain of attraction of the stable equilibrium point of the noiseless dynamics,
˙
x=y
˙
y=−βy−U (x), (3)
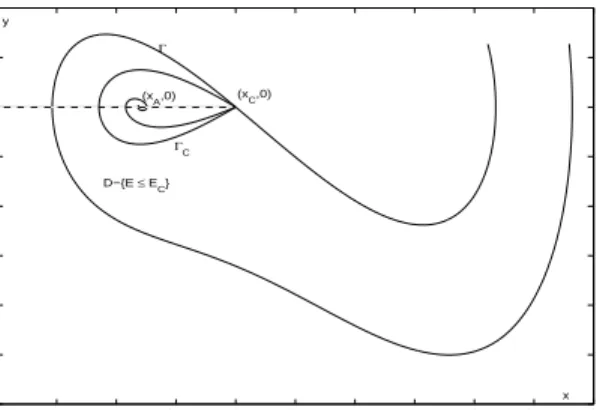
located at the bottom of the potential well, is denoted by D and is bounded by a separatrix, Γ, that is, the locus of points where the random trajectories of (2) are equally likely to escape or to return to the well (see Figure 1.1). Here the potential
U is given byU(x) = 2x4−1.2x3−2x2+ 1.45, and the dissipation constantβ = 2.
The plotting process was done with the help of the MATLAB program. The specific exit problem for (2) is to determine the probability density function (pdf) of the points where escaping trajectories hitΓ.
−2 −1.5 −1 −0.5 0 0.5 1 1.5 2 2.5 3 −12 −10 −8 −6 −4 −2 0 2 4 Γ ΓC D−{E ≤ E C} (xC,0) (xA,0) x y
Fig. 1.1. The domain of attractionD is bounded by the separatrixΓ.
The domainD−{E≤EC}is bounded betweenΓand by the critical energy contourΓC.
This is achieved by mapping the exit distribution on the critical energy contour onto the separatrix, as found in [3], by means of the tails of the escaping trajectories. The tails, which are the trajectories of the original dynamics conditioned on reaching the separatrix before returning to the critical energy contour, obey different dynamics than the original trajectories [4]. The idea of conditioning was proposed in [4] and used in [5] for elucidating some of the features of the phenomenon of saddle point avoidance. The application of the method of conditioning to Kramers’ problem requires separate analysis because the noise matrix is degenerate. We construct a boundary layer for the solution of the Fokker-Planck equation of the conditioned dynamics and match it with the outer solution. The numerical study of the noiseless conditioned dynamics reveals the peculiar behavior of the escaping trajectories near the separatrix. The tails of the escaping trajectories tend to move in the opposite direction to that of the original dynamics and aggregate near a point on the separatrix removed a distance of O(√) away from the saddle point.
Our main results are the uniform leading order asymptotic expansion of the solution of the stationary Fokker-Planck equation for the pdf of the tails, and an asymptotic expansion of the pdf of their exit points on Γ, in the limit of small . We give a numerical and graphical representation of the important components of the asymptotic solution and also compare the graph of the expression for the exit pdf with a normalized
histogram of exit points obtained by numerical simulation of the original stochastic dynamics (2). The result indicates that this pdf is asymmetric about its maximum which is achieved at a point onΓwhose distance from the saddle point isO(√ ).
2
Previous results
A trajectory that crosses ΓC goes on to crossΓ and escape the domain of attraction D. The part of an escaping trajectory from the last point where it hitsΓCto thefirst
point it hits Γ is referred to as the tail of the escaping trajectory. To investigate the problem of escape, we track the tails of the escaping trajectories.
The tails of the escaping trajectories form a new diffusion process, denoted by (x∗(t), y∗(t)),and defined in the domainD−{E≤EC}, enclosed betweenΓCandΓ.
This process has the same noise matrix as the original one and drift vector
b∗(x, y) = # y −βy−U (x) + 2 β∂lnP(x, y)∂y $ . (4) That means ˙ x∗(t) =y∗(t) ˙ y∗(t) =−βy∗(t)−U (x∗(t)) + 2 β∂lnP(x∗(t), y∗(t)) ∂y + √ 2 βw˙ . (5)
Note that thefirst component of the new drift is the same as that of the original drift, but the second component has the additional term 2 β∂lnP(x, y)/∂y.
The function P(x, y) is the solution of the backward Kolmogorov equation [7] in the domainD−{E≤EC}, with the boundary conditions
P(x, yΓ(x)) = 1, P(x, yC(x)) = 0. (6)
We transformedP(x, y) to the formP(x, y) =t2π Uχ(x, y)/
√
−∞ e−
z2/2
dz, where the functionχ(x, y) satisfies the equation
y∂χ(x, y) ∂x −[βy+U (x)] ∂χ(x, y) ∂y =β % χ(x, y) ∂χ(x, y) ∂y 2 − ∂ 2χ(x, y) ∂y2 & . (7)
The boundary conditions for χ(x, y) onΓandΓC are
χ(x, yΓ(x)) = 0, χ(x, yC(x)) = 0,
respectively. Obviously,
χ(x, y)<0 (8)
for (x, y)∈D−{E≤EC}, outside a boundary layer.
The functionχ(x, y) is one of the most important component of P(x, y), and can be expanded in a regular asymptotic power series away fromΓC,
where χ0(x, y) satisfies the reduced equation (7), corresponding to = 0 and (8).
Ac-cording to [7], for small , the asymptotic approximation toP(x, y) outside a boundary layer near ΓC is given by
P0(x, y) = u 2 π ] χ0(x, y)/√ −∞ e−z2/2dz. (10)
To satisfy the second boundary condition (6), the approximation (10) has to be cor-rected by an additional boundary layer nearΓC, as done below.
We found that inside the boundary layer (nearΓ),
∂lnP(x, y) ∂y = ∂P(x, y)/∂y P(x, y) ≈ 1 √ ∂χ0(x, y) ∂y = u 1 γ(x)∂ρ(x, y) ∂y +O ρ √ , (11)
where the functionγ(x) is a solution of the Bernoulli equation (see [1]) andρ=ρ(x, y) is the signed distance from the point (x, y) toΓ, such thatρ<0 inD. Using (11), we can write inside the boundary layer
b∗2(x, y)≈ −βy−U (x) +√ βγ(x)∂ρ(x, y)
∂y . (12)
The asymptotic expansion of∂lnP(x, y)/∂y nearΓCwas also constructed in the form
∂lnP ∂y ≈ y eζ eζ−1. (13) Here ζ=E−EC
is the stretched variable,Eis the energy, andEC the critical energy measured from the
bottom of the well, that is, the height of the barrier. In dimensionless units EC= 1.
Then the analysis of the functionχ0(x, y) inside a boundary layer nearΓ, and then
in D−{E≤EC}, outside the layer was done. We proved that outside the layer,
∂lnP(x, y) ∂y ≈ − 1 χ0(x, y) ∂χ0(x, y) ∂y . (14)
The two expansions, (13) and (14), have to match nearΓC, outside the boundary
layer. Taking the limitζ→ ∞in (13), we obtained the form ofχ0(x, y) neary=yC(x)
and also the matched uniform expansion of∂lnP/∂y (see [1], section 3).
3
The exit pdf of the tails
Now we construct the exit pdf,pΓ(x) of trajectories (x∗(t), y∗(t)) that start at a point
flux density ofp∗(x, y, |x0, y0), the solution of the stationary Fokker-Plank equation (FPE) −y∂p∗ ∂x + ∂ ∂y βy+U (x)−2β ∂lnP(x, y) ∂y p∗ + β∂ 2p∗ ∂y2 = −δ(x−x0, y−y0) (15)
in D−{E≤EC}with the absorbing boundary condition [8] p∗(x, yΓ(x), |x0, y0) = 0.
Choosing (x0, y0) on a contourΓδ close toΓC, the exit pdf is obtained by integrating
the normal component of theflux of
p∗(x, y, ) =
L
Γδ
p∗(x, y, |x0, yΓδ(x0))pC(x0)dx0. (16)
4
The outer solution
We follow the method of [6] for the asymptotic construction of the solution, with the necessary modifications. The asymptotic solution of the FPE (15) is constructed in the form of an outer solution multiplied by a boundary layer function. A solution of the form
p∗(x, y, |x0, y0) =e−ψ(x,y)/Q(x, y, ), (17)
is substituted into the FPE (15) and terms of the same orders of magnitude are bal-anced. At the leading order O −1, wefind that the function ψ(x, y) is the solution
of the eikonal equation
y∂ψ ∂x − βy+U (x)−2β ∂lnP(x, y) ∂y ∂ψ ∂y +β ∂ψ ∂y 2 = 0. (18) The function Q(x, y, ) is assumed to have afinite limit,
lim
→0Q(x, y, ) =Q(x, y,0), (19)
for allfixed (x, y)∈D−{E≤EC}, andQ(x, y, ) has a boundary layer structure near Γ(see Section 5 below). The limit functionQ(x, y,0) does not vanish inD−{E≤EC},
so that for any (x, y)∈D−{E≤EC}the essential singularity ofp∗(x, y, |x0, y0) at
= 0 is contained in the exponential term in eq.(17).
Using eq.(14), wefind that outside the boundary layer nearΓthe eikonal equation (18) has the form
y∂ψ ∂x− βy+U (x) + 2β χ0(x, y) ∂χ0(x, y) ∂y ∂ψ ∂y +β ∂ψ ∂y 2 = 0. (20) We use the expansion (13) in the outer region to write the eikonal equation for the outer solution (17) evaluated inside the boundary layer as
y∂ψ ∂x− βy+U (x) + 2γ2(x)ρρy ∂ψ ∂y +β ∂ψ ∂y 2 = 0. (21)
This outer solution has to be matched by the boundary layer solution in the matching region.
We construct a boundary layer solution of the Fokker-Planck equation (15) by ex-tending the outer approximation of the drift coefficient (14) up to the boundary, rather than using the boundary layer approximation eq.(12). This approximation simplifies the calculations. A similar result is obtained if the approximation (14) is used instead. Near the saddle point, we can approximate the separatrix by the liney=−λx. Then
ρis a linear function of (x, y) and the coefficients of the first order partial derivatives in the eikonal equation (21) become linear functions. Since the saddle point is a stable attractor of noiseless dynamics, the eikonal functionψ(x, y) is locally a quadratic form in the neighborhood of the saddle point, that is,
ψ(x, y) = 1 2
ax2+ 2bxy+cy2. (22)
Substitutingψinto equation (21) and simplifying, gives
a= β+ 2γ 2 β −ω2+ 2γ2λ, b= 0, c= β+ 2γ 2 β . (23)
It follows that the partial derivatives ofψ(x, y) near the saddle point are given by
ψy(x, y) =cy, ψyy(x, y) =c.
5
The boundary layer equation
The equation for Q(x, y) is obtained by substituting the solution (17) in the Fokker-Planck equation (15) and setting the sum of the pre-exponential terms that are of order 1 equal to 0. Taking into consideration the eikonal equation (18), we obtain nearΓthe equation βεQyy+ −2βψy+βy+U (x) + 2βγ2(x)ρρy Qy−yQx +β+ 2βγ2ρ2 y+ 2βγ2ρρyy−βψyy Q= 0 (24)
for (x, y)∈D−{E≤EC}. The boundary condition isQ(x, yΓ(x)) = 0. Next we give
the uniform asymptotic approximation top∗(x, y). We introduce the following changes
of variables. First, we change (x, y)→(x,ρ) and then scale with
ρ=√εζ, x=εξ. (25)
Now, we introduce the variable
µ=γ1(ξ)ζ,
where γ1(x) is the solution of the Bernoulli equation
−yΓ(x)γ1(x) +
b0(x)−βψ (x) + 2βγ2(x)ρ2y
γ1(x) =γ12(x)βρ2y
with the initial condition
γ1(0) = v b0(0)−βc+ 2βγ2(0)ρ2y(0,0) βρ2 y(0,0) .
Note that the explicit form of b0(x) is given in [1] and [3].
The uniform approximation top∗(x, y, |x0, y0), valid up to the boundary, is given
by punif(x, y, |x0, y0) =C|x|2 √ 1+β2−1 ˜ S(x, y) exp −ψ(x, y) , (26)
where Cis a normalization constant and ˜ S(x, y) = u 2 π ] 0 µ e−s2/2ds.
Note that ˜S(x, yΓ(x)) = 0 and for all (x, y)∈D−{E≤EC},
lim
→0
˜
S(x, y) = 1.
The approximation (26) is valid for all (x0, y0)∈ΓC, outside the boundary layer nearΓ
(that is, fory0=yC(x0)). On the portion ofΓC contained in the boundary layer near Γthe densitypC(x0) is small, becausepC(x0) vanishes atx0=xC. Thus, the uniform
approximation to p∗(x, y, ), as defined in eq.(16), is to leading order independent of
x0. That is,punif(x, y, ) is also given by the right hand side of eq.(26).
Note thatpunif(x, y, ) satisfies both the boundary condition onΓand the matching
condition in the outer region. The pdf per unit arc length of the exit points on Γ is converted to the pdf per unitxby the following identities
˜ pΓ(s)ds = N−1J(x, yΓ(x))·ν(x, yΓ(x))ds = −N−1 β∂p∗(x, yΓ(x)) ∂y ν2(x, yΓ(x))ds = −N−1 β∂p∗(x, yΓ(x)) ∂y dx = pΓ(x)dx, (27)
where the normalization constant is N =−KΓ β∂p∗(x,yΓ(x))
∂y dx. ThuspΓ(x) is
asym-metric about its maximum and vanishes at the saddle point.
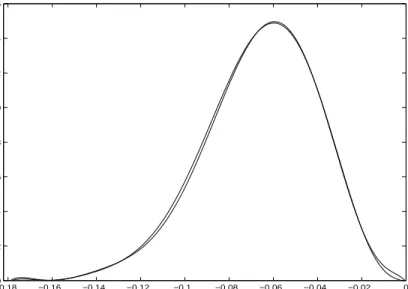
Figure 5.1 shows a histogram of the exit points onΓ vs x, collected from a direct simulation of eq.(2). Simulations were run with initial conditions given near the bottom of the well. The exit distribution is essentially independent of the initial points of the trajectories of (2), because all trajectories converge first to a neighborhood of the attractor at the bottom of the well and only after a long time there they escape toΓ. Figure 5.2 shows two curves: (a) an analytic curve of eq.(27) which is divided by the area value under the curve, and (b) a curve obtained by interpolating the vertices of the histogram shown in Figure 5.1 (using a polynomial of seventh degree), and then dividing it by the area value appearing under the curve. This means that in Figure 5.2 we see two curves after the normalization process, so that the underlying area is 1. The most likely exit point, denoted xM, maximzespΓ(x). It is determined by the
equationpΓ(x) = 0, which in view of eq. (22) gives, to leading order,
xM = v
2 (s1 +β2−1)
It follows that the most likely exit point isC√ away from the saddle point. −0.16 −0.14 −0.12 −0.1 −0.08 −0.06 −0.04 −0.02 0 0 20 40 60 80 100 120 x pΓ(x)
Fig. 5.1. A histogram of the exit points onΓvsx. Trajectories of (2) start near the bottom of the well.
−0.180 −0.16 −0.14 −0.12 −0.1 −0.08 −0.06 −0.04 −0.02 0 2 4 6 8 10 12 14 16
Fig. 5.2. The graphs of the analytic expression eq.(27)
References
[1] Z. Schuss and A. Spivak, Analytical and Numerical Study of Cramers’ Exit Problem I, Applied Mathematics E-Notes, 2 (2002), 132—140.
[2] H. A. Kramers, Brownian motion in a field of force and the diffusion model of chemical reactions, Physica (Utrecht), 7(1940), 284—304.
[3] B. J. Matkowsky, Z. Schuss and C. Tier, Uniform expansion of the transition rate in Kramers’ problem, J. Stat. Phys., 35(3/4)(1984), 443—456.
[4] M. V. Day, Large Deviation Results for the exit problem with characteristic bound-ary, J. Math. Anal. Appl., 147(1990), 134—153.
[5] B. Z. Bobrovsky and O. Zeitouni, Stochastic Processes and their Applications, 41(2)(1992), 241—256.
[6] B. Z. Bobrovsky and Z. Schuss, A singular perturbation method for the computation of the meanfirst passage time in a nonlinearfilter, SIAM J. Appl. Math., 42(1982), 174—187.
[7] Z. Schuss, Theory and Applications of Stochastic Differential Equations, John Wiley and Sons, New York, 1980.
[8] T. Naeh, M. M. Klosek, B. J. Matkowsky and Z. Schuss, Direct approach to the exit problem, SIAM J. Appl. Math., 50(1990), 595—627.