Characterization of mechanochemically synthesized MOFs
Maria Klimakow
a, Peter Klobes
a, Klaus Rademann
b, Franziska Emmerling
a,⇑ aBAM Federal Institute for Materials Research and Testing, Richard-Willstaetter-Str. 11, 12489 Berlin, Germany b
Department of Chemistry, Humboldt-Universität zu Berlin, Brook-Taylor-Str. 2, 12489 Berlin, Germany
a r t i c l e
i n f o
Article history:
Available online 30 November 2011
Keywords:
Metal–organic frameworks Mechanochemistry Gas adsorption Specific surface area MOF-14
a b s t r a c t
The compound MOF-14 (Cu3(BTB)2, BTB = 4,40,400-benzenetribenzoate) was synthesized by ball milling
and characterized by powder X-ray diffraction (XRD). The raw material was activated using an efficient single washing step to ensure a free pore access. Nitrogen adsorption measurements were carried out to determine the specific areas of the samples before and after activation. To interpret the activation process in terms of blocking effects in the micropore channels, NLDFT evaluations (Nonlocal Density Functional Theory) of the MOF-14 nitrogen isotherms were carried out. In connection with the appearance of addi-tional hysteresis loops in the nitrogen isotherms, calculations of the mesopore size distribution were per-formed using the method of Barret, Joyner, and Halenda (BJH). The results are compared to those of a structurally analogue MOF, namely HKUST-1 (Cu3(BTC)2, BTC = 1,3,5-benzenetricarboxylate). This
com-parison showed notable differences regarding the impact of the activation step on the formation of mes-opores and their size distribution.
Ó2011 Elsevier Inc. All rights reserved.
1. Introduction
Metal–organic frameworks (MOFs) are a new class of crystalline materials, which are currently of great interest for applications in sorption, separation, catalysis, and drug delivery[1–4]. These hybrid materials are built by inorganic knots (metal ions or clusters) linked via organic ligands. Due to this modular assembly they allow for a ra-tional design of a desired pore size and structural porosity of the materials. The high inherent porosity of MOFs is a strong driving force in ongoing research. For example, Ferey et al. succeeded in the characterization of compound MIL-101 with an estimated Lang-muir surface area of 5900 m2/g[5]. Nevertheless, it is known that the
properties of these materials, like porosity and adsorption capaci-ties, strongly depend upon the synthesis procedure causing different morphologies of the target compound. This feature often leads to a wide range of experimentally determined values for the surface area for one compound[6–8]. A main issue in this regard is that the com-mon syntheses based on solvothermal methods often lead to the incorporation of solvent molecules in the network. Consequently, the possibilities for a rational design are limited and the subsequent removal of solvent can even cause the collapse of the network. For these reasons, the development of novel synthesis routes is a main focus in research of MOFs.
Mechanochemistry is still a relatively unusual synthesis possi-bility, although it is currently employed by several groups as an ap-proach for the synthesis for one, two and three dimensional metal organic compounds[9–11]. This synthesis method offers a solvent-free access for the preparation of MOFs and appropriate building blocks[12]. Consequently, it avoids several of the disadvantages in the solvent-based MOF syntheses mentioned above. In addition, sufficient amounts of pure material for broad range testing can be easily obtained typically in quantitative yields[13]. The solid-solid reaction leads directly to products in powder form, making the materials ready for various applications without any time-consum-ing treatments.
In the current contribution we analyze the structural properties of a mechanochemically synthesized MOF. The metal–organic framework MOF-14 (Cu3(BTB)2, BTB = 4,40,400-benzenetribenzoate)
[14]was chosen as candidate material for the investigations. The re-sults are compared to those of the intensively studied compound HKUST-1 (Cu3(BTC)2, BTC = 1,3,5-benzenetricarboxylate) [15],
which is an structural analogue of MOF-14. Both structures consist of the same copper dimeric paddle wheel unit depicted inFig. 1, which exhibits unsaturated metal centers upon activation. Hence, these materials have gained considerable interest as catalysts and potential adsorbents due to their high porosity and large specific surface areas[4,16,17]. HKUST-1 consists of a non-interwoven cub-octahedral network, whereas MOF-14 has a completely different Pt3O4-type topology with two interwoven networks, resulting in a
reduced porosity, although the pore diameter (1.6 nm) is larger than in HKUST-1 (0.9 nm).
1387-1811/$ - see front matterÓ2011 Elsevier Inc. All rights reserved. doi:10.1016/j.micromeso.2011.11.039
⇑ Corresponding author. Tel.: +49 30 81041133; fax: +49 30 81041137.
E-mail addresses: [email protected] (M. Klimakow), peter.klobes@ bam.de (P. Klobes), [email protected] (K. Rademann),
[email protected](F. Emmerling).
Contents lists available atSciVerse ScienceDirect
Microporous and Mesoporous Materials
The surface area of MOF-14 has been estimated with a value of 1502 m2/g (Langmuir area calculation from the nitrogen adsorption
isotherm at 77 K)[14]. The experimentally determined values of the surface areas reported for HKUST-1 range from 692 to 1944 m2/g
(BET, nitrogen adsorption)[15,18], whereas the majority of values are smaller than 1000 m2/g, indicating again the severe difficulties concerning the reproducibility of both material quality and mea-surement. The assumption that the real pore structure and the net-work of the pores in MOFs deviate from their ideal architecture is one possible explanation for this phenomenon. A second reason dis-cussed recently in the literature to influence the gas adsorption properties of MOFs are morphological aspects. Several authors refer to differing specific surface areas and adsorption capacities due to materials with the same chemical composition but varying mor-phologies gained by different synthetic procedures[19,20]. 2. Experimental section
2.1. Syntheses
Mechanochemical syntheses were carried out in a conventional ball mill by grinding of the reactants. The developed procedure used is explicitly described in Ref.[21] with the exception that the synthesis was carried out at 50 Hz. The conversion of the reac-tants is detectable by a change of the color of the powder during the reaction (from deep green to light blue) and the evolution of a strong odor of the by-product acetic acid (for reaction scheme see Fig. 1). The samples are activated by a single post-synthetic washing step with ethanol followed by drying in air.
2.2. Methods
Powder X-ray diffraction (XRD) measurements were performed on a D5000 diffractometer (Siemens) in Bragg-Brentano geometry (linear position-sensitive detector, curved Ge(111) monochroma-tor, Cu-Karadiation,k= 0.1542 nm).
Gas adsorption experiments were carried out on a ASAP 2010 (Micromeritics) using a 1 Torr pressure transducer with a resolu-tion of 5105Torr (0.007 Pa). The adsorptive used was nitrogen
at a temperature of 77 K. Prior to the measurements, the MOF-14 samples were degassed at 120°C for 4 h in vacuum.
For choosing the appropriate relative pressure range for the linear BET fit of the microporous MOF adsorbents by means of the linearized two parameter BET equation[22]the following con-sistency criteria of Rouquerol et al.[23]were applied:
(1) The selected pressure range has to be chosen so that vads(1p/p0) is always increasing withp/p0.
(2) In this pressure range, the straight line fitted to the BET plot must have a positive intercept to yield a meaningful positive value of the BET parameter C.
(3) The relative pressure value corresponding to the calculated monolayer volume must lie within the pressure range selected according to the criteria (1) and (2).
As has been demonstrated by Walton and Snurr[24], the BET theory applied to experimental nitrogen isotherms using the con-sistency criteria (1)–(3) is a valuable method for characterizing microporous, crystalline materials like MOFs even with pore geom-etries that are far from the flat surfaces used in deriving the BET theory.
Thermogravimetry (TG) and differential thermal analysis (DTA) measurements were performed simultaneously on a thermobalance TAG 24 (SETARAM). For this purpose, the samples (initial mass 25 mg) were filled into 100
ll Pt-crucibles and heated under a flow
of nitrogen and air at a rate of 5°C/min up to 600°C. For simulta-neous analysis of evolved gases a mass spectrometer (Balzers Quad-star 421) was coupled to a heated (120°C) quartz glass capillary (measurements were performed in Bargraph mode).Infrared spectroscopic measurements were carried out on a FT-IR spectrometer Equinox 55 (Bruker) with the microscope IR-Scope II using a 15-fold objective. The samples were prepared on CaF2-slides.
Raman spectroscopic investigations were performed with a Lab-Ram single stage spectrograph (Horiba Jobin-Yvon) at an excitation wavelength of 488 nm using a notch filter and a liquid nitrogen cooled CCD detector (2561024 pixels). The data acquisition time was 1010 s.
3. Results and discussion
The completeness of the mechanochemical reaction was con-firmed by the X-ray powder diffraction (seeFig. 2). The diffraction pattern of the mechanochemically prepared MOF-14 samples (as synthesized and after activation) show no reflexes of the reactants and are consistent with the theoretical pattern calculated from the crystal structure[14]. The lattice constants of both MOF-14 samples (space group Im-3) are nearly the same (activated 27.0054(32) Å, as synthesized 26.9669(28) Å), whereas the crystallite size of the acti-vated sample is significantly larger compared to the raw material (activated 120 nm, as synthesized 40 nm).
Nitrogen adsorption measurements of the raw product showed a BET specific surface area of 614 m2/g. After activation, this value
increased by nearly 100% to a final surface area of 1215 m2/g (for
isotherms seeFig. 3). The determined value is slightly smaller than the reported value of 1502 m2/g [14]. Comparing the values, one has to keep in mind that the latter one was determined with Fig. 1.Reaction scheme of the mechanochemical syntheses of HKUST-1 (Cu3(BTC)2) and MOF-14 (Cu3(BTB)2) and the coordination environment around the dimeric copper
Langmuir area calculations, which always lead to higher values than BET calculations.
Since the XRD patterns of the raw and the activated material were consistent, there is no indication for any changes in the crys-tal structure (i.e. changes in the lattice parameters). It can
there-fore be assumed that the different BET surface area values are connected with micropore blocking by acetic acid molecules gen-erated as gaseous by-product from the synthesis, rather than based on partial framework collapse. This assumption was confirmed by a thermal analysis (seeFig. 4) coupled to mass spectrometry for the investigation of evolved gases upon heating. The raw material shows a distinct signal for the mass 60 (seeFig. S2in the Support-ing information), which is the molecular mass of acetic acid. This signal was not detected within the activated sample. The total weight loss is calculated to be 79% for the raw product and to be 83% for the activated material. The weight loss of both samples consists of two main stages. The first one correlates to an endother-mic DTA effect, mainly due to the loss of solvent, and finishes at about 150°C for the activated material and 175°C for the un-treated sample. The second stage of the weight loss consists of two overlapping exothermic DTA effects and is based on the loss of organic fragments. It starts at about 200°C for both samples, but finishes at about 380°C for the activated sample and at a sig-nificantly higher temperature of 560°C for the raw material. IR and Raman spectroscopic measurements (seeFig. S1in the Sup-porting information) again show no significant difference between the as synthesized and activated sample. The spectra are in good agreement with those published for comparable MOFs having similar chemical compositions (Cu3(BTB)2(H2O)3/MOF-143 [25]
Fig. 2.XRD patterns of mechanochemically prepared MOF-14, as synthesized and after activation, compared to the theoretical pattern simulated from the crystal structure (bars)[14].
Fig. 3.Upper row: adsorption (filled symbols) and desorption (empty symbols) isotherms for nitrogen at 77 K of mechanochemically prepared MOF-14 and HKUST-1 before and after activation. Lower row: BJH pore size distribution determined from the adsorption branches of the nitrogen isotherms (the vertical dashed line marks the upper BJH calculation limit at 50 nm).
and [Cu2(HBTB)2(H2O)(EtOH)] H2O EtOH[26]). In case of the raw
material contributions of acetic acid are found in the IR spectrum. A detailed analysis is given in the Supporting information.
The nitrogen isotherm (seeFig. 3) of the ‘as synthesized’ MOF-14 sample exhibits a superposition of IUPAC type I shape in the initial part and type IV shape showing a desorption branch with a pro-nounced hysteresis loop of type H2[27], which is characteristic for mesopore blocking or cavitation [28–31]. This phenomenon connected with capillary condensation taking place in mesopores is a hint for the existence of mesoporosity in the sample in addi-tion to the micropores resulting from the crystal structure of the MOF.
The mesopore size distribution of the raw material was calcu-lated from the adsorption isotherm using the classical BJH-method (Barret–Joyner–Halenda) for mesopores, which is based on the Kelvin equation[32]. This approach provides an approximate size of the mesopores in the material. Furthermore the BJH model rep-resents a macroscopic, thermodynamic method it is not sensitive to details of the adsorption potential and may underestimate the pore sizes up to 25% for narrow mesopores (pores smaller than 10 nm in width)[33].
The BJH pore size calculation (seeFig. 3) using the adsorption branch of the measured MOF-14 nitrogen isotherm leads to a cen-tral mesopore peak at about 6 nm, followed by two minor peaks at 13 and 25 nm pore diameter for the raw product. Since the XRD pattern is consistent with the simulated pattern from the crystal structure of MOF-14, these mesopores cannot be intrinsic in the crystal lattice. One possible explanation could be that they are formed as disordered amorphous domains, but then the size distri-bution should show much wider. Such domains could result from a local melting process during the mechanochemical reaction in the ball mill. Since the size distribution of these mesopores is relatively narrow, indicating a more ordered structure, it can be assumed that they result from a somehow regular assembly of smaller sub-units forming relatively stable agglomerates.
The activation step itself consists in removing acetic acid mole-cules from the MOFs’ micropores making the cavities accessible for nitrogen as the BET analysis gas. As a result, the measured specific surface area nearly doubles from 614 to 1215 m2/g.
Former investigations of the structural analogue HKUST-1 showed different characteristics in the isotherms of the system after the activation step[21]. The mechanochemically synthesized HKUST-1 material without any further cleaning or activation step showed a relatively small BET surface area of 758 m2/g. To investi-gate this issue, TG/DTA/MS measurements were performed
showing that the pores were blocked from acetic acid molecules as by-product of the mechanochemical synthesis. To generate a free pore access, the material was activated also by washing in ethanol. The nitrogen isotherm of the raw HKUST-1 material directly from mechanochemical synthesis exhibits similar characteristics compared to MOF-14. In Fig. 3, one can see a type IV isotherm shape with a desorption branch showing a hysteresis loop of type H2. The BJH pore size calculations using the adsorption branch of the nitrogen isotherm indicate a mesopore peak at about 45 nm pore diameter for the raw material. The relatively broad HKUST-1 mesopores size distribution implies that the assumption of disor-dered amorphous domains forming these cavities seems to be more realistic than for MOF-14. For HKUST-1, the activation proce-dure leading to a high surface area material is connected with the disappearance of this hysteresis loop. The observed isotherm is a nearly pure type I isotherms, which is characteristic for micropo-rous materials. The calculated BJH pore size distribution clearly showed that the activated HKUST-1 material does not exhibit any mesopore peaks. The BET specific surface area of the material increases upon the activation by more than 100% to 1713 m2/g.
On the other hand, the nitrogen isotherm of MOF-14 showed a reduced but not entirely vanished hysteresis loop upon activation (seeFig. 3), although the surface area is significantly increasing as well. This observation clearly indicates that the reduction of the hysteresis loop during the activation procedure and the increase of the BET surface area are caused by different processes. Instead of the dominating mesopore peak at about 6 nm in the BJH pore size distribution of the MOF-14 raw material, the activated material with the higher BET area exhibits a mesopore distribution with two mesopore peaks at 4 and 12 nm in diameter with reduced peak heights indicating a residual mesoporosity. This may be ex-plained by the assumption that, in contrast to the activation of HKUST-1, the agglomerated structure of MOF-14 crystallites is not completely destroyed during the activation process but the packing of the remaining agglomerates may be changed by the treatment with ethanol and due to the increased crystallite size.
To corroborate the assumption that the increased SSA results from micropore cleaning, an analysis of the micropore region of the adsorption isotherm was carried out using the DFT tool of the software ASAP 2020 V3.05. Although adequate calculation kernels for MOFs are still missing, first attempts of applying DFT calculations to MOFs have been made recently[34]. For our calcu-lations we assumed an adsorption potential of N2on an oxidic
sur-face and a cylindrical geometry which provided the best fit for the adsorption isotherm of the raw and activated MOF-14 material (seeFig. S3 in the Supporting information). The usage of other geometries such as slit pores etc. and kernels (e.g. for carbon sur-faces) did not result in a proper fitting of the isotherms. Prior to the activation, three peaks at about 0.7, 1.3, and 1.5 nm are ob-tained in the micropore region (seeFig. 5). These values are in good agreement with the real pore structure in the crystal lattice of MOF-14. The largest cavities in that system are able to include guest molecules with 1.6 nm in diameter which corresponds to the third peak. These cavities are joined by apertures with dimen-sions of 0.8 and 1.4 nm, which well agree with the results obtained. Since these micropores result from the crystal structure, it is clear that they also exist in the activated sample. The significant increase of the intensity of the peak at 1.5 nm indicates that the activation step is connected with cleaning the pores of that size because the other peaks remain nearly at the same height. This result supports the hypothesis that the by-product acetic acid is stored in those pores and not in the apertures, and it proves that the activation consists of a removal of those guest molecules. Therefore the spe-cific area increases.
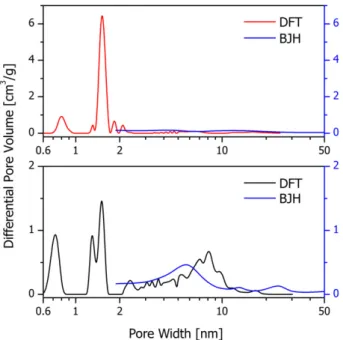
The MOF-14 DFT pore size distribution of the raw material and the activated product in the mesopore region show qualitatively a Fig. 4.TG, DTG, and DTA curves of MOF-14 samples.
very similar character as the BJH pore size distribution of the respective samples (seeFig. 6).
4. Conclusions
In summary, the mechanochemical approach proved to be a reliable and effective strategy for the synthesis of robust metal–or-ganic frameworks. The capability of this method was demonstrated for the synthesis of MOF-14. The influence of an activation proce-dure on the pore structure and specific surface area was investi-gated. The initially relatively low value of the BET surface area of the raw material is accompanied with a micropore blocking effect due to remaining molecules of acetic acid in the framework. The guest-molecules could easily be removed using one single post-synthesis activation step resulting in a material with a significantly
enhanced specific surface area proven by BET measurements. The cleaning of the micropores was evidenced by DFT calculations and the obtained micropore size distribution is in good agreement with the expected values based on the crystal structure.
The hysteresis loops in the isotherms of raw and activated MOF-14 indicate the existence of additional mesoporosity in the materi-als. The size distribution of the mesopores could be calculated by the BJH-model using the adsorption branch of the nitrogen iso-therms. The results show a decreasing mesopore volume and a redistribution of the sizes. These findings are supported by DFT cal-culations, showing a very similar pore size distribution for both materials compared to the results of the BJH method.
The activation procedure for MOF-14 shows different features compared to HKUST-1 and it is separated into two steps. The first aspect consists of cleaning the micropores and results in the enhancement of the specific surface area of the sample. Simulta-neously, the activation leads to a decreasing mesopore size and number, causing a reduced hysteresis loop of the measured iso-therm. Regarding the mesopore size distributions of raw and acti-vated MOF-14 samples, it can be concluded that the agglomerates formed during the mechanochemical synthesis are more stable than those in the case of HKUST-1. The activation leads to an increasing crystallite size of the material, and presumably to a modified assembly of agglomerates.
Acknowledgements
We thank A. Zimathies for gas adsorption measurements, T. Gnutzmann and A. Kohl for spectroscopic investigations, and B. Unger for performing DTA/DTG/MS measurements.
Appendix A. Supplementary data
Supplementary data associated with this article can be found, in the online version, atdoi:10.1016/j.micromeso.2011.11.039. References
[1] P. Horcajada, C. Serre, M. Vallet-Regi, M. Sebban, F. Taulelle, G. Ferey, Angew. Chem., Int. Ed. 45 (2006) 5974.
[2] O.M. Yaghi, M. O’Keeffe, N.W. Ockwig, H.K. Chae, M. Eddaoudi, J. Kim, Nature 423 (2003) 705.
[3] G. Ferey, Chem. Soc. Rev. 37 (2008) 191.
[4] U. Mueller, M. Schubert, F. Teich, H. Puetter, K. Schierle-Arndt, J. Pastre, J. Mater. Chem. 16 (2006) 626.
[5] G. Ferey, C. Mellot-Draznieks, C. Serre, F. Millange, J. Dutour, S. Surble, I. Margiolaki, Science 309 (2005) 2040.
[6] B. Panella, M. Hirscher, Adv. Mater. 17 (2005) 538.
[7] T. Düren, F. Millange, G. Ferey, K.S. Walton, R.Q. Snurr, J. Phys. Chem. C 111 (2007) 15350.
[8] Z. Zhao, Z. Li, Y.S. Lin, Ind. Eng. Chem. Res. 48 (2009) 10015. [9] A. Pichon, A. Lazuen-Garay, S.L. James, CrystEngComm 8 (2006) 211. [10] D. Braga, S.L. Giaffreda, F. Grepioni, A. Pettersen, L. Maini, M. Curzi, M. Polito,
Dalton Trans. (2006) 1249.
[11] D. Braga, M. Curzi, A. Johansson, M. Polito, K. Rubini, F. Grepioni, Angew. Chem., Int. Ed. 45 (2006) 142.
[12] A.L. Garay, A. Pichon, S.L. James, Chem. Soc. Rev. 36 (2007) 846. [13] G. Kaupp, J. Schmeyers, J. Boy, Chemosphere 43 (2001) 55.
[14] B.L. Chen, M. Eddaoudi, S.T. Hyde, M. O’Keeffe, O.M. Yaghi, Science 291 (2001) 1021.
[15] S.S.Y. Chui, S.M.F. Lo, J.P.H. Charmant, A.G. Orpen, I.D. Williams, Science 283 (1999) 1148.
[16] L. Alaerts, E. Seguin, H. Poelman, F. Thibault-Starzyk, P.A. Jacobs, D.E. De Vos, Chem. Eur. J. 12 (2006) 7353.
[17] B. Panella, M. Hirscher, H. Putter, U. Muller, Adv. Funct. Mater. 16 (2006) 520. [18] A.G. Wong-Foy, A.J. Matzger, O.M. Yaghi, J. Am. Chem. Soc. 128 (2006) 3494. [19] O.K. Farha, A.M. Spokoyny, K.L. Mulfort, S. Galli, J.T. Hupp, C.A. Mirkin, Small 5
(2009) 1727.
[20] H.J. Lee, W. Cho, S. Jung, M. Oh, Adv. Mater. 21 (2009) 674.
[21] M. Klimakow, P. Klobes, A.F. Thunemann, K. Rademann, F. Emmerling, Chem. Mater. 22 (2010) 5216.
[22] S. Brunauer, P.H. Emmett, E. Teller, J. Am. Chem. Soc. 60 (1938) 309. [23] J. Rouquerol, P. Llewellyn, F. Rouquerol, F. Rodriquez-Reinoso, P.L. Llewellyn, N.
Seaton, Studies in Surface Science and Catalysis, vol. 160, Elsevier, 2007, p. 49.
Fig. 5.Micropore size distribution of MOF-14 samples before and after activation.
Fig. 6.Calculated pore size distributions using DTF method for as synthesized (black) and activated (red) MOF-14 samples in comparison to results obtained by BJH method (blue). (For interpretation of the references to color in this figure legend, the reader is referred to the web version of this article.)
[24] K.S. Walton, R.Q. Snurr, J. Am. Chem. Soc. 129 (2007) 8552.
[25] H. Furukawa, Y.B. Go, N. Ko, Y.K. Park, F.J. Uribe-Romo, J. Kim, M. O’Keeffe, O.M. Yaghi, Inorg. Chem. 50 (2011) 9147.
[26] B. Mu, F. Li, K.S. Walton, Chem. Commun. (2009) 2493.
[27] K.S.W. Sing, D.H. Everett, R.A.W. Haul, L. Moscou, R.A. Pierotti, J. Rouquerol, T. Siemieniewska, Pure Appl. Chem. 57 (1985) 603.
[28] L. Sarkisov, P.A. Monson, Langmuir 17 (2001) 7600. [29] P.I. Ravikovitch, A.V. Neimark, Langmuir 18 (2002) 9830.
[30] S.P. Rigby, R.S. Fletcher, J. Phys. Chem. B 108 (2004) 4690.
[31] M. Thommes, B. Smarsly, M. Groenewolt, P.I. Ravikovitch, A.V. Neimark, Langmuir 22 (2006) 756.
[32] E.P. Barrett, L.G. Joyner, P.P. Halenda, J. Am. Chem. Soc. 73 (1951) 373. [33] A. Sonnauer, F. Hoffmann, M. Froba, L. Kienle, V. Duppel, M. Thommes, C. Serre,
G. Ferey, N. Stock, Angew. Chem., Int. Ed. 48 (2009) 3791.
[34] J. Moellmer, E.B. Celer, R. Luebke, A.J. Cairns, R. Staudt, M. Eddaoudi, M. Thommes, Micropor. Mesopor. Mater. 129 (2010) 345.