Working Paper Series
25/2019
Louison Cahen-Fourot
Emanuele Campiglio
Elena Dawkins
Antoine Godin
Eric Kemp-Benedict
Looking for the inverted pyramid:
An application using input-output networks
Looking for the inverted pyramid: An application using
input-output networks
∗
Louison Cahen-Fourot
1, Emanuele Campiglio
1,2, Elena Dawkins
3, Antoine Godin
4,5and Eric Kemp-Benedict
†31
Institute for Ecological Economics, Vienna University of Economics and Business
2Grantham Research Institute, London School of Economics and Political Science
3
Stockholm Environment Institute
4Agence Fran¸caise de D´
eveloppement
5
Institut f¨
ur Makro¨
okonomie und Konjunkturforschung
This version: April 2019
Abstract
Herman Daly’s view of the economy as an “inverted pyramid” sitting on top of essential raw material inputs is compelling, but not readily visible in monetary data, as the contribution of primary sectors to value added is typically low. This article argues that “forward linkages”, a classical development theory concept capturing the relevance of a sector for downstream activities, is a more appropriate measure to identify key sectors. Using Input-Output (IO) data from eighteen European countries, we identify mining as the sector with the highest average forward linkages, and confirm the consistency of this result across countries via cluster analysis. By treating IO tables as the adjacency matrix of a directed network, we then build and visualise national inverted pyramid networks, and analyse their structure. Our approach highlights the key importance of natural resources in providing the necessary inputs to modern European economies.
Keywords: inverted pyramid; input-output; networks; forward linkages; natural resources
JEL codes: C67; O10; Q32; Q57
∗The research leading to these results has received funding from the Swedish Foundation for Strategic
Environmen-tal Research (Mistra) and the Oesterreichische Nationalbank (OeNB). The authors are grateful to Hanspeter Wieland for useful comments. The usual disclaimer applies.
1
Introduction
Herman Daly portrayed the economy as an “inverted pyramid”, a vast and complex structure of human activities balanced on a narrow input of natural resources (Daly, 1995; Kemp-Benedict, 2014). As the raw materials embedded in intermediate products progress from extraction, to processing, to manufacture, to wholesale, to retail and final consumption, firms combine those products with labor and capital to create an expanding array of valued goods and services (Ayres and Warr, 2010). The inverted pyramid is a compelling image, and it motivates a core idea in ecological economics: the contribution of raw materials to the economic system is far more essential than what the GDP share of extractive sectors would suggest. While high value-added activities in modern economies are usually situated in tertiary sectors, they ultimately rely on the initial extraction of physical matter to which value is gradually added. More generally, when analysing the structure and dynamics of economic systems, one cannot abstract from their material basis (Georgescu-Roegen, 1971; Common and Stagl, 2005).
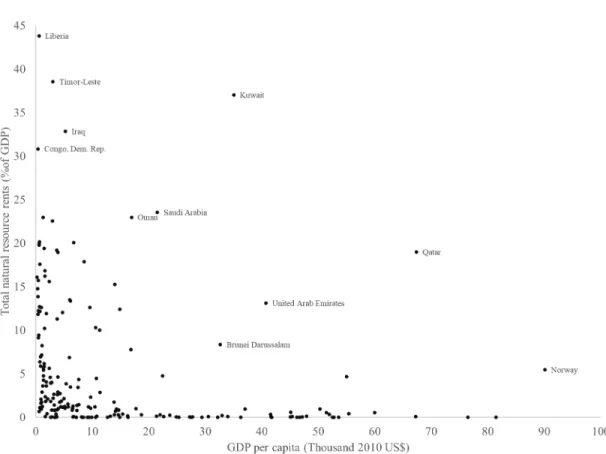
The crucial role of physical natural inputs in supporting the economic system can be easily shown when tracking material flows using physical values, as in the material flow analysis (MFA) and social metabolism strands of literature (Ayres and Kneese, 1969; Brunner et al., 2016; Fischer-Kowalski and Haberl, 2007). However, those studies emphasize physical conservation laws rather than measures of economic value, so rather than an expanding inverted pyramid, MFA and social metabolism diagrams contract as materials and energy are lost or degraded (e.g., Fig. 2.12 in Brunner et al., 2016). In monetary terms, the contribution of extractive and other primary sectors as measured by value added is typically low, and tends to be lower in larger economies. With few exceptions, high-income countries have attained their status through diversification, mainly in manufacturing (Rodrik, 2014). High-productivity natural resource sectors, such as mining, cannot absorb sufficient labor to act as an engine of growth (McMillan and Rodrik, 2011). This “stylized fact” of growth and structural change is illustrated in Fig. 1: there is a clear inverse relationship between natural resources rents and GDP per capita. Only a handful of oil-rich countries (e.g Qatar), have managed to transform large resource rents into high levels of income per capita.
Stylized facts thus appear to suggest that natural resource sectors are relatively unimportant in high-income countries; possibly, theyhave to reduce their economic significance in order for the economic system to progress. In an important sense that is true: natural resource sectors provide relatively less employment and purchasing power and contribute less to growth. However, it is important to note how all economies - economically developed or not - ultimately rely on natural resources for their existence. The reason for the comparatively low value added from natural resource sectors was identified by Daly (p. 453 1995, emphasis added),
Useful structure is added to matter/energy (natural resource flows) by the agency of labor and capital stocks. The value of this useful structure imparted by labor and capital is called “value added” by economists. This value added is what is “consumed,” i.e. used up in consumption. New value needs to be added again by the agency of labor and capital before it can be consumed again. That to which value is being added is the flow of natural resources, conceived ultimately as the indestructible building blocks of nature.
Thus, the more elaborate the economy, the more value is added downstream of the natural resource sectors, and the smaller the share of those sectors in the total.
Daly’s argument is structural, so a structural measure of the relative importance of different sectors is likely to be more revealing than a quantity measure such as value added. More specifically, the classical development theory concept of “forward linkages” aligns well with his inverted pyramid
Figure 1: Natural resource rents as a share of GDP vs. GDP per capita, in 2015 (Data from the World Development Indicators).
metaphor. As defined by Hirschman (1958), forward linkages will, through the provision of outputs of a sector, “induce attempts to utilize its outputs as inputs in some new activities.” In contrast, “backward linkages” will, through demand for inputs, “induce attempts to supply through domestic production the inputs needed in that activity”. Sectors that display high forward linkages thus identify activities and products that sustain the rest of the economic structure via the provisioning of inputs that are essential to other productive sectors (Aldasoro and Angeloni, 2015; Antr`as et al., 2012).
With this concept, we can convert Daly’s metaphor into a set of hypotheses: H1) we expect natural resource sectors to have high forward linkages; H2) we expect this result to be consistent across countries, including highly industrialized ones; H3) we expect sectoral forward linkages to be negatively correlated with value added measures.
This article provides evidence that, for a set of eighteen European countries, each of these hy-potheses holds true.1 First, we employ Input-Output data and techniques to calculate sectoral
forward linkages for all the countries in our sample. We show that, despite accounting for relatively low shares of value added, the products of the mining sector (coal, crude petroleum, natural gas, metals, minerals, and other mining products) are on average the most crucial inputs generating
1Daly focused his attention particularly on high-income countries where natural resources were comparatively
unimportant in terms of value added. European countries fit this criterion while offering a wide range of size and structure.
downstream economic activity. Second, we use forward linkage results to carry out a cluster analysis to identify structural similarities and differences between the countries in our set. We find that, for the most part, economic diversification is achieved downstream of natural resource sectors. Mining appears to be a “core sector” across clusters, in that its forward linkage values exhibit little variation across countries. In other words, mining has consistently high forward linkages across all the coun-tries in the sample. The distinctive traits of economic systems, resulting from innovation, historical contingency, or national planning, are more visible elsewhere. Third, we show that sectoral value added and forward linkages are significantly and negatively correlated, consistent with Hypothesis H3.
On the basis of these results, which, despite the use of monetary variables, clearly identify material inputs as crucial for sustaining downstream economic activity, we build and visualise the inverted pyramids lying on mining products. We do so by treating national IO tables as adjacency matrices for directed weighted networks, in a spirit similar to Bl¨ochl et al. (2011) and Acemoglu et al. (2016). We implement a selection algorithm that allows us to create layers of sectors depending on their proximity to mining in the network. We observe that six to seven sectors almost always compose the first layer,i.e. mining input intensive sectors. The second and further layers are more diverse across countries and less material intensive.
The main purpose of this paper is theoretical: to give a concrete demonstration of Daly’s concep-tion of the economy. However, our results have practical implicaconcep-tions as well. The forward linkages measure reveals the structural importance of natural resource sectors, along with other sectors. Such sectors are usually characterised by low value added, but support a wide array of economic activi-ties, either directly or indirectly. A measure of forward linkages is therefore complementary to value added when evaluating the strategic importance of sectors to the national economy. The inverted pyramid view of the economy also highlights the challenge of transforming an economy from a non-renewable resource base to one based on non-renewable resources. A shift to non-renewables affects not only the resource sector itself, but downstream sectors as well that currently depend on nonrenewable resources. We pursue this idea in a separate paper in the context of asset stranding in the course of a low-carbon transition (Cahen-Fourot et al., 2019).
The remainder of the article is organised as follows. Section 2 presents our methodological approaches. Section 3 discusses the results for sectoral forward linkages in our country sample, performs the cluster analysis and calculates the correlation between forward linkages and value added. Section 4 presents and analyses the inverted pyramid networks. Finally, section 5 discusses future research avenues and concludes.
2
Theoretical background, methods and data
In this article, we employ three main methodological approaches to develop an analysis of the con-tribution of material inputs to economic systems. First, we draw on concepts from classical develop-ment theory to provide a measure of the relevance of productive sectors in supporting downstream economic activity. Second, we employ principal component analysis (PCA) and clustering to offer a perspective on the underlying economic structures. Third, we borrow concepts and techniques from network analysis to construct, visualise and study national inverted pyramid structures. The background to each of these approaches is given in the following subsections.
Intermediate uses Final uses (f )
Total use (TU) Inter-Industry matrix (Z) Sector A Sector B Cons. Inv. Exp.
Production Sector A Products of A used as inputs by A Products of A used as inputs by B
Final use of products by A
Total use of products of A Sector B Products of B used as inputs by A Products of B used as inputs by B
Final use of products by B
Total use of products of
B
Total Total intermediate inputs Total final uses Total uses
Value added (v)
Comp. of employees
Total value added Cons. of
fixed capital Operating
surplus
Output Total domestic output
Imports Total imports
Total supply (TS) Total supply
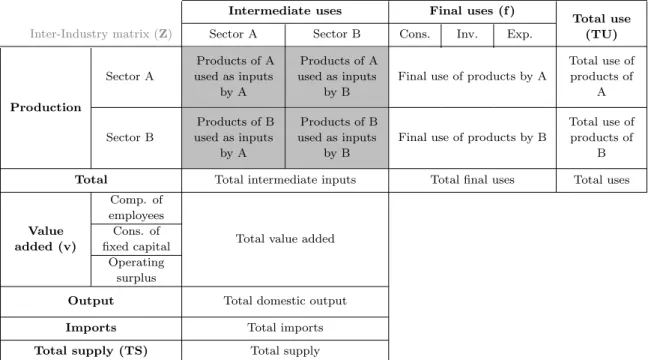
Table 1: A stylised Input-Output (IO) table (Cahen-Fourot et al., 2019).
2.1
Forward linkages
The concepts of sectoral “backward linkages” and “forward linkages” refer to the relevance of produc-tive activities in stimulating the production of necessary inputs by upstream sectors or in stimulating the use of their outputs by downstream sectors (Streeten, 1959). The strength of both backward and forward linkages can be estimated using IO data tables, of which Table 1 provides a stylised representation. Input-output (IO) tables are a useful representation of the economy, describing the domestic production processes and the transactions in products of the national economy in detail (Eurostat, 2008). The inter-industry matrixZ, where all the monetary transactions of intermediate goods and services among industrial sectors are displayed, is complemented by a set of columns vectors representing final demandf and by a set of row vectors representing value added items, or “primary inputs”,v. Miller and Blair (2009) and Eurostat (2008) provide a detailed description of the methodology used to compile IO databases.
IO tables are often used to estimate the direct and indirect effects of final demand changes using the Leontief matrix (Leontief, 1951). The Leontief model can be also used to calculate regional environmental footprints (e.g., carbon footprinting: see Minx et al., 2009). In matrix notation, the Leontief matrix isL= (I−A)−1, whereIis the identity matrix,A=Zˆx−1is the matrix of technical coefficients2andxrepresents either domestic output or total supply (depending on whether the IO
table is domestic only or also includes imports). Each elementli,jofLrecords the direct and indirect
amount of a specific input produced in sectorirequired to satisfy an additional unit of demand for a specific output produced in sectorj. The column sum of the Leontief matrix provides a widely-accepted measure of backward linkages. First introduced by Rasmussen (1956), it gives the increase in total output due to a unit increase in final demand for a sector’s production.
Rasmussen (1956) also introduced the row sum of the Leontief inverse as a measure of forward
linkages. However, this approach has been criticized as at best an indirect measure that treats forward linkages as the total backward linkages to which a sector contributes, rather than directly calculating forward linkages (Beyers, 1976). Cella (1984) provides a consistent measure of both backward and forward linkages that can be summed to give a measure of total linkages without double-counting. However, the implicit definition of forward linkages – the output from the sector required to support the rest of the economy, and the indirect contribution of that output back to the rest of the economy – reflects downstream demand rather than upstream supply.
The Ghosh input-output system (Ghosh, 1958) provides a better measure of forward linkages for the purposes of this paper (Jones, 1976; Antr`as et al., 2012; Aldasoro and Angeloni, 2015). The Ghosh model defines a matrix B=ˆx−1Zof allocation coefficients rather than a matrixA of
technical coefficients. Elementsbi,j ofBrepresent the allocation of the output produced in sectori
to sectorj. The Ghosh matrix is then defined as:
G= (I−B)−1 (1)
Each elementgi,j ofGcan be interpreted as the additional production taking place in sectorj
due to a unit increase in primary inputs employed in sectori. The column sum of the Ghosh matrix transpose GT (or, alternatively, the row sum of the Ghosh matrix G) measures sectoral forward
linkages as the increase in total output due to a unit increase in primary inputs of a sector. Following Miller and Blair (2009), we obtain normalised forward linkages by dividing sectoral forward linkages by the average forward linkages across all sectors:
FLi= Pn i=1gij (1/n)Pn i=1 Pn j=1gij = nGi iTGi, (2)
where FLi represents the normalised forward linkages for sectori,gij indicates the element ofGin
rowi and column j, n is the dimension ofG, and iis a column vector of 1’s of dimension n3. A value higher than 1 means that sectorihas higher forward linkages than the average across sectors. The Ghosh system has been criticised as a model of the economy (e.g., Oosterhaven, 1988). Indeed, treating value added (or primary inputs) as a driving variable is problematic, because value added is the money paid for the use of inputs, rather than the inputs themselves. In this paper we do not take the Ghosh system as a behavioral model. Instead, following a path laid down by others, we use it to understand economic structure. In particular, we use it to identify those sectors which provide essential inputs to the economy.
2.2
Clustering
After having compiled sectoral forward linkages, we use national rankings of sectors to study whether there are statistically identifiable clusters of similar countries. The inverted pyramid view of the economy suggests that natural resource sectors will not be among the sectors that characterise clusters, because all countries rely on them (Hypothesis H2). To test this assumption, we apply a hierarchical-consolidated clustering after a principal components analysis (PCA).
Clustering is a way to identify similarities between individuals characterized by (in our case) quantitative variables and to classify them into classes. We use a mixed method combining hier-archical clustering and consolidation of the classes using the k-means algorithm. The hierarchical clustering identifies clusters of individual countries based on a measure of distance. The latter is
3The column sum of a matrix can be computed by pre-multiplying it byiT; the row sum of a matrix can be
interpreted as the similarity between individuals as the whole sample of individuals is projected upon an Euclidean space. The closer two individuals on the plane, the more similar they are. If several planes are considered (depending on the dimensions selected), classes are determined by the posi-tions on the whole set of planes. At each step, two individuals or groups of individuals are grouped together until the growth of the intra-cluster “inertia” (the variance within one cluster) and the re-duction of the between-cluster inertia (the variance between clusters) are minimized. The partition obtained is then used as the initial number of clusters for the consolidatingk-means algorithm. At each step the centre of gravity of each cluster is computed and the individuals are reassigned to the class whose centre of gravity they are the closest to. This process continues until the ratio between between-cluster inertia and total inertia, which measures the quality of the partitioning, is higher than the one obtained at the previous step. Combining these two clustering methods improves the homogeneity of each cluster (Husson et al., 2017).
Prior to the clustering we implement two preparatory steps. First, to correct for missing data, we use an iterative PCA algorithm to impute missing values (Josse and Husson, 2016). The imputed values are introduced in such a way that they should not affect the identification of the principal components, while providing a full dataset for clustering. One thousand imputations were performed to check for the consistency of the imputed values. Second, we apply a PCA to our entire dataset. PCA is a method to synthesize large datasets into fewer dimensions (the principal components). Applying a PCA before a clustering makes the latter clearer and more stable (Husson et al., 2010). Each component is a linear combination of the raw variables and is orthogonal to the others. It means that, when ordered by their explanatory power, each one of them synthesizes a decreasing yet supplementary part of the total variance (or inertia) of the raw data (Le Roux and Rouanet, 2005; Vyas and Kumaranayake, 2006). As a prior step to clustering, PCA removes noise from the data,
i.e. the components summing up only residual information. To do so, we keep only the components carrying an information greater than those obtained by the 0.95-quantile of random distributions;
i.e. the components carrying a statistically significant information at the 5% level. The clustering is thus performed only upon the relevant information contained in our dataset.
2.3
Input-output networks
To provide a visual illustration of the inverted pyramid and identify the sectors that are most reliant on the primary sectors, we take the Ghosh matrixGfor each country and treat it as an adjacency matrix for a directed network. An adjacency matrix is simply a square matrix representing a finite graph whose elements indicate if pairs of vertices – in our case, productive sectors – are adjacent or not on the graph. If the corresponding element of the matrix is different from zero, a link (or “edge”) connects the two sectors. The network is directed, as each element of the matrix represents a monetary flow with a specific direction, moving from one sector to another. Inter-industry matrices – and thus Ghosh matrices – are typically dense, because most sectors have some kind of monetary interaction with all other sectors, both as providers of intermediate outputs or as purchasers of intermediate inputs. To reduce the resulting complexity, we retain only the topqpercentile of edges starting in a specific sector.
After simplifying the graph by removing self-loops (use by the sector of its own product), we construct the inverted pyramid networks as follows. We first specify a sector to sit at the “bottom” of the pyramid; here we focus on the extractive industries, aggregated into sector B (mining and quarrying), as the activities with the highest forward linkages. We then explore their outward connections, i.e. the transactions flowing out of the sector and towards other sectors. We retain only the ones within the top q percentile in terms of edges’ weight. From this, we can identify
Sector code Sector description
A Agriculture, forestry and fishing B Mining and quarrying
C Manufacturing
D Electricity, gas, steam and air conditioning
E Water supply; sewerage; waste management and remediation activities F Constructions and construction works
G Wholesale and retail trade; repair of motor vehicles and motorcycles H Transportation and storage
I Accommodation and food service activities J Information and communication
K Financial and insurance activities L Real estate activities
M Professional, scientific and technical activities N Administrative and support service activities
O Public administration and defence; compulsory social security P Education
Q Human health and social work activities R Arts, entertainment and recreation S Other services activities
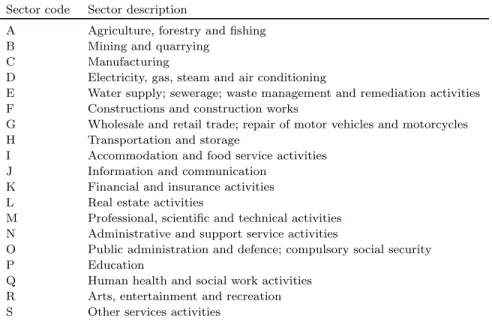
Table 2: NACE revision 2 level 1 sectors.
the immediate neighbourhood of the bottom of the pyramid, consisting of the sectors for which the starting sector provides relevant inputs. We repeat the procedure for the sectors in this first layer. The second layer is composed of is particular relevant in providing crucial direct or indirect intermediate inputs. We continue this procedure until all sectors that can be connected have been connected4.
3
Sectoral forward linkages for European countries
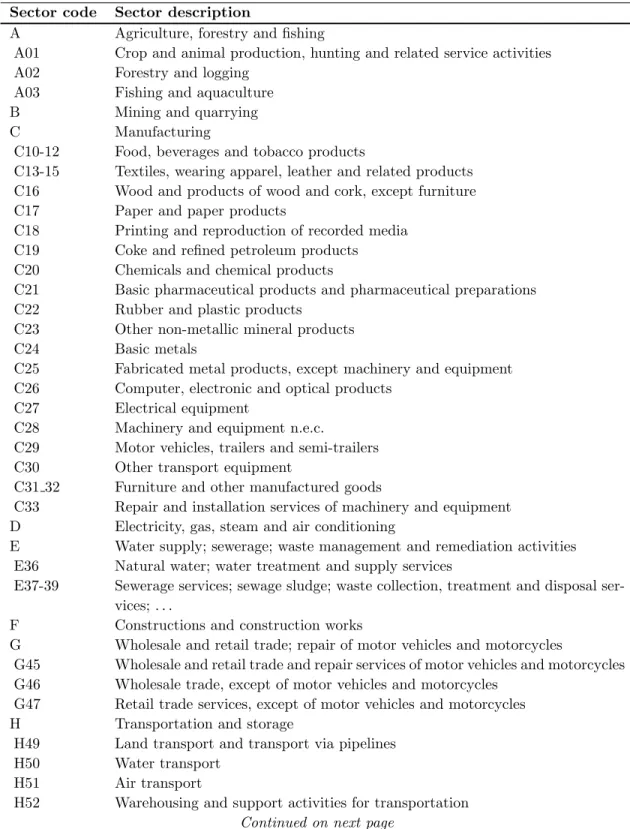
We analyse a sample of eighteen European countries (see Table A1) with 2010 IO data from Eu-rostat5. Sectors are classified using the NACE rev.2 classification system (see Table 2 for the level
1 categories, and Table A2 in the appendix for more details). We categorise the sectors as either primary, secondary and tertiary sectors to make sense of the clustering results (see Table A3)6. We
report results for the “total” rather than the “domestic” IO tables as they better capture the relative importance of inputs into the economy, regardless of whether they were produced domestically or imported. Accordingly, we use “total supply at basic prices” (TS) as our output measure (x) when computing the Ghosh matrix and forward linkages. The value added data for 2010 for all eighteen European countries are taken from Eurostat7.
For reasons of space, we will here present summary results for the entire sample of countries, or the results for only a selection of them. The entire set of results, as well as the code used to obtain
4While the network is fully connected, the process of constructing the inverted pyramid diagrams includes only
relevant outward connections from one neighbourhood to the next. Some sectors have only outward connections and are not reached through this process; others are reached only by less significant edges (i.e. outside theqpercentile for all sectors in the network).
5Symmetric input-output table at basic prices (product by product) (naio 10 cp1700).
6Based on the definitions of the French National Institute of Statistics and Economic Administration (Insee). See:
www.insee.fr/en/metadonnees/definitions.
Sector Sector description FL Top 5
B Mining and quarrying 1.479 13
N78 Employment services 1.452 12
C18 Printing and recording services 1.442 11 M69 70 Legal and accounting services; Services of head offices;
man-agement consulting services
1.406 3 H52 Warehousing and support services for transportation 1.387 4 H53 Postal and courier services 1.359 3 M73 Advertising and market research services 1.359 4 K66 Services auxiliary to financial services and insurance
ser-vices
1.347 8 N77 Rental and leasing services 1.342 3 N80-82 Security and investigation services; buildings and
land-scape; office support services
1.312 6 Table 3: Normalised forward linkages (GDP-weighted average; top 10 sectors). Germany Spain France Italy United Kingdom N79 (1.757) C18 (1.611) B (1.64) C18 (1.575) N79 (1.596) K66 (1.556) B (1.581) K66 (1.565) E37-39 (1.434) C33 (1.504) H52 (1.549) N78 (1.564) C18 (1.564) D (1.43) H52 (1.488) M69 70 (1.504) H53 (1.522) N78 (1.458) M71 (1.427) C16 (1.469) N77 (1.491) D (1.443) N80-82 (1.412) B (1.426) N78 (1.467) .. .. .. .. .. C31 32 (0.601) I (0.571) Q86 (0.546) P (0.542) R93 (0.64) Q86 (0.565) O (0.532) M72 (0.544) Q86 (0.539) O (0.634) M72 (0.543) M72 (0.519) L68A (0.53) S96 (0.538) Q86 (0.592) Q87 88 (0.541) Q87 88 (0.506) O (0.53) O (0.507) G47 (0.539) L68A (0.536) L68A (0.505) Q87 88 (0.53) L68A (0.493) L68A (0.539)
Table 4: Top and bottom 5 sectors in selected European economies. them, is available online8.
3.1
National sectoral rankings
We compute normalised forward linkages for our entire sample of countries using Eq.(2). Table 3 reports the top 10 sectors in terms of average normalised forward linkages (FL), weighted by national GDP values. The sectors in the ranking represent key activities upon which downstream economic activity rely. The “Top 5” column reports the number of countries in which the sector appears among the top 5 sectors in the ranking. Table 4 offers a more detailed look at the rankings for the largest European economies, (representing together approximately 80% of the GDP of the entire sample) showing both the top and the bottom 5 sectors in the rankings.
The mining and quarrying sector (B), which more than any other sector represents the intro-duction of raw material inputs into the economic system, is the economic activity with the largest
average forward linkages. The sector appears in the top 5 of thirteen countries, and in first position for France, Croatia, Latvia and Austria. Even when not appearing among the top sectors, it has values higher than 1 for all countries. This finding is consistent with Hypothesis H1.
The rest of the ranking is strongly oriented towards services, and in particular towards activities whose services are widely used as intermediary inputs by other economic sectors, and often char-acterised by highly-skilled labour content (e.g. legal services, advertising, postal services, services auxiliary to finance, and others). This is consistent with the biophysical view of the economy. The “raw material”, in this case, is human labor. By providing specialized services to multiple firms, ser-vice bureaus generate efficiency gains from division of labor. In contrast, natural resources must be upstream out of physical necessity. Indeed, human labor requires natural resources, which Costanza and Herendeen (1984) took explicitly into account in their calculation of embodied energy in the US economy.
Three further interesting result are offered by calculating sectoral forward linkages. First, with the exception of printing and recording services (C18), no other manufacturing sector appears in the overall ranking. The only relevant national exceptions are: wood and products of wood and cork, except furniture (C16), in the top 5 of Greece, Cyprus and United Kingdom; other non-metallic mineral products (C23) in the top 5 of Cyprus; and repair and installation services of machinery and equipment (C33) in top 5 of Belgium and United Kingdom (which could arguably be classified with intermediate services). Second, the only other primary sector frequently appearing among the sectors with the highest forward linkages is forestry, logging and related services (A02), in the top 10 of sectors for Germany, France, Austria, Poland and United Kingdom. However, due to its low forward linkage values for other countries (especially Greece and Cyprus), it does not make it into the overall ranking. In contrast, fishing and aquaculture (A03) tends to have low forward linkages (with the exception of Poland, where it appears in 11th position). Agriculture and hunting (A01) is in a similar situation, although with values usually higher than 1. Third, the lowest forward linkages are consistently associated with sectors such as: human health services (Q86); residential care and social work services (Q87 88); education (P); and public administration, defence, compulsory social security services (O), many of which also fall in the top 10 sectors in terms of value added. These sectors are characterised by labor-intensive economic activities providing welfare-enhancing services to individuals as final consumption items.
3.2
A typology of the European economies
To check whether natural resources sectors are a differentiating factor of the economies in our sample, we conduct a geometric analysis of data combining a principal components analysis and a mixed hierarchical-consolidated clustering, as explained in section 2.2. No outliers are detected when running the PCA and seven axes out of the seventeen identified are found to carry statistically significant information; these axes have an inertia (70.5%) greater than those obtained by the 0.95-quantile of random distributions (64.4%). The remaining 29.5% of the data are therefore deemed irrelevant for the clustering and removed. We impose a maximum of five clusters to obtain a meaningful typology. We perform the clustering analysis upon the seven axes identified by the PCA and identify four clusters.
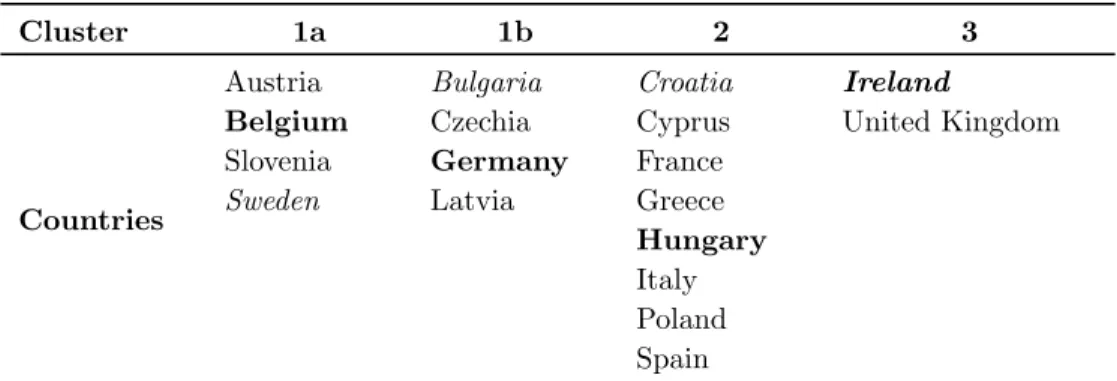
The countries in each cluster are shown in Table 5, and the sectors associated with each cluster are shown in Tables A3. As a result of the PCA and clustering techniques, what is most apparent from the results is what differentiates countries rather than what makes them similar. Since mining is important in terms of forward linkages for nearly all countries, only a few countries show a statistically significant difference in high or low forward linkages for this sector. Generally speaking,
Cluster 1a 1b 2 3
Countries
Austria Bulgaria Croatia Ireland
Belgium Czechia Cyprus United Kingdom Slovenia Germany France
Sweden Latvia Greece
Hungary
Italy Poland Spain
Table 5: Clusters of countries. Countries in boldare the most representative of their cluster (the closest to the barycentre of their cluster). Countries initalic that are the most distinctive from the other clusters (the farthest from the barycentres of the other clusters).
.
sectors that do not distinguish between different clusters can be comprehended as a common core: they have similar forward linkages across all countries and clusters. Natural resource sectors, and mining in particular, are part of that core; this is consistent with hypothesis H2.
Clusters are instead distinguished by the relative importance of sectors where the forward linkages are different and this tends to be the tertiary or secondary sectors. In clusters 1a and 1b, which we refer to as ‘service-based’ economies, the sectors with greater than average forward linkages are mostly tertiary. Cluster 1b is distinguished from cluster 1a by having a significantly lower-than-average value for agriculture. In cluster 2, composed by ‘manufacturing-based’ economies, the sectors with greater-than-average forward linkages are secondary sectors. Cluster 3, made of two ‘mixed’ economies, features greater- or lower-than-average forward linkages for different sets of tertiary and secondary sectors. Countries in this cluster also have lower-than-average forward linkages for the mining sector. As shown in Table 5, the most representative countries for clusters 1a, 1b, 2 and 3 are respectively Belgium, Germany, Hungary, and Ireland. The most distinctive are respectively Sweden, Bulgaria, Croatia and Ireland.
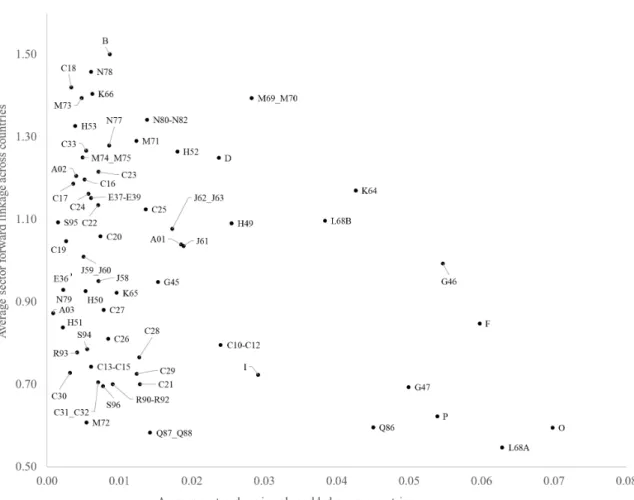
Table A3 shows the average share in value added of sectors across countries in a cluster and the average share in value added for sectors with above-average (+) and below-average (−) forward linkages. The results show that for cluster 2 (the manufacturing-based economies), sectors with higher than average forward linkages have a distinctly lower mean share in value added than the sectors with lower than average forward linkages. The same result holds, to a lesser extent, for clusters 1a and 1b (the service-based economies), and is very weak (if it holds at all) for cluster 3 (the mixed economies). Generally speaking, we can see an inverse relationship between forward linkages and the share in value added as shown on figure 2, which exhibits the correlation between the average share in value added and the average forward linkage each sector takes across all countries in our sample. The correlation coefficientρ=−0.34 is statistically significant at the 1% confidence level given the size of the sample (63 observations). This is confirmed by computing the correlation coefficient between the whole vector of sectors shares in value added and the whole vector of sectors forward linkages for all the countries. In that case the correlation coefficient is−0.27 and is once again significant at the 1% level, withn= 63×18 = 1134 for each series.
This finding is again consistent with the inverted pyramid hypothesis (Daly, 1995) and supports our Hypothesis H3: Material-intensive sectors towards the bottom of the pyramid – that is, sectors with higher forward linkages – also tend to have lower value added. For instance, sector B average
Figure 2: Sector share in value added and the sectoral forward linkages (average across countries). share of value added across countries is only 0.87%, ranked 29th of 63, while the average share in value added for all sectors is 1.57%.
4
The inverted pyramid networks
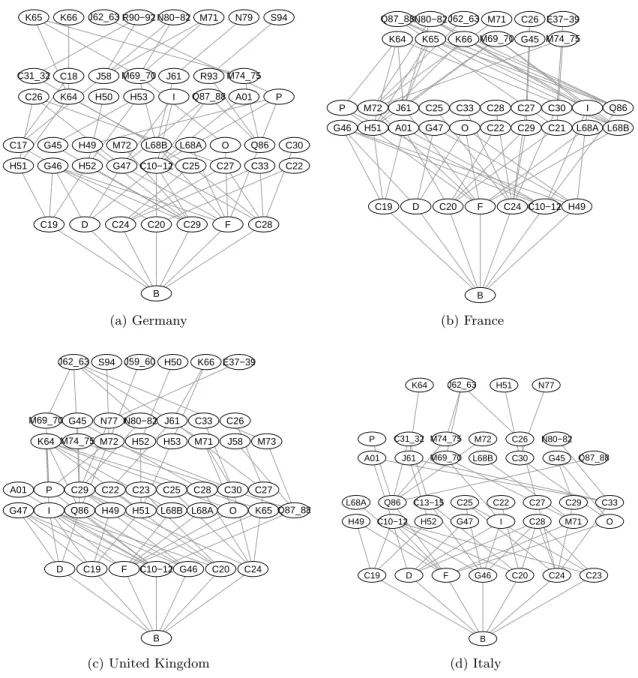
In this section we employ the method presented in section 2.3 to visualise and study national inverted pyramid networks. As argued in section 3.1, the mining and quarrying sector (B) appears to be the most relevant in terms of potential effects on downstream sectors. This result supports the choice to place sector B at the bottom of the inverted pyramid. Figure 3 shows the results of the procedure for the four largest countries of the sample in terms of GDP (representing approximately 71% of the GDP of the sample). The inverted pyramid shape is clearly visible. Through the provision of crucial intermediate inputs – either directly or indirectly – the mining sector supports a first layer composed of sectors whose production tends to be material intensive. The sectors in the first layer support a second layer of sectors, which support a third layer, and so on. For reasons of space, only the first four layers are shown in the figures.
The analysis of the pyramid networks highlight both common patterns across countries and peculiarities. Table 6 reports the modal layer for each sector, i.e. the layer in which the sector
B C19 D C24 C20 C29 F C28 H51 G46 H52 G47 C10−12 C25 C27 C33 C22 C17 G45 H49 M72 L68B L68A O Q86 C30 C26 K64 H50 H53 I Q87_88 A01 P C31_32 C18 J58 M69_70 J61 R93 M74_75 K65 K66 J62_63 R90−92 N80−82 M71 N79 S94 DE (a) Germany B C19 D C20 F C24 C10−12 H49 G46 H51 A01 G47 O C22 C29 C21 L68A L68B P M72 J61 C25 C33 C28 C27 C30 I Q86 K64 K65 K66 M69_70 G45 M74_75 Q87_88N80−82J62_63 M71 C26 E37−39 FR (b) France B D C19 F C10−12 G46 C20 C24 G47 I Q86 H49 H51 L68B L68A O K65 Q87_88 A01 P C29 C22 C23 C25 C28 C30 C27 K64 M74_75 M72 H52 H53 M71 J58 M73 M69_70 G45 N77 N80−82 J61 C33 C26 J62_63 S94 J59_60 H50 K66 E37−39 UK (c) United Kingdom B C19 D F G46 C20 C24 C23 H49 C10−12 H52 G47 I C28 M71 O L68A Q86 C13−15 C25 C22 C27 C29 C33 A01 J61 M69_70 L68B C30 G45 Q87_88 P C31_32 M74_75 M72 C26 N80−82 K64 J62_63 H51 N77 IT (d) Italy
Figure 3: Inverted pyramids for selected countries (q= 1).
most commonly appears within our sample of countries (sectors that appear in none or a very few pyramid networks are excluded from the table).
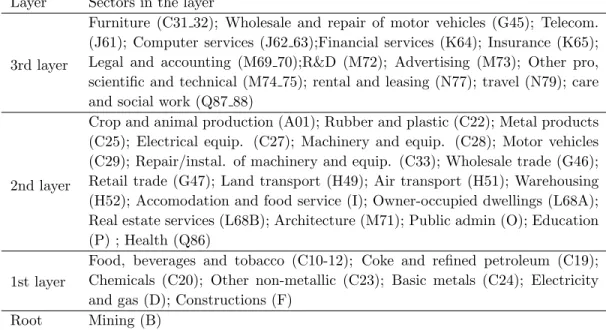
The first layer is typically composed of seven (sometimes six) sectors that heavily rely on mining products as intermediate inputs. In particular, the construction sector (F) appears in the first layer of all eighteen countries in our sample. It is followed by electricity and gas (D), appearing in sixteen countries; coke and refined petroleum products (C19), appearing in fourteen countries; and basic metals (C24), appearing in thirteen countries. The sectors in this first layer all receive strong direct inputs from the mining sector, with the exception of C10-12 (food, beverages, and tobacco). For the latter, mining products are particularly relevant via their contribution to the generation of electricity
and gas, of which the C10-12 sector is a large consumer (e.g. for refrigeration).
The second layer of the inverted pyramid networks is composed of sectors for which the production of first layer sectors is particularly relevant. The number of sectors in the layer varies across countries, ranging from ten (Cyprus) to twenty-three (Belgium), with an average of sixteen. Particularly common sectors in this layer are public administration (O), appearing in sixteen countries; metal products (C25) and retail trade (G47), each appearing in fourteen countries; electrical equipment (C27), machinery and equipment (C28) and real estate activities (L68A and L68B), each appearing in thirteen countries. It is relevant to notice the presence in this layer of several large predominantly public services (education, health activities, public administration), as well as another primary sector (A01: agriculture, forestry and fishing) and sectors in the transport industry. The presence of agriculture, a primary sector, in this layer is consistent with the substantial petrochemical and mineral inputs to industrial agriculture.
The third layer is still significant in size for all the countries, ranging from nine (Cyprus) to sixteen sectors (Austria). The sectors in this layer tend to produce high-skilled services. The most common include legal and accounting services and similar activities (M69 70) and financial services (K64), each appearing in twelve countries; telecommunications (J61), appearing in eleven countries; and residential and social work activities (Q87 88), appearing in ten countries.
The fourth layer starts being much less significant in terms of number of sectors, with the notable exception of Hungary, which displays fourteen sectors. This is even more the case for the fifth and further layers. Finally, it is interesting to note that several sectors do not appear at all in the inverted pyramid networks. These range from eleven (Germany) to thirty (Ireland). Particularly relevant among them are fishing and aquaculture (A03) and employment activities (N78), neither appearing in any of the countries of the sample; repair of goods (S95), appearing only in one country; crop, animal production and hunting (A01) and water services (E36), each appearing in only two countries. Their absence from the inverted pyramid network does not mean that they do not ultimately rely on material inputs; rather, in most countries in our sample they are not the receivers of any particularly relevant outward linkage from mining or its cascading sectors.
5
Conclusions
Herman Daly criticized value added as a measure of the economic significance of a sector because it hides the importance of raw materials and natural resources, which typically have low value added compared to other goods and services. This led to downplaying nature as the non-substitutable basis of our economies and societies. The present work proposed an alternative approach, using Input-Output monetary data for a sample of eighteen European countries. Adopting a forward linkages measure highlights the key importance of natural resources in providing the necessary inputs to modern European economies.
First, we confirm Daly’s intuition that raw materials sectors (particularly mining) have high forward linkages, especially when considering both domestic and imported intermediate goods (total supply). Network visualisation reveals the direction of raw material flows through the economy. These diagrams show an expanding cascade of influences through the economy, passing through a small number of processing industries to most of the rest of the economy. Having identified a sector with high forward linkages, the cascading “inverted pyramid” becomes evident. This is, indeed, the message Daly meant to convey. Highly industrialised economies produce diverse products, which draw on intermediate goods produced throughout the economy. The role of natural resources is usefully hidden by this activity. The purchaser of a steel bolt does not need to know anything
Layer Sectors in the layer 3rd layer
Furniture (C31 32); Wholesale and repair of motor vehicles (G45); Telecom. (J61); Computer services (J62 63);Financial services (K64); Insurance (K65); Legal and accounting (M69 70);R&D (M72); Advertising (M73); Other pro, scientific and technical (M74 75); rental and leasing (N77); travel (N79); care and social work (Q87 88)
2nd layer
Crop and animal production (A01); Rubber and plastic (C22); Metal products (C25); Electrical equip. (C27); Machinery and equip. (C28); Motor vehicles (C29); Repair/instal. of machinery and equip. (C33); Wholesale trade (G46); Retail trade (G47); Land transport (H49); Air transport (H51); Warehousing (H52); Accomodation and food service (I); Owner-occupied dwellings (L68A); Real estate services (L68B); Architecture (M71); Public admin (O); Education (P) ; Health (Q86)
1st layer
Food, beverages and tobacco (C10-12); Coke and refined petroleum (C19); Chemicals (C20); Other non-metallic (C23); Basic metals (C24); Electricity and gas (D); Constructions (F)
Root Mining (B)
Table 6: Modal layer for sectors.
about iron ore, how that ore was processed, or even if the bolt was made from recycled steel. Bolts are made to standard specifications and can be purchased from a catalog. Yet, the bolt could not exist if iron ore were not first extracted some time in the past. Second, using principal component analysis and clustering, we find that nearly all countries share a similar degree of forward linkage for mining, which is another indication of the importance of raw materials for the economy. They form distinct clusters based on the relative importance of secondary or tertiary sectors in providing forward linkages. Third, we also confirm another aspect of Daly’s inverted pyramid hypothesis: sectors with higher forward linkages tend to have lower value added.
From a methodological point of view, the essential insight from this exercise is therefore that an indicator derived from classical development economics – forward linkages – reveals much more than value added as a measure of the importance of natural resource inputs into modern economies. From a policy point of view, our work shows the degree to which countries rely on raw materials, even European economies that tend to be more services-based. We have shown that two measures of structure – forward linkages and clustering – provide complementary information to value added when assessing the strategic role of different sectors.
References
Acemoglu, D., U. Akcigit, and W. Kerr (2016). Networks and the macroeconomy: An empirical exploration. NBER Macroeconomics Annual 30(1), 273–335.
Aldasoro, I. n. and I. Angeloni (2015). Input–output-based measures of systemic importance. Quan-titative Finance 15(4), 589–606.
Antr`as, P., D. Chor, T. Fally, and R. Hillberry (2012, May). Measuring the Upstreamness of Production and Trade Flows. American Economic Review 102(3), 412–416.
Ayres, R. U. and A. V. Kneese (1969). Production, Consumption, and Externalities. The American Economic Review 59(3), 282–297.
Ayres, R. U. and B. Warr (2010, January). The Economic Growth Engine: How Energy and Work Drive Material Prosperity. Edward Elgar Publishing.
Beyers, W. B. (1976, April). Empirical identification of key sectors: Some further evidence. Envi-ronment and Planning A: Economy and Space 8(2), 231–236.
Bl¨ochl, F., F. J. Theis, F. Vega-Redondo, and E. O. Fisher (2011, April). Vertex centralities in input-output networks reveal the structure of modern economies. Physical Review E 83(4), 046127. Brunner, P. H., H. Rechberger, and H. Rechberger (2016, December). Handbook of Material Flow
Analysis: For Environmental, Resource, and Waste Engineers (2nd ed.). Boca Raton, FL, US: CRC Press.
Cahen-Fourot, L., E. Campiglio, E. Dawkins, A. Godin, and E. Kemp-Benedict (2019). Capital stranding cascades: The impact of decarbonisation on productive asset utilisation. WU Wien Institute for Ecological Economics Working Paper Series 18/2019.
Cella, G. (1984, May). The input-output measurement of interindustry linkages. Oxford Bulletin of Economics and Statistics 46(1), 73–84.
Common, M. and S. Stagl (2005). Ecological Economics: An Introduction. Cambridge University Press.
Costanza, R. and R. A. Herendeen (1984, June). Embodied energy and economic value in the United States economy: 1963, 1967 and 1972. Resources and Energy 6(2), 129–163.
Daly, H. E. (1995, December). Consumption and welfare: Two views of value added. Review of Social Economy 53(4), 451–473.
Eurostat (2008). Eurostat Manual of Supply, Use and Input-Output Tables. Methodologies and Working Papers, Eurostat, Luxembourg.
Fischer-Kowalski, M. and H. Haberl (2007). Socioecological Transitions and Global Change: Trajec-tories of Social Metabolism and Land Use. Edward Elgar Publishing.
Georgescu-Roegen, N. (1971). The Entropy Law and the Economic Process. Cambridge, MA: Harvard University Press.
Ghosh, A. (1958). Input-output approach in an allocation system. Economica 25(97), 58–64. Hirschman, A. O. (1958). The Strategy of Economic Development. New Haven, CT, USA: Yale
University Press.
Husson, F., J. Josse, and J. Pages (2010). Principal component methods - hierarchical clustering - partitional clustering: Why would we need to choose for visualizing data? Technical report, Agrocampus Ouest, Rennes, France.
Husson, F., S. Lˆe, and J. Pag`es (2017). Exploratory Multivariate Analysis by Example Using R. CRC Press.
Jones, L. P. (1976). The measurement of Hirschmanian linkages. The Quarterly Journal of Eco-nomics 90(2), 323–333.
Josse, J. and F. Husson (2016). missMDA: A Package for Handling Missing Values in Multivariate Data Analysis. Journal of Statistical Software 70(1), 1–31.
Kemp-Benedict, E. (2014, November). The inverted pyramid: A neo-Ricardian view on the econ-omy–environment relationship. Ecological Economics 107, 230–241.
Le Roux, B. and H. Rouanet (2005). Geometric Data Analysis. From Correspondence Analysis to Structured Data Analysis. Springer.
Leontief, W. W. (1951). The Structure of the American Economy, 1919-1939: An Empirical Appli-cation of Equilibrium Analysis (2nd ed.). New York: Oxford University Press.
McMillan, M. S. and D. Rodrik (2011, June). Globalization, structural change and productivity growth. Working Paper 17143, National Bureau of Economic Research.
Miller, R. E. and P. D. Blair (2009).Input-Output Analysis: Foundations and Extensions. Cambridge University Press.
Minx, J., T. Wiedmann, R. Wood, G. Peters, M. Lenzen, A. Owen, K. Scott, J. Barrett, K. Hubacek, G. Baiocchi, A. Paul, E. Dawkins, J. Briggs, D. Guan, S. Suh, and F. Ackerman (2009). In-put–output analysis and carbon footprinting: An overview of applications. Economic Systems Research 21(3), 187–216.
Oosterhaven, J. (1988). On the Plausibility of the Supply-Driven Input-Output Model. Journal of Regional Science 28(2), 203–217.
Rasmussen, P. N. (1956). Studies in Inter-Sectoral Relations. Amsterdam, the Netherlands: North-Holland.
Rodrik, D. (2014, May). The past, present, and future of economic growth. Challenge 57(3), 5–39. Streeten, P. (1959). Unbalanced growth. Oxford Economic Papers 11(2), 167–190.
Vyas, S. and L. Kumaranayake (2006). Constructing socio-economic status indices: How to use principal components analysis. Health Policy and Planning 21(6), 459–468. Lu et surlign´e.
A
Country codes
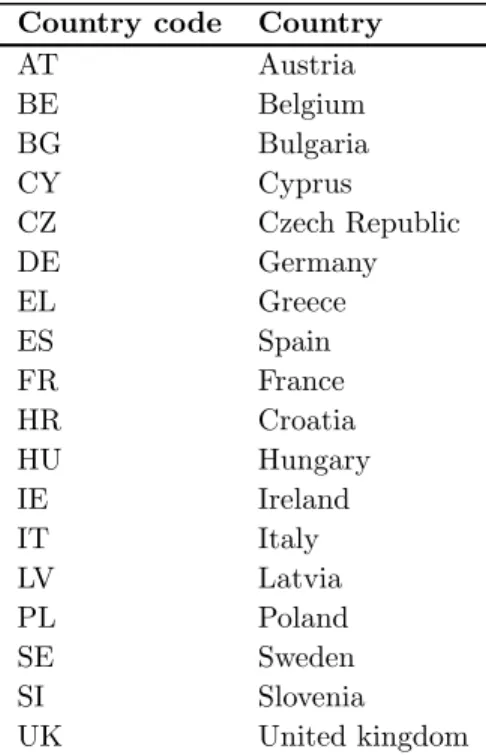
Table A1: Country codes
Country code Country
AT Austria BE Belgium BG Bulgaria CY Cyprus CZ Czech Republic DE Germany EL Greece ES Spain FR France HR Croatia HU Hungary IE Ireland IT Italy LV Latvia PL Poland SE Sweden SI Slovenia UK United kingdom
B
Sector codes and descriptions
Table A2: Sector codes and descriptions
Sector code Sector description
A Agriculture, forestry and fishing
A01 Crop and animal production, hunting and related service activities A02 Forestry and logging
A03 Fishing and aquaculture B Mining and quarrying C Manufacturing
C10-12 Food, beverages and tobacco products
C13-15 Textiles, wearing apparel, leather and related products C16 Wood and products of wood and cork, except furniture C17 Paper and paper products
C18 Printing and reproduction of recorded media C19 Coke and refined petroleum products C20 Chemicals and chemical products
C21 Basic pharmaceutical products and pharmaceutical preparations C22 Rubber and plastic products
C23 Other non-metallic mineral products C24 Basic metals
C25 Fabricated metal products, except machinery and equipment C26 Computer, electronic and optical products
C27 Electrical equipment
C28 Machinery and equipment n.e.c.
C29 Motor vehicles, trailers and semi-trailers C30 Other transport equipment
C31 32 Furniture and other manufactured goods
C33 Repair and installation services of machinery and equipment D Electricity, gas, steam and air conditioning
E Water supply; sewerage; waste management and remediation activities E36 Natural water; water treatment and supply services
E37-39 Sewerage services; sewage sludge; waste collection, treatment and disposal ser-vices; . . .
F Constructions and construction works
G Wholesale and retail trade; repair of motor vehicles and motorcycles
G45 Wholesale and retail trade and repair services of motor vehicles and motorcycles G46 Wholesale trade, except of motor vehicles and motorcycles
G47 Retail trade services, except of motor vehicles and motorcycles H Transportation and storage
H49 Land transport and transport via pipelines H50 Water transport
H51 Air transport
H52 Warehousing and support activities for transportation
Table A2: Sector codes and descriptions (continued)
Sector code Sector description
H53 Postal and courier activities
I Accommodation and food service activities J Information and communication
J58 Publishing activities
J59 60 Motion picture, video and television production, sound recording, broadcasting, . . .
J61 Telecommunications
J62 63 Computer programming, consultancy; Information service activities K Financial and insurance activities
K64 Financial services, except insurance and pension funding
K65 Insurance, reinsurance and pension funding services, except compulsory social security
K66 Activities auxiliary to financial services and insurance services L Real estate activities
M Professional, scientific and technical activities
M69 70 Legal and accounting services; Activities of head offices; management consul-tancy activities
M71 Architectural and engineering activities; technical testing and analysis M72 Scientific research and development
M73 Advertising and market research
M74 75 Other professional, scientific and technical activities; Veterinary activities N Administrative and support service activities
N77 Rental and leasing activities N78 Employment activities
N79 Travel agency, tour operator and other reservation service and related activities N80-82 Security and investigation activities; buildings and landscape; office support O Public administration and defence; compulsory social security
O84 Public administration and defence; compulsory social security P Education
P85 Education
Q Human health and social work activities Q86 Human health activities
Q87 88 Residential care activities; social work activities without accommodation R Arts, entertainment and recreation
R90-92 Creative, arts and entertainment activities; libraries, museums, archives; gam-bling and betting
R93 Sports activities and amusement and recreation activities S Other services activities
S94 Activities of membership organisations
S95 Repair of computers and personal and household goods S96 Other personal service activities
C
Clusters
Table A3: Clusters and their characteristics
Cluster Code Sector Pos’n Test(p) V Aij V A+/−,j
1a H51 airtransport 3° 2.56(0.01) 0.18% 0.76% J59-J60 motionpic 3° 2.55(0.01) 0.43% E37-E39 sewerage 2° 2.54(0.01) 0.62% I accomodation 3° 2.54(0.01) 2.57% J58 publishing 3° 2.53(0.01) 0.50% C30 othertransport 2° 2.17(0.03) 0.28% C20 chemicals 2° -1.86(0.06) 1.02% 0.92% C24 metals 2° -2.00(0.05) 0.92% C19 coke 2° -2.05(0.04) 0.18% C27 electrical 2° -2.23(0.03) 1.22% H52 warehousing 3° -2.25(0.02) 1.69% C22 rubber 2° -2.56(0.01) 0.80% C17 paper 2° -3.18(0.00) 0.62% 1b K65 insurance 3° 2.37(0.02) 1.01% 0.87% K66 finauxiliary 3° 2.00(0.05) 0.40% S95 repairservices 3° 1.84(0.07) 0.22% J62-J63 programming 3° 1.82(0.07) 1.86% E36 water 2° -1.69(0.09) 0.36% 1.02% E37-E39 sewerage 2° -1.92(0.06) 0.69% C26 computer 2° -2.07(0.04) 0.80% C23 othernonmetal 2° -2.12(0.03) 0.87% C10-C12 food 2° -2.13(0.03) 2.51% H51 airtransport 3° -2.16(0.03) 0.17% C31-C32 furniture 2° -2.41(0.02) 0.74% C28 machinery 2° -2.50(0.01) 1.68% A01 agrihunt 1° -2.51(0.01) 1.97% N78 employment 3° -2.64(0.01) 0.40%
Table A3: Clusters and their characteristics (continued)
Cluster Code Sector Pos’n Test(p) V Aij V A+/−,j
2 C24 metals 2° 3.38(0.00) 0.41% 1.28% C22 rubber 2° 2.55(0.01) 0.65% C28 machinery 2° 2.54(0.01) 1.04% C20 chemicals 2° 2.40(0.02) 0.63% C31-C32 furniture 2° 2.23(0.03) 0.57% A01 agrihunt 1° 2.15(0.03) 2.52% C27 electrical 2° 2.12(0.03) 0.57% C25 fabmetals 2° 2.02(0.04) 1.26% G46 wholesale 3° 1.90(0.06) 5.48% C16 wood 2° 1.83(0.07) 0.34% C26 computer 2° 1.74(0.08) 0.60% G45 wholesalemotor 3° -1.72(0.09) 1.69% 4.34% J61 telecom 3° -1.89(0.06) 2.10% F construction 2° -2.71(0.01) 6.59% 3 M72 research 3° 2.90(0.00) 0.49% 1.70% Q87-Q88 care 3° 2.83(0.01) 1.94% N79 travel 3° 2.47(0.01) 0.33% G45 wholesalemotor 3° 2.43(0.02) 1.28% P85 education 3° 2.41(0.02) 6.37% H52 warehousing 3° 1.91(0.06) 0.84% C29 motor 2° 1.89(0.06) 0.35% C23 othernonmetal 2° 1.85(0.06) 0.28% C17 paper 2° 1.73(0.08) 0.19% O84 publicadmin 3° 1.70(0.09) 4.97% C20 chemicals 2° -1.80(0.07) 0.32% 1.75% J59-J60 motionpic 3° -1.93(0.05) 0.53% C18 printing 2° -2.06(0.04) 0.30% B mining 1° -2.07(0.04) 1.30% G46 wholesale 3° -2.23(0.03) 4.22% M74-M75 otherscientific 3° -2.46(0.01) 0.62% L68B realestate 3° -2.61(0.01) 5.01% Notes
• ThePos’ncolumn reports the position of the sector as 1°(primary), 2°(secondary), or 3°(tertiary).
• TheTestcolumn contains a test-value (with p-values in parentheses) that indicates whether the sector has a higher (positive) or lower (negative) average forward linkage for this cluster than for the whole sample. Only sectors with a test-value statistically significant at a 10% threshold were kept.
• TheV Aij column reports average value added share of sectoriin clusterj, while theV A+/−,j