>5
' 4Capital
Market
Developments
March 26, 1979 Prepared by theCAPITAL MARKETS SECTION in conjunction with the
MORTGAGE and CONSUMER FINANCE SECTION
DIVISION OF RESEARCH AND STATISTICS BOARD OF GOVERNORS
FEDERAL RESERVE SYSTEM Washington, D C. 20551
Digitized for FRASER http://fraser.stlouisfed.org/ Federal Reserve Bank of St. Louis
Index
SUBSCRIPTION RATES:
Weekly $15.00 per year or $.40 each in the United States, its possessions, Canada, and Mexico; 10 or more of the same issue to one address, $13.50 per year or $.35 each. Elsewhere, $20.00 per year or $.50 each. Address requests to Publications Services, Divi-sion of Administrative Services, and make payment remittance payable to the order of the Board of Governors of the Federal Reserve System in a form collectible at par in U.S. Currency.
T A B L E S
1 - 6 S E C U R I T Y V O L U M E AND Y I E L D S 7, 8 STOCK MARKET AND S E C U R I T Y 9 C R E D I T 16 MORTGAGE M A R K E T SYMBOLS 6 ESTIMATE P PRELIMINARY r REVISED n . a NOT AVAILABLE
* Table 1
YIELDS, VOLUME AND RECEPTION
CORPORATE BOND MARKET
WEEK ENDING YIELDS VOLUME
WEEK ENDING NEW ISSUE 1 RECENTLY
2 GROSS 3 PER CENT NEW ISSUES 4
Aaa UTILITY OFFERED OFFERINGS SOLD BY END IN SYNDICATE Aaa UTILITY ($ MILLIONS) OF WEEK ($ MILLIONS)
1 9 7 9 - J a n . 5 9 . 5 1 1 0 1 0 0 0 1 2 - - 9 . 5 5 0 — — • — 1 9 9 . 5 4 9 . 5 7 5 3 0 9 7 1 8 2 6 - - 9 . 4 5 1 8 7 1 0 0 0 F e b . 2 — — 9 . 4 0 6 6 3 1 0 0 0 9 9 . 4 2 9 . 5 1 4 5 4 9 7 1 5 1 6 - - 9 . 5 5 2 0 1 0 0 0 2 3 9 . 5 9 9 . 6 3 2 9 0 7 0 8 6 M a r . 2 9 . 6 4 9 . 6 7 3 2 5 9 9 4 9 9 . 6 1 9 . 6 0 1 2 0 1 0 0 0 1 6 9 . 6 5 r 1 2 3 1 0 0 0 2 2 9 . 6 2 p ! 9 . 6 2 p 1 , 0 6 4 9 3 7 5
MUN ICIPAL BOND MARKET
WEEK ENDING YIELDS VOLUME
WEEK ENDING MOODY'S
BOND BUYER GROSS PER CENT NEW ISSUES 4 NEW ISSUE 20-BOND OFFERINGS SOLD BY END IN SYNDICATE
Aaa INDEX ($ MILLIONS) OF WEEK ($ MILLIONS)
1 9 7 9 - J a n . 5 6 . 0 5 6 . 5 8 1 3 7 7 8 7 8 1 2 6 . 0 0 6 . 5 0 9 6 0 8 9 1 5 1 1 9 6 . 0 0 6 . 4 8 4 8 8 9 4 6 5 2 6 5 . 7 5 6 . 3 0 4 6 0 8 7 7 7 F e b . 2 5 . 7 0 6 . 2 2 3 9 3 8 1 1 1 5 9 5 . 6 0 6 . 3 1 2 6 5 8 0 5 3 1 6 5 . 6 0 6 . 3 3 5 9 6 7 7 1 5 6 2 3 5 . 7 5 6 . 3 8 7 4 5 7 9 2 6 4 M a r . 1 5 . 8 0 6 . 4 2 9 8 1 9 1 1 3 8 9 5 . 8 0 6 . 3 5 8 2 8 8 9 1 2 2 1 6 5 . 8 0 6 . 3 0 1 , 3 7 6 9 4 1 7 8 2 2 5 . 8 0 6 . 2 9 7 5 9 8 0 2 2 6 NOTES:
1 Federal Reserve series of implied yield on newly issued, Aaa-rated utility bond with 5-year call protection.
2 Federal Reserve series of implied free-market yield on competitively bid Aaa-rated utility bond with 5-year call protection, released from price restrictions sometime during the last four weeks.
3 Estimated by F.R. on the basis of available data.
4 Corporate Market: Salomon Brothers Bond Market Roundup; Municipal Market: Weekly Bond Buyer. Data are adjusted by Federal Reserve when necessary to make coverage of this series consistent with the gross offerings series.
Digitized for FRASER http://fraser.stlouisfed.org/ Federal Reserve Bank of St. Louis
Table 2
HIGH GRADE BOND YIELDS
DATE NEW ISSUE 1
Aaa UTILITY 2 RECENTLY OFFERED Aaa UTILITY 3 MOODY'S SEASONED
CORPORATE Aaa U S . GOVT. 20-YEAR 4 CONSTANT MATURITY 5 BOND BUYER 2 0 - B 0 N D INDEX 1 9 7 5 - H i g h Low 9 . 8 0 8 . 8 9 ( 5 / 2 ) ( 2 / 7 ) 9 . 7 1 9 . 0 6 ( 5 / 2 5 ) ( 2 / 2 8 ) 9 . 0 1 8 . 5 7 ( 5 / 2 ) ( 2 / 2 8 ) 8 . 6 3 ( 9 / 1 9 ) 7 . 6 3 ( 2 / 2 1 ) 7 . 6 7 ( 1 0 / 3 ) 6 . 2 7 ( 2 / 1 3 ) 1 9 7 6 - H i g h Low 8 . 9 5 7 . 9 3 ( 5 / 2 8 ) ( 1 2 / 1 0 ) 9 . 1 0 7 . 8 4 ( 1 / 2 ) ( 1 2 / 3 1 ) 8 . 6 6 7 . 9 1 ( 5 / 2 8 ) ( 1 2 / 3 1 ) 8 . 1 7 ( 5 / 2 8 ) 7 . 2 7 ( 1 2 / 3 1 ) 7 . 2 9 ( 1 / 2 ) 5 . 9 5 ( 1 2 / 1 6 ) 1 9 7 7 - H i g h Low 8 . 3 6 7 . 9 0 ( 1 2 / 1 6 ) ( 1 / 7 ) 8 . 4 8 7 . 9 5 ( 1 2 / 3 0 ) ( 1 / 7 ) 8 . 2 8 7 . 8 8 ( 1 2 / 3 0 ) ( 1 / 7 ) 7 . 9 9 ( 1 2 / 3 0 ) 7 . 2 6 ( 1 / 7 ) 5 . 9 3 ( 2 / 4 ) 5 . 4 5 ( 1 1 / 1 7 ) 1 9 7 8 - H i g h Low 9 . 2 9 8 . 6 0 ( 1 2 / 1 5 ) ( 3 / 2 4 ) 9 . 5 4 8 . 4 8 ( 1 2 / 2 2 ) ( 1 / 6 ) 9 . 2 7 8 . 3 0 ( 1 2 / 2 9 ) ( 1 / 6 ) 9 . 0 0 ( 1 2 / 2 2 ) 8 . 0 2 ( 1 / 6 ) 6 . 6 7 5 . 5 8 ( 1 2 / 2 2 ) ( 3 / 1 7 ) 1 9 7 9 - H i g h Low 9 . 4 2 9 . 6 4 ( 3 / 2 ) ( 2 / 9 ) 9 . 6 7 9 . 4 0 ( 3 / 2 ) ( 2 / 2 ) 9 . 3 8 9 . 1 9 ( 3 / Z 3 ) ( 2 / 2 ) 9 . 1 2 ( 3 / 2 ) 8 . 8 9 ( 2 / 2 ) 6 . 4 2 6 . 2 2 ( 3 / 2 ) ( 2 / 2 ) 1 9 7 8 - D e c e m b e r 9 . 2 8 9 . 4 1 9 . 1 6 8 . 9 0 6 . 5 1 1 9 7 9 - J a n u a r y F e b r u a r y 9 . 5 4 9 . 5 3 9 . 5 1 9 . 5 6 9 . 2 5 9 . 2 6 8 . 9 8 9 . 0 3 6 . 4 7 6 . 3 ! 1 9 7 9 - F e b . 2 9 1 6 2 3 9 . 4 2 9 . 5 9 9 . 4 0 9 . 5 1 9 . 5 5 r 9 . 6 3 r 9 . 1 9 9 . 2 3 9 . 2 5 9 . 2 8 8 . 8 9 9 . 0 0 9 . 0 4 9 . 0 9 6 . 2 2 6 . 3 1 6 . 3 3 6 . 3 8 M a r . 2 9 1 6 2 3 9 . 6 4 9 . 6 1 9 . 6 2 p 9 . 6 7 9 . 6 0 9 . 6 5 r 9 . 6 2 p 9 . 3 6 9 . 3 5 9 . 3 8 9 . 3 8 p 9 . 1 2 9 . 0 8 9 . 0 7 9 . 0 8 p 6 . 4 2 6 . 3 5 6 . 3 0 6. 2 9 NOTES:
1 Federal Reserve series of implied yield on newly issued, Asa-rated utility bond with B-yeer call protection.
2 Federal Reserve series of implied free-market yield on competitively bid Aae-rated utility bond with 5-year call protection released from price restrictions sometime during the last 4 weeks.
3 Weekly average of daily closing figures.
4 Weekly average of daily figures. US. Treasury data.
— Table 3
LONG-TERM CORPORATE AND
STATE AND LOCAL GOVERNMENT
SECURITY OFFERINGS AND PLACEMENTS
IN MILLIONS OF DOLLARS
GROSS PROCEEDS
PERIOD CORPORATE 1 STATE AND LOCAL 2
1 9 7 9 1 9 7 8 1 9 7 7 1 9 7 9 1 9 7 8 | 1 9 7 7 January 3 , 2 7 5 e 3 , 0 1 3 4 , 3 6 2 2 , 7 4 6 3 , 3 0 6 3 , 4 0 2 February 2 ,9 5 0 e 2 , 6 5 7 2 , 7 9 2 2 , 7 0 0 e 2 , 7 5 3 3 , 4 4 2 March 4 , 4 4 2 5 , 5 7 8 4 , 8 4 4 4 , 0 6 3 April 3 , 2 8 5 3 , 9 9 8 3 , 8 2 4 3 , 4 0 9 May ' 4 , 0 3 5 3 , 7 9 7 5 , 5 2 5 4 , 5 6 6 June 5 , 2 1 5 5 , 6 6 0 4 , 3 6 9 5 , 7 8 6 July 4 , 2 2 6 4 , 2 8 9 3 , 9 2 0 3 , 1 1 3 August 3 , 3 1 1 3 , 4 6 9 6 , 4 0 7 4 , 1 1 8 September 3 , 8 3 2 4 , 1 7 7 2 , 3 2 3 4 , 0 1 3 October 3 , 6 8 5 4 , 2 2 1 3 , 2 3 1 3 , 8 0 7 November 3 , 2 0 7 5 , 3 3 1 4 , 3 2 0 3 , 3 3 2 December 4 , 1 5 0 e 6 , 5 3 1 3 , 6 9 0 3 , 6 4 6 01 1 0 , 1 1 2 1 2 , 7 3 2 1 0 , 9 0 3 1 0 , 9 0 7 0 2 1 2 , 5 3 5 1 3 , 4 5 5 1 3 , 7 1 8 1 3 , 7 6 1 0 3 1 1 , 3 6 9 1 1 , 9 3 5 1 2 , 6 5 0 1 1 , 2 4 4 0 4 l l , 0 4 2 e 1 6 , 0 8 3 1 1 , 2 4 1 1 0 , 7 8 5 1st Half 2 2 , 6 4 7 2 6 , 1 8 7 2 4 , 6 2 1 2 4 , 6 6 8 3 Otrs. 3 4 , 0 1 6 3 8 , 1 2 2 3 7 , 2 7 1 3 5 , 9 1 2 Year 4 5 , 0 5 8 e 5 4 , 2 0 5 4 8 , 5 1 2 4 6 , 6 9 7 NOTES:
1 Securities and Exchange Commission estimates of gross proceeds. 2 Securities Industry Association estimates of principal amounts. Digitized for FRASER
http://fraser.stlouisfed.org/ Federal Reserve Bank of St. Louis
v
Table 4
NEW CORPORATE SECURITY ISSUES
BY TYPE OF ISSUE AND ISSUER
IN MILLIONS OF DOLLARS
GROSS PROCEEDS BY TYPE OF ISSUE
PERIOD TOTAL BONDS COMMON MEMO
MANUFAC-TURING PUBLIC UTILITY COMMUNI-CATIONS 1 OTHER ISSUERS PERIOD TOTAL PUBLICLY
OFFERED PRIVATELY PLACED
AND PREFERRED
STOCK
ISSUES INCLUDED MANUFAC-TURING PUBLIC UTILITY COMMUNI-CATIONS 1 OTHER ISSUERS PERIOD TOTAL PUBLICLY
OFFERED PRIVATELY PLACED
AND PREFERRED
STOCK FOREIGN CONVERTIBLE
MANUFAC-TURING PUBLIC UTILITY COMMUNI-CATIONS 1 OTHER ISSUERS 1977 - I 12,732 6,498 3,527 2,707 268 6 3,031 3,047 1,415 5,238 . I I 13,455 5,606 4,975 2,874 346 108 3,440 4,125 1,059 4,830 I I I 11,935 6,215 3,506 2,214 272 495 3,250 2,901 644 5,140 IV 16,083 5,867 5,999 4,217 275 39 4,054 4,246 1,320 6,460 1978 - I 10,112 4,748 3,383 1,981 233 4 2,218 2,367 844 4,684 I I 12,535 5,421 4,196 2,918 260 158 2,898 3,672 384 5,581 I I I 11,369 5,284 3,868 2,217 120 115 2,534 3,012 1,120 4,701 1977 - October 4,221 2,114 .979 1,128 10 1 731 1,437 8 2,045 November 5,331 2,211 1,200 1,920 89 22 782 1,729 1,013 1,805 December 6,531 1,542 3,820 1,169 176 16 2,541 1,080 299 2,610 1978 - January 3,013 1,382 998 633 233 0 273 644 519 1,578 February 2,657 1,464 667 526 0 0 716 465 34 1,441 March 4,442 1,902 1,718 822 0 4 1,229 1,258 291 1,665 A p r i l 3,285 1,958 853 474 12 20 549 743 35 1,960 May 4,935 1,719 1,277 1,039 106 2 878 1,685 ~ 1,470 June 5,215 1,744 2,066 1,405 142 136 1,471 1,244 349 2,151 July 4,226 2,177 1,541 508 80 16 842 799 353 2,231 August 3,311 1,497 1,032 782 40 6 721 875 552 1,162 September 3,832 1,610 1,295 927 0 93 971 1,338 215 1,308 October r / 3,685 1,651 865 1,169 10 101 495 1,619 290 1,279 November 3,207 1,608 873 726 30 22 840 761 457 1,148
GROSS PROCEEDS BY TYPE OF ISSUER
NOTES:
1 Other issuers are extractive, railroad and other transportation, real estate and finance, and commercial and other. Source: Securities and Exchange Commission.
Table 5A
INTERMEDIATE AND LONG-TERM
PUBLIC SECURITY OFFERINGS
OTHER THAN U.S. TREASURY 1
February 26 through March 23, 1979
ISSUER TYPE
AMOUNT (MILLIONS
OF DOLLARS)
MATURITY COUPON RATE OFFERING YIELD MOODY'S/S&P'S RATINGS CORPORATE
Transamerica F i n a n c i a l Corp. Debt. 75.0 1999 9.88 9.92 A/A+
South Central Bell Tel. Co. Debt. 250.0 2019 9.63 9.65 Aaa/AAA
Portland General Elec. Co. Com. s t k . 89.4 mm mm
Southern P a c i f i c T r a n s p o r t a t i o n Co. Equip, t r . 24.0 1979-1994 9.50 10.25-9.50 Aa/AA
El Paso Co. Govt. gtd. 20.8 2003 9.40 9.40 — / —
Hershey Foods Corp. Debt. 75.0 2009 9.50 9.54 A/A+
Minnesota Power & Light Co. Com. s t k . 20.2 — — mm — — — * •—
Federal Express Corp. Com. s t k . 18.9 — — w — mm mm —i mm
Duke Power Co. Com. s t k . 107.3 — — — — * — —• M
M e r c a n t i l e Texas Corp. Notes* * 35.0 1999 11.20 11.20
--/AA-A l l s t a t e F i n a n c i a l Corp. Notes 50.0 1986 9.63 9.65 Aa/AA
Denver Rio Grande Western R.R. Co. Equip, t r . 16.5 1980-1994 9.38 10.15-9.40 Aaa/AAA
Golden Nugget Inc. Units 21.0 1994 12.25 13.80 B/B
C i n c i n n a t i Gas & E l e c t . Co. 1 s t . mtg. 100.0 2009 10.00 9.87 Aa/AA
Southwestern Bell Tel. Co. Debt. 450.0 2119 9.63 9.65 Aaa/AAA
Monongahela Power Co. 1 s t . mtg. 40.0 2009 10.50 10.47
Baa/A-Atchison, Topeka & Santa Fe Railway
Baa/A-Co. Equip, t r . 24.0 1980-1994 9.50 10.20-9.50 Aaa/AAA
Ford Motor Credit Co. Notes 150.0 1987 9.75 9.75
Aaa/AA-Ford Motor Credit Co. Debt. 150.0 2004 9.85 9.85
Aaa/AA-J . Ray McDermott & Co. Debt. 150.0 2004 9.63 9.65 A/A
OTHER
Stockholm Debt. 60.0 1994 9.75 9.88 Aaa/AAA
NOTES:
* Rights offering.
1 Includes only corporate and other security offerings of $15 million and over; excludes options, exchanges, and secondary offerings.
** Floating rate notes.
Digitized for FRASER http://fraser.stlouisfed.org/ Federal Reserve Bank of St. Louis
Table 5B
INTERMEDIATE AND LONG-TERM
PUBLIC SECURITY OFFERINGS
OTHER THAN U.S. TREASURY ' March 1 through March 23, 1979
ISSUER TYPE (MILLIONS OF AMOUNT
DOLLARS)
MATURITY NET INTEREST COST OFFERING YIELD MOODY'S/S&P'S RATINGS STATE AND LOCAL
Chicago Metro. Sanitary D i s t. , 1 1 1 .
Wyoming Comm. Dev. Auth. Wyoming Comm. Dev. Auth. Ohio, State of
South Dakota Hsg. Dev. Auth. South Dakota Hsg. Dev. Auth. Dade Co., Fla.
Dade Co., Fla. Dade Co., Fla. Broward Co., Fla.
Secaucus Mun. Utilities Auth., N.J. Secaucus Mun. Utilities Auth., N.J. Orange Cty. Muni. Water Dist., Calif. Orange Cty. Muni. Water Dist., Calif. Minnesota, State of
Austin, Texas
East Baton Rouge Parish Mtg. Fin. Auth., La.
East Baton Rouge Parish Mtg. Fin. Auth., La.
Lonoke Cty. Res. Hsg. Fac. Bd., Ark. Lonoke Cty. Res. Hsg. Fac. Bd., Ark. Little Rock Res. Hsg. Fac. Bd., Ark. Little Rock Res. Hsg. Fac. Bd., Ark.
G.O. Rev. Rev. G.O. Rev. Rev. Rev. Rev. Rev. G.O. Rev. Rev. Rev. Rev. G.O. Rev. Rev. Rev. Rev. Rev. Rev. Rev. 49.5 56.3 12.0 50.0 30.9 115.6 7.5 4 . 3 8 . 2 50.0 4 . 8
8.6
28.2 51.2 88.580.0
63.8 36.2 16.98.1
39.5 9 . 6 1980 1981-2000 2010 1979-1987 2010 1980-1999 2009 2003 1980-1998 1981-2009 1981-1996 2008 1982-1995 2006 1980-1999 1 9 8 1 - 2 0 0 6 2010 1980-1999 2011 1982-1999 2011 2012 5.94 5.33 6.74 6.74 6.82 6.82 6.82 6.13 7.33 7.33 5.56 6.26 7.30 7.30 7.25 7.25 5.50-6.55 6.88 5.10-5.25 7.10 5.40-6.90 6.90 6.80 5.75-6.60 5.35-6.40 5.50-6.25 6.88 6.00-7.00 7.25 5.10-5.80 5.25-6.50 7.38 5.40-7.00 7.50 5.70-7.20 7.30 7.30 Aa/AA Aa/AA Aaa/AAA A-l/AA A-l/AA A/A-A-1/A+ A l / -A-l/A Baa-l/BBBf Baa-l/BBBf Aaa/AAA A-1/A+ Aa/AA Aa/AA A/AA A/AA Aa/AA Aa/AA NOTES:1 Includes only state and local security offerings of $10 million and over; excludes secondary offerings. 2 For State and local government securities, G.O. denotes general obligation; Rev. denotes revenue obligations.
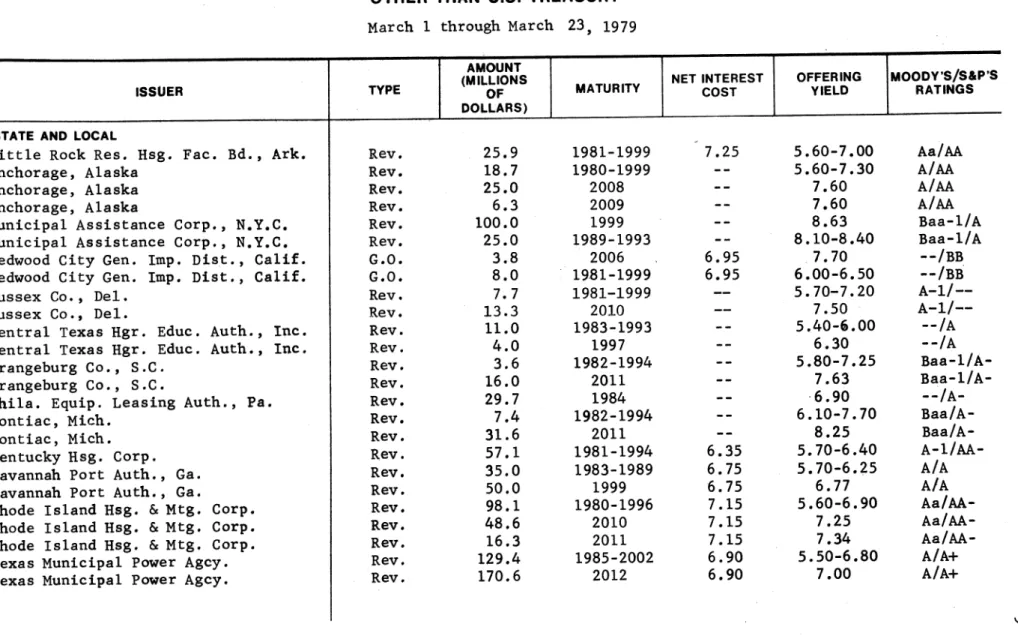
Table SB Continued
INTERMEDIATE AND LONG-TERM
PUBLIC SECURITY OFFERINGS
OTHER THAN U.S. TREASURY March 1 through March 23, 1979
AMOUNT (MILLIONS
OF DOLLARS)
MATURITY NET INTEREST OFFERING MOODY S / S & P ' S
ISSUER TYPE
AMOUNT (MILLIONS
OF DOLLARS)
MATURITY COST YIELD RATINGS
STATE AND LOCAL
L i t t l e Rock Res. Hsg. Fac. Bd., Ark. Anchorage, Alaska
Anchorage, Alaska Anchorage, Alaska
Municipal Assistance Corp., N.Y.C. Municipal A s s i s t a n c e Corp., N.Y.C.
Redwood City Gen. Imp. D i s t . , C a l i f . Redwood City Gen. Imp. D i s t . , C a l i f . Sussex Co., Del.
Sussex Co., Del.
Central Texas Hgr. Educ. A u t h . , I n c . C e n t r a l Texas Hgr. Educ. Auth., I n c . Orangeburg Co., S.C.
Orangeburg Co., S.C.
P h i l a . Equip. Leasing Auth., Pa. P o n t i a c , Mich.
P o n t i a c , Mich. Kentucky Hsg. Corp.
Savannah Port Auth., Ga. Savannah Port A u t h . , Ga.
Rhode I s l a n d Hsg. & Mtg. Corp. Rhode I s l a n d Hsg. & Mtg. Corp. Rhode I s l a n d Hsg. & Mtg. Corp. Texas Municipal Power Agcy. Texas Municipal Power Agcy.
Rev. 25.9 1981-1999 7.25 5.60-7.00 Aa/AA Rev. 18.7 1980-1999 — — 5.60-7.30 A/AA Rev. 25.0 2008 — — 7.60 A/AA Rev. 6 . 3 2009 — - 7.60 A/AA Rev. 100.0 1999 — — 8.63 Baa-l/A Rev. 25.0 1989-1993 - - 8 . 1 0 - 8 . 4 0 Baa-l/A G.O. 3.8 2006 6.95 7.70 - - / BB G.O. 8.0 1981-1999 6.95 6 . 0 0 - 6 . 5 0 --/BB Rev. 7.7 1981-1999 5 . 7 0 - 7 . 2 0 A—1/— Rev. 13.3 2010 7.50 A - l / — Rev. 11.0 1983-1993 - - 5 . 4 0 - 6 . 0 0 — /A Rev. 4 . 0 1997 — - 6.30 --/A Rev. 3.6 1982-1994 — — 5 . 8 0 - 7 . 2 5 Baa-l/A-Rev. 16.0 2011 - - 7.63 Baa-l/A-Rev. 29.7 1984 — — 6.90 - - /A-Rev. 7.4 1982-1994 — — 6 . 1 0 - 7 . 7 0 Baa/A-Rev. 31.6 2011 — — 8.25 Baa/A-Rev. 57.1 1981-1994 6.35 5 . 7 0 - 6 . 4 0 A-1/AA-Rev. 35.0 1983-1989 6.75 5 . 7 0 - 6 . 2 5 A/A Rev. 50.0 1999 6.75 6.77 A/A Rev. 98.1 1980-1996 7.15 5 . 6 0 - 6 . 9 0 Aa/AA-Rev. 48.6 2010 7.15 7.25 Aa/AA-Rev. 16.3 2011 7.15 7.34 Aa/AA-Rev. 129.4 1985-2002 6.90 5 . 5 0 - 6 . 8 0 A/A+ Rev. 170.6 2012 6.90 7.00 A/A+ vo /
Digitized for FRASER http://fraser.stlouisfed.org/ Federal Reserve Bank of St. Louis
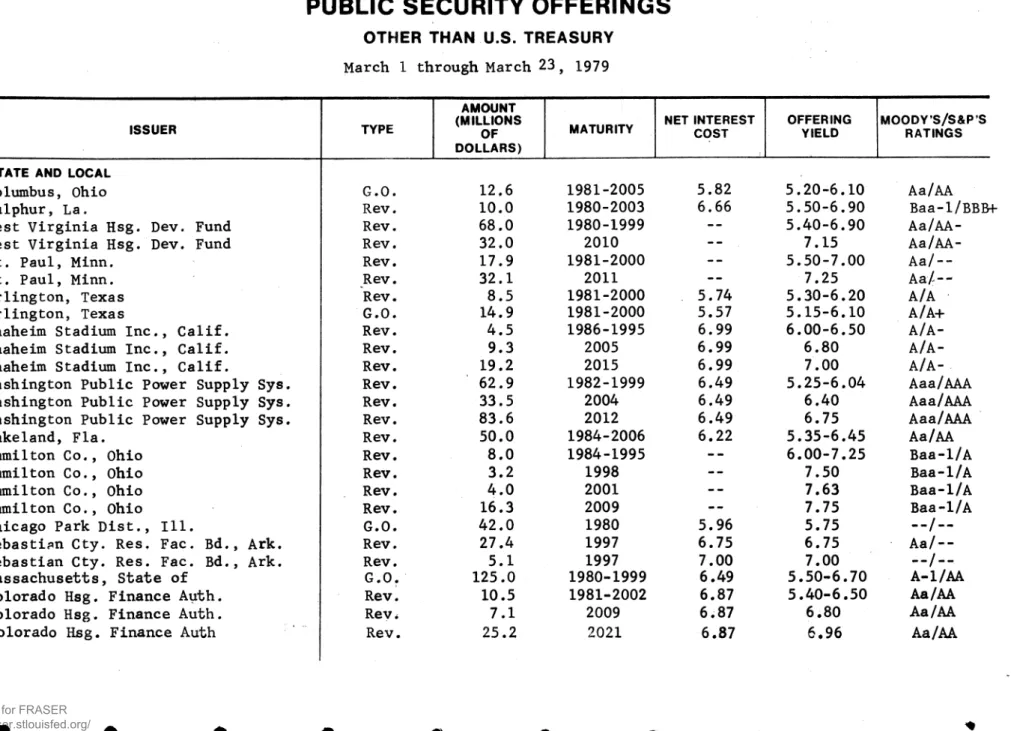
Table SB Continued o
INTERMEDIATE AND LONG-TERM
PUBLIC SECURITY OFFERINGS
OTHER THAN U.S. TREASURY March 1 through March 23, 1979
ISSUER TYPE
AMOUNT (MILLIONS
OF DOLLARS)
MATURITY NET INTEREST COST OFFERING YIELD MOODY'S/S&P'S RATINGS
STATE AND LOCAL
Columbus, Ohio G.O. 12.6 1981-2005 5.82 5.20-6.10 Aa/AA
Sulphur, La. Rev. 10.0 1980-2003 6.66 5.50-6.90 Baa-l/BBIH
West Virginia Hsg. Dev. Fund Rev. 68.0 1980-1999 5.40-6.90
Aa/AA-West Virginia Hsg. Dev. Fund Rev. 32.0 2010 - - 7.15
Aa/AA-St. Paul, Minn. Rev. 17.9 1981-2000 5.50-7.00
Aa/--St. Paul, Minn. Rev. 32.1 2011 - - 7.25 Aa /
-Arlington, Texas Rev. 8 . 5 1981-2000 5.74 5.30-6.20 A/A
Arlington, Texas G.O. 14.9 1981-2000 5.57 5.15-6.10 A/A+
Anaheim Stadium Inc., Calif. Rev. 4 . 5 1986-1995 6.99 6.00-6.50
A/A-Anaheim Stadium Inc., Calif. Rev. 9 . 3 2005 6.99 6.80
A/A-Anaheim Stadium Inc., Calif. Rev. 19.2 2015 6.99 7.00
A/A-Washington Public Power Supply Sys. Rev. 62.9 1982-1999 6.49 5.25-6.04 Aaa/AAA
Washington Public Power Supply Sys. Rev. 33.5 2004 6.49 6.40 Aaa/AAA
Washington Public Power Supply Sys. Rev. 83.6 2012 6.49 6.75 Aaa/AAA
Lakeland, Fla. Rev. 50.0 1984-2006 6.22 5.35-6.45 Aa/AA
Hamilton Co., Ohio Rev. 8.0 1984-1995 - - 6.00-7.25 Baa-l/A
Hamilton Co., Ohio Rev. 3.2 1998 7.50 Baa-l/A
Hamilton Co., Ohio Rev. 4 . 0 2001 7.63 Baa-l/A
Hamilton Co., Ohio Rev. 16.3 2009 7.75 Baa-l/A
Chicago Park Dist., 1 1 1 . G.O. 42.0 1980 5.96 5.75 /
-Sebastian Cty. Res, Fac. Bd., Ark. Rev. 27.4 1997 6.75 6.75
Aa/--Sebastian Cty. Res. Fac. Bd., Ark. Rev. 5 . 1 1997 7.00 7.00
Massachusetts, State of G.O. 125.0 1980-1999 6.49 5.50-6.70 A-l/AA
Colorado Hsg. Finance Auth. Rev. 10.5 1981-2002 6.87 5.40-6.50 Aa/AA
Colorado Hsg. Finance Auth. Rev. 7 . 1 2009 6.87 6.80 Aa/AA
Table SB Continued
INTERMEDIATE AND LONG-TERM
PUBLIC SECURITY OFFERINGS
OTHER THAN U.S. TREASURY March 1 through March 23, 1979
ISSUER TYPE
AMOUNT (MILLIONS
OF DOLLARS)
MATURITY NET INTEREST COST OFFERING YIELD MOODY'S/S&P'S RATINGS
STATE AND LOCAL
Phelps County, Mo. Rev. 5.7 1983-1999 7.31 5 . 9 0 - 7 . 1 0 Baa-l/A—
Phelps Coutny, Mo. Rev. 8.8 2009 7.31 7.45
Baa-l/A-Maryland Comm. Dev. Adm. Rev. 12.8 1980-1999 - - 5 . 3 0 - 6 . 7 5
——/
——
Maryland Comm. Dev. Adm. Rev. 7.2 2011 — — 6.88
——/
——
Hawaiian Gardens Redev. A g c y . , C a l i f . Rev. 5.5 1981-1996 — — 5 . 5 0 - 6 . 9 0 — — /A
Hawaiian Gardens Redev. A g c y . , C a l i f . Rev. 9.0 2011 -» — 7.25 — /A
Shelby Co., Tenn. G.O. 47.0 1980-1999 5.63 5 . 2 0 - 6 . 1 5 Aa/AA
^Florence Cty. S.D. No. 1, S.C. G.O. 10.0 1982-2003 5.90 5.30-6.35 A/A+
Nevada, S t a t e of G.O. 47.0 1983-2009 5.92 5 . 2 0 - 6 . 1 0 Aa/AA
C a l i f o r n i a , S t a t e of G.O. 125.0 1980-2004 5.72 5 . 1 0 - 6 . 0 0 Aaa/AAA
Butler Area Sewer Auth., Pa. Rev. 29.1 1981 5.90
——/
——
Chicago, 111. Rev. 63.5 1980-1999 6.96 5 . 5 0 - 6 . 9 5 Aa/AA
Chicago, 111. Rev. 56.5 2009 6.96 7.20 Aa/AA
Chicago, 111. Rev. 30.0 2008 6.96 6.60 Aa/AA
Digitized for FRASER http://fraser.stlouisfed.org/ Federal Reserve Bank of St. Louis
12
Table 6A
FORTHCOMING INTERMEDIATE AND LONG-TERM
PUBLIC SECURITY OFFERINGS
OTHER THAN U.S. TREASURY 1
As of March 23, 1979
AMOUNT APPROXIMATE
ISSUER TYPE (IN MILLIONS DATE OF OFFERING
OF DOLLARS) CORPORATE
General E l e c t r i c Credit Corp. Notes 200.0 Mar. 27
Kentucky U t i l s . Co. Com. s t k . 20.0 Mar. 28
National Rural U t i l s - Coop. F i n .
Corp. C o l l . t r . 100.0 Mar. 29
General M i l l s I n c . Debt. 125.0 Mar. 28
C a p i t a l F i n a n c i a l Services Inc. Notes 30.0 Mar.
Iowa Public Service Com. s t k . 21.0 Apr. 3
Public Service Co. of Indiana Pfd. s t k . 35.0 Apr. 3
Avco F i n a n c i a l Services I n c . Notes 125.0 Apr. 3
Philadelphia E l e c t r i c Co. Com. s t k . 68.0 Apr. 3
Virginia E l e c t r i c & Power Co. 1st mtg. 100.0 Apr. 3
Gulf S t a t e s U t i l s . 1st mtg. 75.0 Apr. 4
P a c i f i c Power & Light Co. 1st mtg. 100.0 Apr. 10
Chesapeake & Potomac T e l . Co. of
Virginia Debt. 200.0 Apr. 10
Georgia Power Co. 1st mtg. 125.0 Apr. 18
*South Carolina E l e c t r i c & Gas Co. Com. s t k . 20.0 Apr. 18
South Carolina E l e c t r i c & Gas Co. 1st mtg. 35.0 Apr. 18
Utah Power & Light Co. Pfd. s t k . 20.0 Apr. 19
Utah Power & Light Co. 1st mtg. 35.0 Apr. 19
Consumers Power Co. 1st mtg. 100.0 Apr. 23
Gulf Power Co. 1st mtg. 30.0 Apr. 24
Louisiana Power & Light Co. 1st mtg. 45.0 Apr. 26
*Emons I n d u s t r i e s Inc. Equip t r . 25.0 Apr.
C o n t i n e n t a l Oil Co. Debt. 200.0 Apr.
*Public Service of New Hampshire Pfd. s t k . 25.0 Apr.
Wisconsin Power & Light Co. Com. s t k . 20.0 Apr.
Delmarva Power & Light Co. Com. s t k . 26.0 Apr.
OTHER
*Sweden, Kingdom of Notes 150.0 Apr.
NOTES:
* Included in table for first time.
13 Table 6B
FORTHCOMING INTERMEDIATE AND LONG-TERM
PUBLIC SECURITY OFFERINGS
OTHER THAN U.S. TREASURY 1
As of March 23, 1979
ISSUER TYPE (IN MILLIONS AMOUNT
OF DOLLARS)
APPROXIMATE DATE OF OFFERING STATE & LOCAL
Mass. Home Mtg. F i n . Agcy. Rev. 25.0 Mar. 26
Houma-Terrebone Public Trust F i n .
Auth., La. Rev. 25.0 Mar. 27
New Orleans Home Mtg. Auth. La. Rev. 85.0 Mar. 27
Tippecanoe Co. Hosp. Auth., Ind. Rev. 14.0 Mar. 27
*Idaho F a l l s , Idaho Rev. 36.2 Mar. 27
Citrus Co., F l a . Rev. 40.0 Mar. 27
La Habra Redev. Agy., C a l i f . Rev. 32.6 Mar. 27
Anaheim Union High Sch. Comm. Auth
C a l i f . Rev. 10.0 Mar. 27
*Port Auth. of New York & New Jersey Rev. 75.0 Mar. 28
*North Carolina Hsg. F i n . Agy. Rev. 37.3 Mar. 28
Virginia Pub. Sch. Auth. G . 0 . 16.3 Mar. 28
Providence, R . I . G.O. 15.0 Mar. 28
Montgomery Cfcy. Hsg. Opportunities
Comm., Md. Rev. 56.8 Mar. 28
Los Angeles Dept. of Water & Power
C a l i f . Rev. 60.0 Mar. 28
Allegheny Cty. Hosp. Dev. Auth.,
Pa. Rev. 79.3 Mar. 29
Conn. Hsg. F i n . Auth. Rev. 158.3 Mar. 29
Gwinnett Co. Sch. D i s t . , Ga. G.O. 20.0 Mar. 29
*Philadelphia I n d u s t . Dev. Auth.,
Pa. Rev. 11.5 Mar.
*Carson Redev. Agcy. C a l i f . Rev. 10.0 Mar.
Addison, 111. Rev. 25.0 Mar.
*West Memphis Resid. Hsg. Fac. Bd.,
Ark. Rev. 16.5 Mar.
M a r t i n s v i l l e , W. Va. Rev. 25.0 Mar.
*Hempstead, N.Y. G .0. 14.4 Apr. 3
Memphis, Tenn. G.O. 25.0 Apr. 3
Florida S t a t e Board of Education G.O. 32.7 Apr. 3
Kenosha County, Wis. G.O. 10.0 Apr. 3
San Francisco, C a l i f . G.O. 14.0 Apr. 4
Nueces Rever Auth., Texas Rev. 13.0 Apr. 4
D a l l a s , Texas G.O. 37.0 Apr. 4
Delaware S t a t e Hsg. Rev. 38.9 Apr. 5
Puerto Rico Public Bldg. Auth. Rev. 80.0 Apr. 9
*Arkansas Hsg. Dev. Agcy. Rev. 75.0 Apr. 9
NOTES:
1 Includes state and local government issues of $10 million and over. Included in the table for the first time.
Digitized for FRASER http://fraser.stlouisfed.org/ Federal Reserve Bank of St. Louis
14
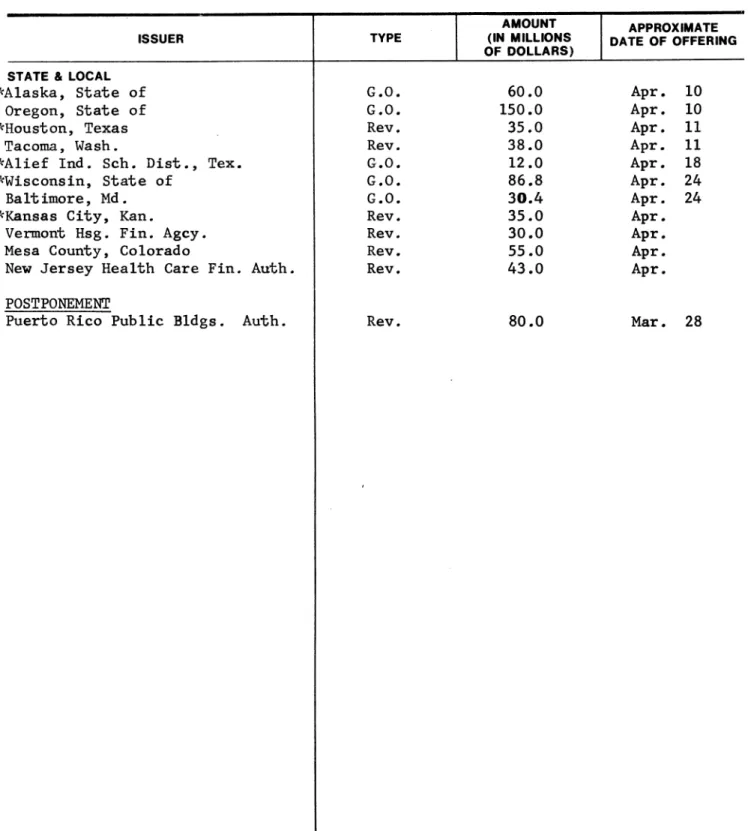
Table 6B Continued
FORTHCOMING INTERMEDIATE AND LONG-TERM
PUBLIC SECURITY OFFERINGS
OTHER THAN U.S. TREASURY 1
As of March 23, 1979
AMOUNT APPROXIMATE
ISSUER TYPE (IN MILLIONS DATE OF OFFERING
OF DOLLARS) DATE OF OFFERING STATE & LOCAL
*Alaska, S t a t e of G.O. 60.0 Apr. 10
Oregon, S t a t e of G.O. 150.0 Apr. 10
*Houston, Texas Rev. 35.0 Apr. 11
Tacoma, Wash. Rev. 38.0 Apr. 11
*Alief Ind. Sch. D i s t . , Tex. G.O. 12.0 Apr. 18
*Wisconsin, S t a t e of G.O. 86.8 Apr. 24
Baltimore, Md. G.O. 30.4 Apr. 24
*Kansas C i t y , Kan. Rev. 35.0 Apr.
Vermont Hsg. F i n . Agcy. Rev. 30.0 Apr.
Mesa County, Colorado Rev. 55.0 Apr.
New J e r s e y Health Care F i n . Auth. Rev. 43.0 Apr.
POSTPONEMENT
#
#
#
#
#
#
#
#
#
#
Table 7
STOCK PRICES AND VOLUME
riATP STOCK PRICES 1 TRADING VOLUME 2
NYSE INDEX 3| BJ INDUSTRIALS AMEX 4 NASDAQ NYSE AMEX NASDAQ
1975-High Low 51.24 37.16 (1/8) (7/15) 881.81 632.04 (7/15) (1/2) 96.86 62.20 (7/15) (1/2) 88.00 60.70 (7/15) (1/2) 35.2 8.7 (2/13) (9/15) 4.2 1 . 1 (2/21) (9/15) 8 . 1 2.5 (2/13) (9/15) 1976-High Low 57.51 48.04 (9/21) (1/2) 1014.79 858.71 (9/21) (1/2) 107.05 84.31 (7/12) (1/2) 92.52 78.06 (1/2) (7/15) 44.5 10.3 (2/20) (1/2) 8 . 6 1 . 1 (2/20) (1/2) 11.1 3.5 (2/20) (1/2) 1977--High Low 57.69 49.78 (1/2) (11/2) 999.75 800.85 (1/3) (11/2) 127.89 109.61 (12/30) (1/12) 105.05 93.66 (12/30) (4/5) 10.6 35.3 (11/11) (10/10) 4 . 2 1.4 (1/13) (9/22) 11.2 5 . 1 (11/10) (5/27) 1978--High Low 48.37 60.38 (3/6) (9/12) 907.74 742.12 (9/8) (2/28) 119.73 176.97 (9/15) (1/11) 139.25 99.09 (9/13) (1/11) 66.4 7.6 (8/3) (1/20) 11.0 1 . 3 (10/30) (1/20) 18.8 2.8 (5/18) (1/20) 1979-High Low 53.88 57.09 (2/27) (3/22) 807.00 861.31 (3/22) (2/27) 176.80 152.03 (3/23) (1/2) 130.58 117.84 (3/23) (1/2) 18.3 37.1 (1/2) (1/12) 2.2 5 . 3 (3/22) (1/22) 15.9 7.2 (3/22) (1/2) 1979 J a n . 5 12 19 26 55.41 55.91 55.85 56.99 830.73 836.28 837.49 859.75 157.66 160.33 161.04 162.35 122.05 123.74 124.65 127.04 27,4 27.1 27.4 30.4 3 . 5 3.2 3 . 3 2.9 10.6 11.0 10.8 12.1 Feb. 2 9 16 23 55.79 54.88 55.37 54.88 834.63 822.42 827.01 823.28 159.25 160.08 163.15 162.55 125.82 123.76 125.57 125.04 27.0 25.2 24.0 24.3 2 . 5 2.8 3.0 3.0 10.4 10.2 10.0 10.3 Mar. 2 9 16 22 54.37 55.81 56.55 57.08 815,75 842.86 852.82 859.75 162.97 166.66 172.77 176.80 123.67 127.25 128.55 130.58 25.2 28.9 28.5 31.8 3.2 3 . 5 4 . 1 4.7 11.0 13.4 12.9 14.2 MOTES:
1 Figure* other then highs end lows ere Fridays only. Highs end lows ere for the year end ere not necessarily for Fridays, 2 Volume figures ere weekly evereges of daily figures (millions of shares).
3 12/31/65 - 60
4 Based on average price change until September 4,1973 thereafter, based on market value of shares listed. Digitized for FRASER
http://fraser.stlouisfed.org/ Federal Reserve Bank of St. Louis
16
Table 8
SECURITY CREDIT
END OF PERIOD
REGULATED MARGIN CREDIT EXTENDED BY 4
UNREGULATED NONMARGIN STOCK CREDIT
AT BANKS END OF PERIOD BROKERS ON 1
MARGIN STOCK BROKERS ON % CONVERTIBLE BONDS 3 BANKS 4 UNREGULATED NONMARGIN STOCK CREDIT AT BANKS OUTSTANDING 1978 - February 9.780 242 877 2,544 March 9,920 246 855 2,544 April 10,260 248 914 2,560 May 10,660 245 s e r i e s discontinued June 11,090 242 J u l y 11,190 247 August 11,740 243 September 12,400 225 October 12,090 216 November 11,000 209 December 10,830 205 1979 - January 10,750 204 February 10,790 n . a . CHANGE IN OUTSTANDING 1978 - February 190 -4 26 -21 March 140 4 -22 -April 340 2 -59 16
May 400 -3 series discontinued
June 430 -3 July 100 5 August 550 -4 September 660 -18 October -310 -9 November -1,090 -7 December -170 -4 1979 - January -80 - 1 February 40 n.a. NOTES:
1 Margin account debt as reported by the New York Stock Exchange, excluding credit for subscription issues and convertible bonds. 2 New York Stock Exchange data.
3 June data for banks are universe totals; all other data for banks represent estimates for all commercial banks based on reports by a reporting sample, which accounted for 60 per cent of security credit outstanding at banks on June 30.
4 N on margin stocks are those not listed on a national securities exchange and not included on the Board of Governors of the Federal Reserve System's list of OTC margin stocks. At banks, loans to purchase or carry nonmargin stocks are unregulated; at brokers, such stocks have no value.
Table 9
SAVINGS FLOWS AT NONBANK THRIFT INSTITUTIONS
IN MILLIONS OF DOLLARS
DATE
MUTUAL SAVINGS BANKS SAVINGS & LOAN ASSOCIATIONS TOTAL DATE REGULAR DEPOSITS 1
2
NET SHARE CAPITAL
2
NET DEPC > 6 r r s NET 2 NEW MONEY DATE NET FLOW ANNUAL 3 GROWTH RATE NEW
MONEY FLOW NET
ANNUAL 3 GROWTH
RATE
NEW
MONEY FLOW NET
ANNUAL 3 GROWTH RATE 2 NET NEW MONEY 1974 2,165 2 . 3 -2,822 16,006 7 . 1 4,668 18,171 5.6 1,846 1975 11,070 11.3 4,757 42,769 17.6 29,276 53,839 15.8 34,033 1976 12,670 11.6 5,275 50,169 17.6 34,369 62,839 15.9 39,644 1977 10,647 8.9 2,874 50,963 15.2. 32,004 61,610 13.5 34,783
NOT SEASONALLY ADJUSTED
1978-June 1,304 — — -90 6,656 — — 1,744 7,960 1, 654 J u l y 341 — — 38 3,074 2,812 3,415 2,850 August 260 -75 2,312 2,069 2,572 — 1,994 September 1,378 — — -41 6,433 — — 1,606 7,811 1,565 October 510 — — 48 2,645 2,534 3,155 2,582 November 275 — — -59 2,157 — — 1,897 2,432 1,838 December 1,236 -391 5,802 710 7,038 — 298 1 9 7 9 - J a n u a r y ^ 266 - - -121 4,762 - - 4,398 5,028 - - 4,323 SEASONALLY ADJUSTED^/ 1978-June 723 6.4 4,675 14.0 — 5,398 12.1 — J u l y 668 5 . 9 3,846 11.4 — 4,514 10.0 - — August 1,054 9.2 4,578 13.4 — 5,632 12.3 — September 1,116 9.7 5,757 16.7 — 6,873 14.9 — October 1,096 9.4 3,510 10.0 — 4,606 9.9 — November 353 3.0 4,399 12.4 ' — 4,752 10.1 — December 456 3.9 3,710 10.4 — 4,166 8.8 — 19 7 9 - J a n u a r y ^ 452 3.8 4,583 12.7 5,035 10.5 NOTES:
1 Regular deposits at mutual savings banks exclude items such as Christmas club and certain escrow accounts, which represent a very small part of total deposits. 2 New deposits net of both withdrawals and interest. Data for S&L's are for insured associations only, which represent 96 per cent of industry total resources. 3 Annual growth rate for monthly data is the annualized monthly percentage increase in deposits.
4 Seasonally a d j u s t e d s e r i e s have been r e v i s e d due to r e c a l c u l a t i o n of seasonal f a c t o r s • SOURCE: National Association of Mutual Savings Banks and F e d e r a l Home Loan Bank Board# Digitized for FRASER
http://fraser.stlouisfed.org/ Federal Reserve Bank of St. Louis
18
Table 10
MORTGAGE COMMITMENTS AT
SELECTED THRIFT INSTITUTIONS
BILLIONS OF DOLLARS, SEASONALLY ADJUSTED
OUTSTANDING COMMITMENTS NET CHANGE
PERIOD ALL SAVINGS MUTUAL ALL SAVINGS MUTUAL
PERIOD
TOTAL & LOAN SAVINGS BKS TOTAL & LOAN SAVINGS BKS TOTAL
ASSOCIATIONS (N Y. STATE) ASSOCIATIONS (N Y. STATE)
1972 , 25.3 20.3 5.0 7.48 6.28 1.20 1973 20.0 16.4 3 . 5 - 5 . 3 1 - 3 . 9 2 - 1 . 3 9 1974 14.7 12.4 2 . 3 - 5 . 2 0 - 3 . 9 1 - 1 . 2 9 1975 20.2 18.2 2.2 5 . 8 1 6.06 - .25 1976 27.8 25.0 2.8 7.46 6.80 .66 1977 - J a n . 27.8 25.0 2.8 .45 .38 .07 Feb. 28.5 25.5 3.0 .66 .46 .20 Mar. 29.7 26.5 3.2 1.20 1.00 .17 Apr. 30.4 27.2 3 . 3 .68 .68 — May 30.8 27.5 3 . 3 .47 .40 .07 June 32.1 28.3 3.8 1.32 .79 .53 J u l y 32.8 29.0 3.8 .60 .63 - .03 Aug. 34.1 30.1 4 . 0 1 . 3 1 1.11 .20 Sept. 35.0 30.9 4 . 1 .97 .80 .17 O c t . 37.2 32.7 4.4 2.23 1.86 .37 Nov. 38.2 33.5 4 . 5 1.05 .82 .23 Dec. 38 . 3 33.7 4 . 5 .06 .16 - .10 1978 - J a n . 38.0 33.6 4.4 —. 32 —. 08 - .24 Feb. 37.3 33.0 4 . 3 - . 7 0 - . 6 1 - .09 Mar. 36.9 32.7 4 . 3 - . 3 8 - . 3 4 - .04 Apr. 36.5 32.3 4 . 3 - . 3 9 - . 4 2 - .03 May 36.2 31.9 4 . 3 - . 3 4 - • 3 9 .05 June 36.1 31.5 4.6 • 02 - . 3 2 .34 J u l y 36.0 31.5 4 . 6 - . 0 5 - . 0 3 - -02 Aug. 36.4 31.9 4 . 6 .35 .36 - .01 Sept. 36.7 32.3 4.4 - . 3 4 .42 — . 08 Oct. 38.8 33.9 4 . 8 1.96 1.63 .33 Nov. 39.1 34.0 4.9 • 22 .10 .12 Dec. 38.3 33.4 4.9 80 - . 8 0 - . 0 1 1979 - J a n . 37.5 32.7 4.8 - . 7 4 - . 7 0 - .04 NOTES:
Based on data from Federal Home Loan Bank Board and Savings Banks Association of New York State. Both series include a minor amount of non-residential commitments; S&L commitments also include loans in process. Net changes are derived directly from unrounded end-of-period outstanding
T a b l e 11
NET NEW MONEY BORROWINGS
BY MAJOR HOUSING AGENCIES
IN MILLIONS OF DOLLARS 19 PERIOD 19 77-Jan. Feb. Mar < Apr. May June July Aug. Sept. Oct. Nov. Dec. 1978-Jan. Feb. Mar. Apr. May June July Aug. Sept. Oct. Nov. Dec. 1979-Jan. . F e b . ! ' TOTAL INCLUDING SHORT-TERM DISCOUNT NOTES 12 —8 62 289 344 532 605 531. 347 195 247 466 1,078 399 1,712 887 848 3,091 1,492 1,605 1,811 1,683
1,680
1,108
3,023 534 1,325INTERMEDIATE AND LONG-TERM ISSUES
TOTAL 188 -592 -354 746 297 203 553 301 -291 211 500 0 - 1 2 1,388 -17 600 1,483 1,276
1,881
1,182
1,1311,630
885 2,183 0 837 FHLB 0 - 2 0 0 0 - 6 105 0 0 304 0 0 300 0 0 1,400 0 0 1,500 0 7001,200
0 0 900 750 0 837 FHLMC -185 -393 - 4 0 200 3 -47 - 3 9 11 200 0 - 1 2 - 1 2 -17 0 -17 276 -19 —18 181 - 7 0 -15 183 - 1 1 6 0 FNMA - 1 1 -350 752 - 8 200 600 0 -300 200 0 0 0 0 0 600 0 1,0001,200
0 950 1,700 0 1,250 0 0 FNMA &FHLB SHORT-TERM DISCOUNT NOTES 1 -176 -270 643 -402 235 402 - 2 2 46 486 -36 —34 1,078 411 324 904 248 1,608 216 -276 629 552 50 223 840 650 488 NOTES:Based on data from Treasury Survey of Ownership. Sales of FHLB discount notes began in May 1974. Digitized for FRASER
http://fraser.stlouisfed.org/ Federal Reserve Bank of St. Louis
20 T a b l e 1 2
NET CHANGE IN MORTGAGE HOLDINGS
IN MILLIONS OF DOLLARS
TOTAL FINANCIAL MSTITUTIONS 2
PERIOD INCLUDING TOTAL COMMERCIAL M S B ' s S & L's INSURANCE FNMA-GNMA FNMA-GNMA TOTAL BANKS M S B ' s S & L's COMPANIES
1970 21,930 17,020 2,462 1,946 10,254 2,348 4,910 1971 41,406 39,018 9,940 3,938 23,919 1,221 2,38ft 1972 57,587 55,561 16,800 5,377 31,932 1,452 2,026 1973 58,372 55,072 19,600 5,642 25,552 4,278 3,300 1974 42,739 36,517 11,700 2,172 17,567 5,078 6,222 1975 43,497 38,658 4,200 2,236 29,289 2,933 4,839 1976 62,783 64,903 13,900 4,074 44,515 2,414 -2,120 1977 96,814 95,924 25,400 6,474 58,566 5,184 890
Not Seasonally Adjusted
1978 - J u l 9,149 8,421 3,200 674 3,991 556 728 Aug 11,061 10,063 3,700 636 4,721 1,006 998 Sept 9,357 8,373 2,800 516 4,294 763 984 Oct 9,444 8,561 3,000 500 4,265 796 883 Nov 9,408 8,923 3,200 594 4,184 945 485 Dec 8,618 7,916 2,200 452 3,438 1,826 702 1979 - Jan 2,595 Seasonally Adjusted 1978 - J u l 8,505 8,061 3,100 635 3,647 679 444 Aug 10,147 9,217 3,373 585 4,214 1,045 930 Sept 8,968 8,223 2,701 538 4,188 796 745 Oct 9,609 8,782 3,149 480 4,450 703 827 Nov 10,150 9,663 3,340 638 4,762 923 487 Dec 8,473 7,932 2,401 327 3,818 1,386 541 1979 - Jan 3,918 NOTES:
1 Monthly data for commercial banks based on Federal Reserve estimates benchmarked to Call Report data on real estate loans outstanding as avail-able. Other data derived from mortgage debt outstanding as reported separately by National Assn. of Mutual Savings Banks, Federal Home Loan Bank Board, Institute of Life Insurance and, through August 1968, the Federal National Mortgage Association, and thereafter by FNMA and the Government National Mortgage Association. Data for mutual savings banks and for Life Insurance companies may differ somewhat from those de-rived from regular quarterly series because of minor conceptual differences for which adjustments are not made in the monthly series. Altogether, these groups accounted for 83 per cent of the net increase estimated for all holders in 1974.
21 T a b l e 1 3
NET INCREASE IN
MORTGAGE DEBT OUTSTANDING
1IN BILLIONS OF DOLLARS, SEASONALLY ADJUSTED ANNUAL RATES
2 RESIDENTIAL 3 MULTFAMLY
QUARTER TOTAL TOTAL TOTAL 1- to 4 - MULTI- COMMERCIAL * FARM
FAMILY FAMILY COMMERCIAL
1972 - I 67,9 49,8 38,5 11.3 14,7 26,0 3,5 I I 73.9 53.9 40.7 13,2 16,5 29,6 3,5 I I I 77.2 58.6 47.7 11.0 14,9 25,9 3,7 IV 88.8 64.1 48.4 15,7 21.1 36.8 3,6 1973 - I 82,0 57.5 49,4 8 . 1 18,8 27,0 5,6 I I 86.7 59.2 4 6 , 1 13,1 21.7 34,8 5.8 I I I 79.8 55.4 42,9 12,5 19,4 31.9 5.0 IV 71.1 48.9 41,1 7,9 16,7 24.5 5,5 1974 - I 71.1 50.4 40.8 9,5 17,2 26.7 3.6 I I 69.6 45.9 39,0 7,0 18,8 25.7 4.0 I I I 53.6 34.1 27.4 6,7 13,7 20.3 5.8 IV 47.7 30,4 26,1 4 . 3 11.4 15,7 5.9 1975 - I 45.8 32.0 31,1 0.9 8 , 6 9,4 5 . 3 I I 53.0 38,1 38,7 - 0 , 6 1 0 , 1 9.4 4.9 I I I 61.3 45:1 45,2 - 0 . 1 12,1 12.1 4.0 IV 68.7 50.4 50.5 r O . l 14.2 14.1 4 . 1 1976 - I 80.9 62.5 61.0 1.5 13.3 14.8 5.2 I I 74.5 55.0 55.2 —0.2 14.8 14,5 4.7 I I I 93.1 72.7 68,9 3,8 13,5 17.2 6.9 IV 99.6 78.9 76.5 2.4 13,0 15.5 7.7 1977 - I 108.5 85.9 81.6 4.2 14,0 18.2 8.6 I I 133.8 110.0 101.8 8 , 3 14,5 22,8 9.2 I I I 140.1 113.7 106,2 7.5 17.8 25.3 8.6 IV 153.6 119.4 110.2 9.2 25,6 34.8 8.7 1978 - I 133.7 105.4 96.2 9.2 19,3 28,5 9.0 I I 145.3 114.0 104,8 9.2 21,7 30,9 9,6 I I I (r) 152.4 112,5 101.4 11,1 28.1 39.2 11.8 IV (p) 152,6 120.5 109.7 10.8 21.1 31,9 11.0 NOTES:
1 Derived from data on mortgage debt outstanding from Federal Deposit Insurance Corporation, Federal Home Loan Bank Board, Institute of Life Insurance, National Association of Mutual Savings Banks, Departments of Commerce and Agriculture, Federal National Mortgage Association, Federal Housing Administration, Veterans Administration and Comptroller of the Currency. Separation of nonfarm mortgage debt by type of property, where not available, and interpolations and extrapolations, where required, estimated mainly by Federal Reserve.
2 May differ somewhat from related flow of funds series mainly because of more aggregative type of seasonal adjustment. 3 Residential mortgage debt includes nonfarm only and is sum of 1 to 4 family and multifamily mortgage debt. Digitized for FRASER
http://fraser.stlouisfed.org/ Federal Reserve Bank of St. Louis
Table 14
PRIVATE HOUSING PERMITS, STARTS,
COMPLETIONS, AND MOBILE HOME SHIPMENTS
IN THOUSANDS OF UNITS, SEASONALLY ADJUSTED ANNUAL RATES
|S»
PERMITS 1
PERIOD TOTAL 1—FAMILY 2 - O R MORE FAMILY
STARTS
TOTAL 1—FAMILY 2 - O R MORE FAMILY
COMPLETIONS
TOTAL 1—FAMILY 2 - O R MORE FAMILY MOBILE HOME SHIPMENTS 1969 1970 1971 1972 1973 1974 1975 1§76 1977 1978 1978 - J u l y Aug. Sept. Oct. Nov. Bee. 1979 - Jan. Feb. 1,324 1,352 1,925 2,219
1,820
1,074 939 1,297 1,677 1,658 1,632 1,563 1,731 1,727 1,724 1,664 1,324 1,360 626 647 906 1,033 882 644 676 894 1,125 1,078 1,035 1,020 1,092 1,135 1,114 1,149 841 814 698 705 1,018 1,186 937 431 264 403 552 581 597 543 639 592 610 515 483 546 1,407 1,434 2,052 2,357 2,045 1,3381,160
1,538 1,987 2,020 2,104 2,004 2,024 2,054 2,107 2,074 1,669 1,411 811 813 1,151 1,309 1,132 888 8921,162
1,451 1,433 1,455 1.431 1.432 1,436 1,502 1,539 1,148 964 656 621 901 1,048 914 450 268 376 375 587 646 573 592 618 605 535 521 447 1,399 1,418 1,706 1,972 2,014 1,692 1,297 1,362 1,6521,866
1,928 1,948 1,900 1,883 1,885 1,872 1,814 808 802 1,014 1,143 1,174 932 867 1,026 1,254 1,366 1,320 1,363 1,370 1,414 1,375 1,405 1,314 592 617 692 828 840 760 430 336 398 499 608 584 530 468 510 467 500 413 401 497 576 567 329 216 246 277 275 232 283 272 286 280 303 311 264 NOTES:Private building permits (for 14,000 areas with permit systems, excluding farm), starts, and completions are Census Bureau data. A dwelling unit is started when excavation begins. In the case of apartment buildings, all units are considered started at that time; however, all such units are considered completed when more than half of the units in the structure are ready for use. Private mobile home shipments are Mobile Home Manufacturers Association data convert ad to seasonally adjusted annual rate by Census Bureau.
Table 15
AVERAGE RATES AND YIELDS ON HOME MORTGAGES
PERIOD
CONVENTIONAL LOANS
PRIMARY MARKET HUD(FHA) INSURED LOANS SECONDARY MARKET BETWEEN SPREAD RETURNS ON CONVENTIONAL AND HUD(FHA) NEW HOME MORTGAGES (BASIS POINTS) NEW Aaa UTILITY BOND YIELD (M PER CENT) PERIOD
NEW HOMES EXISTING HOMES NEW HOMES
SPREAD BETWEEN RETURNS ON CONVENTIONAL AND HUD(FHA) NEW HOME MORTGAGES (BASIS POINTS) NEW Aaa UTILITY BOND YIELD (M PER CENT) PERIOD RATE (IN PER CENT)
1 SPREAD
(BASIS POINTS)
RATE (IN PER CENT)
1 SPREAD
(BASIS POINTS)
YIELD (IN PER CENT)
1 SPREAD (BASIS POINTS) DISCOUNT (PERCENTAGE POINTS) SPREAD BETWEEN RETURNS ON CONVENTIONAL AND HUD(FHA) NEW HOME MORTGAGES (BASIS POINTS) NEW Aaa UTILITY BOND YIELD (M PER CENT) 1976 - High 9.05 91 9.10 95 9.06 ' / 59 4 .3 65 8.72 Low 8.90 5 8.95 10 8.25 8 2.0 - 4 8 .05 1977 - High 9.10 99 9.20 98 9.11 73 4.7 40 8.31 Low 8.80 52 8.85 63 8.40 22 1.7 4 8.01 1978 - J a n . 9.15 MA 9.20 NA 9.11 NA 4 . 7 4 NA Feb. 9.25 54 9.25 54 NA NA NA NA 8.71 Mar. 9.30 47 9.30 47 9.29 46 4 . 1 1 8.83 Apr. 9.40 48 9.45 53 9.37 45 4 . 7 3 8.92 May 9.60 58 9.60 58 9.67 65 5 . 0 - 7 9.02 June 9.75 59 9.75 59 NA NA NA NA 9.16 July 9.80 72 9.80 72 9.92 84 3 . 1 -12 9.08 Aug. 9.80 100 9.80 100 9.78 98 2 . 1 2 8.80 Sept. 9.80 74 9.85 79 9.78 72 2 . 1 2 9.06 Oct. 9.95 72 9.95 72 9.93 55 2 . 1 2 9.23 Nov. 10.10 NA 10.15 NA 9.99 NA 3.6 11 NA Dec. 10.30 NA 10.30 NA 10.16 NA 4.8 14 NA 1979 — Jan. 10.30 NA 10.30 NA 10.17 NA 4.9 13 NA Feb. 10.35 76 10.35 76 10.17 NA 4.9 18 9.59 NOTES:
1 Gross yield spread is average mortgage return before deducting servicing costs, minus average yield on new issues of high-grade utility bonds with 5-year call protection.
Rates on conventional first mortgages (excluding additional fees and charges) are based on unweighted HUD (FHA) field office opinions on prevailing contract interest rates in the market areas of the insuring offices, rounded to the nearest 5 basis points. For secondary market data, weighted HUD office opinions on the average bid price for HUD (FHA) loans with minimum down-payment, prepaid in 15 years, for immediate delivery, are used.
Digitized for FRASER http://fraser.stlouisfed.org/ Federal Reserve Bank of St. Louis
2 4
Table 16
FNMA AUCTION RESULTS
HOME MORTGAGE COMMITMENTS
DATE OF AUCTION
GOVERNMENT-UNDERWRITTEN AMOUNT
(IN MILLIONS OF DOLLARS)
OFFERED ACCEPTED
AVERAGE YIELD
CONVENTIONAL AMOUNT
(IN MILLIONS OF DOLLARS)
OFFERED ACCEPTED AVERAGE YIELD 1978 - High Low 1979 1011(1/9) 605(1/9) 130(8/7) 80(8/7) 10.69(12/27) 9.13(1/9) July 10 503.3 327.4 10.02 24 253.4 . 144.1 10.00 Aug. 7 130.3 80.1 9.82 21 368.8 197.1 9.80 Sept . 5 351.2 154.7 9.78 18 366.7 181.2 9.79 Oct. 2 682.4 278.6 9.91 16 425.4 176.2 9.98 30 857.0 377.6 10.20 Nov. 13 452.8 182.4 10.27 27 335.2 139.4 10.33 Dec. 11 283.4 144.4 10.40 27 343.6 175.2 10.60 J a n . 3 211.0 101.1 10.67 23 93.9 54.3 10.73 Feb. 6 42.4 37.9 10.61 20 168.2 123.3 10.47 Mar. 5 265.0 141.8 10.43 19 243.3 142.6 10.42 717(5/15) 363(5/15) 75(8/7) 48(8/7) 10.92(12/27) 9.28(1/9) 169.8 90.5 10.17 146.2 88.4 10.21 74.7 47.5 10.15 150.0 81.0 10.07 199.4 126.3 10.02 285.3 157.4 10.01 395.5 166.9 10.10 336.1 148.8 10.18 425.2 179.9 10.31 488.2 199.5 10.49 373.2 187.3 10.64 262.2 141.5 10.77 155.2 79.4 10.92 71.2 36.0 11.02 42.3 22.1 11.13 19.4 17.9 11.07 43.6 27.5 11.02 47.0 33.8 10.96 97.9 79.7 10.92 NOTES:
Average secondary market yields are gross before deduction of the fee of 38 basis points paid for mortgage servicing. They reflect the average ac-cepted bid yield for home mortgages assuming a prepayment period of 12 years for 30-year loans, without special adjustment for Federal National Mortgage Association (FNMA) commitment fees and FNMA stock purchase and holding requirements on 4-month commitments. Mortgage amounts offered by bidders relate to total eligible bids received.