Informed Trading in Stock and Option Markets
SUGATO CHAKRAVARTY, HUSEYIN GULEN, and STEWART MAYHEW∗
ABSTRACT
We investigate the contribution of option markets to price discovery, using a modi-fication of Hasbrouck’s (1995) “information share” approach. Based on five years of stock and options data for 60 firms, we estimate the option market’s contribution to price discovery to be about 17% on average. Option market price discovery is related to trading volume and spreads in both markets, and stock volatility. Price discov-ery across option strike prices is related to leverage, trading volume, and spreads. Our results are consistent with theoretical arguments that informed investors trade in both stock and option markets, suggesting an important informational role for options.
INVESTORS WHO HAVE ACCESS to private information can choose to trade in the
stock market or in the options market. Given the high leverage achievable with options and the built-in downside protection, one might think the options market would be an ideal venue for informed trading. If informed traders do trade in the options market, we would expect to seeprice discoveryin the options market. That is, we would expect at least some new information about the stock price to be ref lected in option prices first.
Establishing that price discovery straddles both the stock and options mar-kets is important for several reasons. In a frictionless, dynamically complete market, options would be redundant securities. This paper contributes to the understanding of why options are relevant in actual markets, by providing the first unambiguous evidence that stock option trading contributes to price dis-covery in the underlying stock market. Further, we document that the level
∗Chakravarty is from Purdue University; Gulen is from the Pamplin College of Business, Virginia Tech; and Mayhew is from the Terry College of Business, University of Georgia and the U.S. Secu-rities and Exchange Commission. We would like to thank the Institute for Quantitative Research in Finance (the Q-Group) for funding this research. Gulen acknowledges funding from a Virginia Tech summer grant and Mayhew acknowledges funding from the Terry-Sanford Research Grant at the Terry College of Business and from the University of Georgia Research Foundation. We would like to thank the editor, Rick Green; Michael Cliff; Joel Hasbrouck; Raman Kumar; an anonymous referee; and seminar participants at Purdue University, the University of Georgia, Texas Christian University, the University of South Carolina, the Securities and Exchange Commission, the Univer-sity of Delaware, George Washington UniverUniver-sity, the Commodity Futures Trading Commission, the Batten Conference at the College of William and Mary, the 2002 Q-Group Conference, and the 2003 INQUIRE conference. The U.S. Securities and Exchange Commission disclaims responsibility for any private publication or statement of any SEC employee or Commissioner. This study expresses the authors’ views and does not necessarily ref lect those of the Commission, the Commissioners, or other members of the staff.
of contribution of the option market to price discovery is related to market frictions such as the relative bid-ask spread.
Understanding where informed traders trade also has important practical implications. The question of whether option order f low is informative is di-rectly relevant to option market makers concerned with managing adverse se-lection risk. It is also directly relevant to market makers in the underlying stock market who receive orders from option market makers attempting to hedge—if price discovery occurs in the option market, then hedging demand by option market makers may represent an indirect type of informed trading. If a sig-nificant amount of informed trading occurs in the option market, this also has implications for traders watching for signals about future price movements, and for those engaged in surveillance for illegal insider trading.
That informed investors sometimes trade in option markets can be inferred from the fact that there have been many cases where individuals have been
prosecuted and convicted of illegal insider trading in option markets.1 In the
academic literature, a number of authors have provided indirect evidence of informed trading in option markets. For example, Mayhew, Sarin, and Shastri (1995) find evidence that informed traders migrate between stock and option markets in response to changes in the option margin requirement. Easley, O’Hara, and Srinivas (1998) and Pan and Poteshman (2003) find that signed trading volume in the option market can help forecast stock returns. Cao, Chen, and Griffin (2000) and others document abnormal trading volume in the options market prior to takeover announcements.
Given this corroborative evidence that informed traders use option markets, there is surprisingly little direct evidence of price discovery in option markets. The results of Manaster and Rendleman (1982), based on daily data, seemed to indicate that price changes in option markets lead price changes in stock markets, and Kumar, Sarin, and Shastri (1992) documented abnormal option returns in a 30-minute window prior to block trades in the underlying stock. However, Stephan and Whaley (1990), Chan, Chung, and Johnson (1993), and others have analyzed the lead-lag relation between high-frequency stock and option returns, and found virtually no evidence that price changes in option
markets lead price changes in stock markets.2
In this paper, we investigate the level of price discovery in stock and option markets, in an effort to reconcile these two strands of literature, and more gener-ally, to improve our understanding of where price discovery occurs and where 1For a few examples, see SEC litigation releases 16507 (www.sec.gov/litigation/litreleases/ lr16507.htm), 16890, 17331, and 17154.
2See also Bhattacharya (1987), Diltz and Kim (1996), Krinsky and Lee (1997), Finucane (1999), O’Connor (1999), and Chan, Chung, and Fong (2002). Fleming, Ostdiek, and Whaley (1996) and others have reported that stock index futures and/or index options lead the underlying cash in-dex, but the underlying index is not a traded asset, and may be composed of stale prices. Re-cent research by Hasbrouck (2003) examines price discovery across index futures and exchange-traded funds, and finds significant price discovery in the futures, but his study does not include options.
informed traders trade. To do so, we employ the methodology of Hasbrouck
(1995), generalized in a way that is appropriate for options.3
This paper contributes to the literature in several ways. To the best of our knowledge, this is the first paper to measure directly the percentage of price discovery across the stock and option markets, and to provide direct evidence of price discovery in the option market. The significant body of research focusing on the informativeness of option markets has focused on the lead-lag relation between stock and option returns. Lead-lag analysis tends to lump together per-manent price changes, which represent new information entering the market, and transitory changes, which may result from mispricing or temporary order imbalances. If we are interested in knowing where informed trading occurs, we should focus on only the permanent component.
In addition, we investigate whether the relative rate of price discovery in the two markets is a function of firm characteristics, that can be identified in a cross-sectional analysis. Very little effort has been made in the prior literature
to examine stock and option price discovery in a cross-sectional framework.4
The existing literature has not explored whether the level of price discovery in option markets has varied significantly over time, nor has it examined whether the informativeness of option markets is related to contemporaneous market conditions, such as trading volume, bid-ask spreads, or volatility. Previous au-thors were unable to address these issues, because in order to do so with any degree of confidence, a fairly large sample is necessary. The lead-lag studies mentioned above are based on samples of three months or less. In contrast, we use tick-level data from stock and option markets for a sample of 60 firms over a five-year period. The large size of our sample attests to the robustness of our findings, and allows us to explore the cross-sectional and time-series variation in price discovery.
This paper also contributes to a strand of literature that investigates how informed trading in the option market is distributed across strike prices. The-ory suggests several factors that might inf luence the informed trader’s choice of strike price. Out-of-the-money (OTM) options offer an informed trader the greatest leverage. On the other hand, comparing transactions costs for delta-equivalent positions, bid-ask spreads and commissions tend to be widest for OTM options. Bid-ask spreads tend to be lowest for at-the-money (ATM) op-tions, while commissions tend to be lowest for in-the-money (ITM) options. Trading volume by volatility traders tends to be concentrated in ATM options, and this provides camouf lage for informed traders wishing to disguise their intensions. But ATM options also expose the informed trader to higher “vega” (volatility) risk.
The relative importance of these competing factors is an empirical question that has not yet been adequately resolved. Experimental research by de Jong, 3Hasbrouck (1995) applies the approach to determine the relative rates of price discovery for stocks that trade simultaneously on the New York Stock Exchange and regional exchanges.
4One exception is the study by O’Connor (1999), who looks at the relation between lead time and proxies for trading costs.
Koedijk, and Schnitzlein (2001) suggests that informed traders may favor ITM options. Kaul, Nimalendran, and Zhang (2002) find that the ATM and slightly OTM option spreads are the most sensitive to adverse selection measures in the stock. Anand and Chakravarty (2003) have also found that in option markets, “stealth trading” (the propensity of informed traders to fragment trades into certain size classes) is a function of leverage and the underlying liquidity of the option contract. In this paper, we directly test whether the level of price discovery is related to the option’s strike price. We also investigate whether the relative rate of price discovery for options of different strike prices can be explained by volume and spread differences.
Applying Hasbrouck’s method to the stock and ATM call options, we find evidence of significant price discovery in the options market. On average, about 17 or 18% of price discovery occurs in the option market, with estimates for individual securities ranging from about 12 to 23%. We find that option market price discovery tends to be greater when the option volume is higher relative to stock volume, and when the effective bid-ask spread in the option market is narrow relative to the spread in the stock market. We also find limited evidence suggesting that the information share attributable to the option market is lower when volatility in the underlying market is higher.
While we find no significant difference between estimates based on ATM and ITM options, the information share estimate tends to be higher for OTM options, on average across the 60 stocks. This suggests that leverage may be the primary force driving price discovery in the options market. Cross-sectional analysis reveals that the relative rate of price discovery in ATM and OTM op-tions depends on the relative trading volume and bid-ask spreads for those options. That is, ATM information shares are higher, compared to OTM in-formation shares, when ATM options have high volume and narrow spreads, compared to OTM options. In most cases, this effect appears to be of secondary importance, compared with the effects of leverage. A notable departure from the above is IBM. This is the most actively traded option in our sample, and also the option with the lowest ratio of OTM volume to ATM volume and the highest ratio of OTM spread to ATM spread. Information share estimates indicate that for IBM, price discovery is higher for ATM options than for OTM options. Our evidence is consistent with the view that informed traders value both leverage and liquidity.
The remainder of this article is organized as follows. In Section I, we review some of the theoretical and empirical literature on the informational role of option markets. In Section II, we summarize the Hasbrouck (1995) method and describe the modifications necessary to apply it to the options market. Our data sources are described in Section III. Section IV presents our main results on price discovery in the stock and ATM call options. In Section V, we extend the analysis to OTM and ITM options, and seek to explain cross-sectional variation in the relative information share measures of ATM and OTM options. In Section VI, we report some additional robustness tests. Section VII summarizes our results and contains suggestions for future research.
I. Background and Motivation
The relatively sparse theoretical research on the informational role of options markets focuses mostly on the impact of option trading on the equilibrium dynamics of stock and options prices (see, for example, Back (1993), Kraus and Smith (1996), Brennan and Cao (1996), Grossman (1988)).
More directly relevant to the current research is the question of where in-formed traders choose to trade. As argued by Black (1975), inin-formed investors may be attracted by the high leverage achievable through options. For insiders engaged in illegal trading, the choice of trading venue may be inf luenced by the perceived probability of being detected and successfully prosecuted. For exam-ple, Sacksteder (1988) reviews a number of legal reasons that the courts have denied option traders the right to sue corporate insiders under Rule 10b-5 (see also Hyland, Sarkar, and Tripathy (2002)).
A number of authors have developed “sequential-trade” models, where in-formed traders can trade in either the stock or option market (see, for exam-ple, Biais and Hillion (1994), Easley et al. (1998), and John et al. (2000)). In short, these papers suggest that the amount of informed trading in option mar-kets should be related to the depth or liquidity of both the stock and option markets, and the amount of leverage achievable with the option. Additionally, Capelle–Blancard (2001) presents a model in which some investors are pri-vately informed about the stock value and others are pripri-vately informed about volatility. His results suggest that when there is greater uncertainty, there is likely to be more price discovery in the stock market and less in the option market.
Several authors have also found empirical evidence consistent with the theo-retical prediction that informed traders should sometimes trade in the options market (see, Mayhew et al. (1995), Easley et al. (1998), Cao et al. (2000), Arnold et al. (2000), Frye, Jayaraman, and Sabherwal (2001), and Pan and Poteshman (2003)). Beyond academic research, a review of SEC litigation releases reveals that it is quite common for legal cases to be brought against insiders for trading in the option market.
Despite all this evidence of informed trading in option markets, there is sur-prisingly little evidence that new information is ref lected in option pricesbefore
stock prices. Indeed, there is a substantial body of empirical research focus-ing on which market leads (or lags) in terms of information arrival, through Granger lead-lag regressions and similar techniques (see Manaster and Rendleman (1982), Stephan and Whaley (1990), Vijh (1990), Chan et al. (1993), Finucane (1999), and Chan et al. (2002)). While these studies come to conf lict-ing conclusions as to whether the stock market leads the option market, they
consistently find no significant lead for the options market.5
An emergent stream of the literature has delved into the microstructure of options markets in order to understand the relation between information transmission in the two markets, leverage, and liquidity-related variables like 5This conclusion applies to the individual stock market, not the index options market where the underlying is not a traded asset.
spreads and volume more closely. For example, Lee and Yi (2001) test to see if the greater leverage and lower trading costs make options more attractive to informed traders or if the relative lack of anonymity in options markets discourages large investors from trading options. Using a sample of relatively active stocks and their options, the authors find that the adverse selection component of the bid-ask spread decreases with option delta, implying that options with greater financial leverage attract more informed investors. Kaul et al. (2002) examine the relation between adverse selection in the underlying stock and spreads on options of different strike prices. Their main finding is that adverse selection costs are highest for ATM or slightly OTM options. The authors argue that this result is consistent with the trade-off between high leverage and transaction costs.
Anand and Chakravarty (2003) demonstrate the presence of a disproportion-ately large cumulative stock price impact of intermediate size trades, a phe-nomenon also referred to as “stealth trading.” In particular, the authors find the presence of stealth trading restricted to options that are near the money, and within this moneyness category, stealth trading is achieved through medium (small) size option trades in relatively high (low) volume contracts. The under-lying intuition of this finding lies in informed traders seeking a balance in their option trading between moneyness, or leverage, of a contract with their ability to hide behind the overall trading volume in the contract. Thus, even with fa-vorable moneyness, but relatively low volume contracts, informed traders trade through small-size trades while for relatively higher volume options contracts, they trade stealthily through medium-size trades.
In a significant departure from a conventional analysis of the options mar-kets, de Jong et al. (2001) use an experimental approach to examine the impli-cations of asymmetric information for informational linkages between a stock and its traded call option. Their main finding is that an insider trades aggres-sively in both the option and the stock with most trades directed to the asset that affords the most profitable trading opportunity. They also find that trades in the stock market imply quote revisions in the options market and vice versa. Hence, price discovery takes place in both markets.
Overall, the contribution of the current paper is on two distinct levels. First, the conclusions emerging directly from the lead-lag literature between stock and options prices is that informed trading does not take place in options mar-kets. However, the research described above by Cao et al. (2000), Easley et al. (1998), Pan and Poteshman (2003), and others finds that certain options trades could contain information about future stock price movements, thereby suggesting that informed traders do trade in options markets. Our paper is an effort to resolve these disparate conclusions about whether informed traders would trade in the options markets at all. We do so by explicitly accounting for a common omission in the extant research in not distinguishing between per-manent and temporary price changes when investigating for informed trading in the options markets.
Having found evidence of significant informed trading in the options mar-kets, our second level of contribution lies in using the information shares
approach to provide a detailed look at just what kinds of contracts—in terms of leverage, moneyness, and liquidity—have the largest information share and, by extension, are preferred by the informed traders. This leads us to a better un-derstanding of the relative importance of these factors in the informed trader’s decision of where to trade, or more generally, what factors contribute to price discovery.
To accomplish both of these objectives, we use the methodology proposed by Hasbrouck (1995), based on an information-share approach that measures the contribution of the innovation in the price process in one market (say the option market) to the total variance of the innovation in the permanent component of
the price vector spanning both (stock and option) markets.6While Hasbrouck
applies his approach to measuring the information shares of stocks trading in the NYSE versus the same stocks trading in the regional stock markets, the technique itself is an elegant way to capture where price discovery occurs in closely linked securities trading in multiple markets. For example, Hasbrouck (2003) uses the technique to measure the information shares of f loor-traded index futures contracts, exchange traded funds, E-mini contracts, and sector exchange traded funds contributing to the price discovery in three U.S. eq-uity index markets (S&P 500, S&P MidCap 400, and Nasdaq-100). Booth et al. (2002) use the same technique to measure the price discovery by upstairs and downstairs markets in Helsinki Stock Exchange and Huang (2002) uses it to measure the price discovery in Nasdaq stocks by electronic communication net-works and Nasdaq market makers. We apply the technique to study the share of price discovery between a stock and its corresponding options, as explained in detail in the next section.
II. Methodology
Hasbrouck (1995) presents an econometric method for estimating, for securi-ties traded in multiple markets, each market’s contribution to price discovery. As Hasbrouck notes, the procedure may be generalized to the case of different securities that depend on the same underlying state variable. He illustrated the method in the context of a stock trading on multiple exchanges. This ap-plication is fairly simple, because the stock prices on the two exchanges are cointegrated, with a known vector of cointegration.
In our case, the stock and option prices may be linked by arbitrage, but this does not mean that one can find a constant cointegration vector for the time series of stock and option prices. Indeed, it is well known that hedge ratios change over time, in response to changes in the stock price. However, one can use an option model to convert option prices into implied stock prices, in the spirit of Manaster and Rendleman (1982) and Stephan and Whaley (1990).
6For additional information on Hasbrouck’s technique along with alternative measures of price discovery, see Baillie et al. (2002), de Jong (2002), Harris, McInish, and Wood (2002), Hasbrouck (2002), and Lehmann (2002).
Let V represent the implicit, efficient stock price, which serves as a state variable underlying observed stock and call option prices. Then, the observed stock price at timet, can be written as
St=Vt+es,t, (1)
wherees,tis a zero-mean covariance-stationary process representing the pricing error due to microstructural frictions such as bid-ask bounce and inventory effects.
Let us denote the observed price of the call option byCt. In addition, the option price is assumed to be related to the underlying state variable by a theoretical option pricing modelf():
Ct= f(Vt;σ), (2)
where σ represents one or more parameters governing the volatility of the
underlying asset.7An implied stock price is calculated by inverting the option
model with respect to the underlying asset price:
It = fV−1(Ct;σ). (3)
In general, one could use any option model for f, but we will use a
bino-mial tree that explicitly accounts for the early exercise feature and multiple discrete dividends. Like Black–Scholes, this model assumes that volatility is
represented by a constant parameter,σ. It is important to emphasize that we
never use an implied volatility from one option to calculate an implied stock price on another option with a different strike price or maturity. To do this could introduce a large bias into the estimate if the constant volatility model is not true.
A difficulty arises because the volatility parameterσ is not observable. An
implied volatility parameter can be expressed as a function of the stock price, the option price, and the other parameters by inverting the option price with respect to volatility
ˆ
σt= fσ−1(Vt;Ct), (4) but this requires that we know the true stock price. We cannot use the observed stock priceSt, for then tautologically the implied stock price would equal the ob-served stock price. The solution to this problem is to calculate implied volatility using a lagged option price and lagged observed stock price
It = fV−1(Ct; ˆσt−k)
= fV−1Ct; fσ−1(St−k;Ct−k). (5)
7Of course, the option price also depends on other inputs, such as the risk-free rate, maturity, and strike price. For convenience, we have suppressed these other inputs in the notation.
We would like to estimate the implied stock price using a lagk that is long enough so that the errors es,t and es,t−k are essentially uncorrelated. If the
lag is too long, however, then the assumption that σ is constant over time
becomes unrealistic. Stephan and Whaley (1990) estimate ˆσ using stock and
option prices from the previous day. Inspired by evidence that implied volatility may change intraday, we use stock and option prices lagged by 30 minutes.
Since the two price series are cointegrated, the information share approach of Hasbrouck (1995) can be used to measure each market’s relative contribution to price discovery. The information share approach assumes that the prices from both markets share a common random walk component referred to as the efficient price. The information share of a market is measured as that market’s contribution to the total variance of the common random-walk component. More
formally, let us denote a price vectorpincluding both the observed stock price
and the implied stock price
pt= St It = Vt+es,t Vt+eI,t . (6)
The common efficient priceVtis assumed to follow a random walk
Vt =Vt−1+ut, (7) where E(ut)=0,E(ut2)=σu2, andE(utus)=0 for t=s. Then, by the Granger Representation Theorem (Engle and Granger (1987)), these cointegrated prices can be formulated as a vector error correction model of order M
pt =A1pt−1+A2pt−1+ · · · +AMpt−1+γ(zt−1−µ)+t, (8)
where pt is 2 × 1 vector of prices;Ai is a 2×2 matrix of autoregressive
co-efficients corresponding to lag i; (zt−1−µ) is the error correction term with zt−1=p1t−1−p2t−1andµ=E(zt). Alternatively, the price vector can be repre-sented as a vector moving average model
pt=t+ψ1t−1+ψ2t−2+. . ., (9)
whereis a 2×1 vector of zero-mean innovations with variance matrix .
LetIdenote a 2×2 identity matrix. From the above formulation, the sum of
all the moving average coefficient matricesψ(1)=I+ψ1+ψ2+ · · ·has
identi-cal rowsψ. Sinceψref lects the impact of innovations on the permanent price
component rather than transitory components, the total variance of implicit
efficient price changes can be calculated asψ ψ. Following Hasbrouck (1995),
the contribution to price discovery by each market is measured as each mar-ket’s contribution to this total innovation variance. If price innovations across
markets are uncorrelated (or if the innovation covariance matrix is diagonal),
the information share of marketjis given by
Sj = ψ2
j j j
ψ ψ, (10)
whereψjindicates thejth element ofψ, and jjrepresents thejthdiagonal
ele-ment of . If the price innovations across markets are correlated, as is usually
the case, then the information share is not uniquely defined. In this case, one can only compute a range of information shares instead of a point estimate. The upper and lower bounds of this range can be computed by orthogonalizing co-variance matrix and trying all alternative rotations. To minimize the impact of time aggregation on the correlation of price innovations and to better ref lect the price updating sequence between the markets, the models are estimated with one-second sampling intervals. In all the specifications, VAR lags up to 300 seconds are used. To keep the estimations manageable, polynomial distributed lags are employed, as in Hasbrouck.
Following Hasbrouck (1995), information share bounds are computed each day for each stock using intraday transactions data. Daily estimates are then aggregated in various ways across stocks, over time, and for subsamples defined by characteristics such as volume and volatility. This allows us to investigate the cross-sectional and time-series determinants of the level of price discovery in the option market.
III. Data
Our analysis is based on five years of transactions data for 60 stocks that are listed on the New York Stock Exchange (NYSE) and that have options trad-ing on the Chicago Board Options Exchange (CBOE). Stock market trade and quote data were obtained from the Institute for the Study of Securities Markets (ISSM) database for the period 1988 to 1992. Trades and quotes from the op-tions market were obtained from the Berkeley Opop-tions Data Base. The sample is composed of the 60 most actively traded stock options on the CBOE over this period. The firms in our sample are listed in Table I. The stock quotes are re-stricted to those emanating from the New York Stock Exchange, as Hasbrouck (1995) has documented that only a very small level of price discovery occurs on the regional exchanges.
At the time period covered by our sample, these options were listed only on the CBOE. This simplifies our analysis, as we do not have to worry about price discovery that may be occurring on competing option markets. Today, nearly all actively traded options are listed on multiple option exchanges. To properly examine this issue using more recent data, one should include data from all exchanges. An interesting extension of our analysis would be to examine the relative price discovery across competing option markets. For the present paper, we feel that the presence of multiple option exchanges would distract us from our main research question.
Table I
Option Market Information Shares
This table reports lower and upper bounds on the option market information shares along with volume, effective spread, and volatility measures for the firms in our sample. Information share bounds are time-series averages of daily estimates. Option volume is measured as the time-series average of daily contract volume for all options on the firm. Stock volume (in thousands) is measure as the time-series average of stock volume as reported in CRSP. Volatility is measured as the annualized average squared daily return, using total returns data reported in CRSP.
Option Market
Information Share Summary Statistics Lower Upper Option Stock Option Stock
Company Name Bound Bound Volume Volume Spread Spread Volatility
ALCOA 0.176 0.183 524.2 394.4 0.149 0.123 0.283 AMOCO 0.178 0.180 649.3 583.9 0.103 0.113 0.237 ATLANTIC RICHFIELD 0.118 0.122 663.4 312.7 0.153 0.153 0.199 AVON PRODUCTS 0.204 0.206 2203.0 423.9 0.089 0.116 0.370 BOEING 0.148 0.150 2408.2 943.9 0.095 0.119 0.271 BANKAMERICA 0.177 0.179 1867.3 976.7 0.084 0.109 0.393 BAXTER INTERNATIONAL 0.178 0.180 1024.0 780.3 0.077 0.106 0.294 BRUNSWICK CORP 0.202 0.229 553.6 320.5 0.084 0.115 0.436 BLACK AND DECKER 0.181 0.186 552.6 405.0 0.082 0.115 0.486 BRISTOL MYERS SQUIBB 0.181 0.183 2030.5 950.9 0.082 0.121 0.223 BURLINGTON NORTHERN 0.173 0.215 405.2 339.6 0.136 0.135 0.332 BETHLEHEM STEEL 0.170 0.172 674.1 377.1 0.074 0.103 0.417 CHRYSLER 0.233 0.235 2542.5 921.3 0.063 0.113 0.404 CBS 0.149 0.174 283.1 58.0 0.215 0.440 0.209 CITICORP 0.174 0.184 2597.7 1481.4 0.070 0.099 0.419 COLGATE PALMOLIVE 0.176 0.191 300.5 244.5 0.133 0.125 0.251 DELTA AIR LINES 0.163 0.174 759.8 293.3 0.128 0.135 0.288
DOW CHEMICAL 0.149 0.150 1541.1 654.9 0.095 0.123 0.261 EASTMAN KODAK 0.174 0.176 3187.4 1009.4 0.069 0.115 0.269 FORD MOTOR CO 0.170 0.172 2859.8 1148.5 0.074 0.112 0.287 FEDERAL EXPRESS 0.194 0.196 638.2 226.0 0.129 0.141 0.366 FLUOR CORP 0.195 0.197 537.6 339.0 0.101 0.132 0.387 GENERAL ELECTRIC 0.157 0.159 4012.1 1376.9 0.072 0.115 0.226 CORNING 0.166 0.168 344.0 230.7 0.144 0.147 0.330 GENERAL MOTORS 0.162 0.164 3381.7 1353.5 0.075 0.111 0.293 HALLIBURTON 0.180 0.200 509.4 494.4 0.111 0.122 0.374 HOMESTAKE MINING 0.170 0.196 1158.6 372.0 0.081 0.106 0.424 HEINZ 0.166 0.187 639.6 355.5 0.109 0.120 0.265 HONEYWELL 0.174 0.180 704.3 221.7 0.150 0.143 0.260 HEWLETT PACKARD 0.161 0.164 2152.7 672.5 0.085 0.117 0.357 IBM 0.190 0.195 22175.8 1677.9 0.086 0.128 0.223 INTERNATIONAL PAPER 0.164 0.166 725.9 479.9 0.115 0.127 0.259 ITT INDUSTRIES 0.177 0.212 517.0 321.7 0.123 0.143 0.233 JOHNSON AND JOHNSON 0.143 0.145 1874.8 651.1 0.113 0.118 0.236
K MART 0.184 0.192 1108.5 675.0 0.084 0.105 0.307 COCA COLA 0.146 0.147 1905.7 876.7 0.097 0.104 0.261 LIMITED INC 0.172 0.173 978.0 858.5 0.094 0.106 0.428 MCDONALDS 0.172 0.175 1109.6 834.1 0.083 0.119 0.274 MINNESOTA M&M (3M) 0.156 0.161 785.8 434.1 0.114 0.131 0.202 MOBIL 0.180 0.181 776.0 700.6 0.105 0.113 0.216
Table I—Continued Option Market
Information Share Summary Statistics Lower Upper Option Stock Option Stock
Company Name Bound Bound Volume Volume Spread Spread Volatility
MERCK 0.124 0.127 3146.2 884.5 0.109 0.133 0.226 MONSANTO CO 0.150 0.193 373.6 333.3 0.164 0.140 0.253 NATIONAL SEMI 0.212 0.231 987.8 785.8 0.064 0.109 0.592 OCCIDENTAL PETROLEUM 0.188 0.205 1407.5 813.7 0.066 0.119 0.316 PEPSICO 0.188 0.190 1772.8 1056.4 0.068 0.107 0.289 POLAROID 0.203 0.212 2163.6 351.5 0.092 0.118 0.386
PAINE WEBBER GROUP 0.186 0.218 305.2 173.0 0.099 0.122 0.430
PENNZOIL 0.181 0.184 264.8 96.3 0.147 0.150 0.220
SEARS ROEBUCK & CO 0.189 0.190 1934.1 767.7 0.073 0.099 0.292 SCHLUMBERGER LTD 0.154 0.164 729.5 615.7 0.138 0.131 0.308 SYNTEX 0.160 0.162 3042.0 684.9 0.103 0.112 0.327 AT & T 0.195 0.197 2990.3 1824.6 0.064 0.105 0.250 TOYS R US 0.168 0.170 821.4 729.9 0.108 0.110 0.387 TEXAS INSTRUMENTS 0.179 0.181 1106.9 429.2 0.106 0.114 0.369 UPJOHN CO 0.202 0.205 5575.0 764.4 0.076 0.117 0.315 UNITED TECHNOLOGIES 0.183 0.200 384.0 369.7 0.109 0.119 0.271 WAL MART 0.208 0.210 2362.4 1022.5 0.087 0.110 0.285 WEYERHAEUSER CO 0.179 0.195 332.3 439.9 0.110 0.108 0.318 EXXON 0.165 0.166 2071.6 1251.6 0.071 0.100 0.217 XEROX 0.178 0.182 1009.2 323.3 0.087 0.130 0.251 Mean 0.1746 0.1829 Std. error of mean 0.0026 0.0030
Records in both of these databases are time-stamped to the nearest second, allowing us to merge the two. Fortunately, each record in the Berkeley Options Data Base contains the most recent trade price recorded in the underlying stock market. This makes it possible to ensure that the clocks at the two ex-changes are synchronized, by cross-referencing the stock prices reported in the two databases.
Table I provides summary statistics for the 60 stocks in our sample. For each firm in our sample, the table reports the average daily option contract volume (aggregated across strikes and maturities), average daily stock volume (in 1,000’s of shares), average effective spreads for ATM short-term options and for the underlying stock, and the volatility of the underlying stock.
IV. Results
The first issue we wish to address is whether any significant price discov-ery occurs in option markets. As discussed above, the results of Mayhew et al. (1995), Easley et al. (1998) and others suggest that it does, but the lead-lag studies of Stephan and Whaley (1990), Chan et al. (1993) and others suggest
not. We can address this question directly by examining the estimated informa-tion share for opinforma-tion markets. Our results, reported in Secinforma-tion IV.A., indicate that some price discovery does occur in option markets. In Section IV.B., we examine the extent to which there is variation in the amount of option price discovery over time. Next, in Section IV.C., we examine whether there is sig-nificant variation in the amount of option price discovery across firms, and whether price discovery is cross-sectionally related to variables such as trading volume, volatility, or effective spreads. We reject the null hypothesis that the mean information share attributable to option markets is equal across all the firms in our sample. Also, we find evidence that price discovery in the option market is related to trading volume and bid-ask spreads in the two markets, and to the volatility of the underlying stock.
A. Information Share in Stock and Option Markets
Our results indicate that significant price discovery does occur in option markets. Firm-by-firm results are reported in Table I. The lower- and upper-bounds reported in this table represent time-series averages of option market information shares across five years of daily estimates. These estimates range from (11.76 to 12.19%) for Atlantic Ritchfield to (23.31 to 23.52%) for Chrysler. Across the 60 stocks in our sample, the average lower bound on the information share attributable to option markets is 17.46% and the average upper bound
is 18.29%.8Based on the standard error of the mean of 60 information share
estimates as reported in the table, these averages are significantly different from zero at the one percent level.
In the subsequent two sections, we examine the time-series and cross-sectional determinants of variation in estimates of information shares.
B. Time-series Variation in Information Share
Table II reports lower bounds and upper bounds, averaged across stocks and across days for yearly subperiods, along with yearly averages for the volume and spread variables. The information share attributable to the option market appears to have decreased slightly over our sample period. This may be related to the fact that between 1988 and 1992, trading volume increased in the stock market but decreased in the option market. Stock and option spreads do not appear to have changed appreciably over this period. Table II also reveals that the difference between the upper bound and lower bound is somewhat tighter in the earlier part of our sample. Examining the monthly averages, depicted 8It is important to recall that these bounds do not represent confidence intervals around a point estimate, rather they are due to insufficient identification. Since the price innovations are generally correlated across both markets, the variance covariance matrix of the innovations will not be diagonal. As a result, a unique value for the information share cannot be obtained. As suggested by Hasbrouck (1995), the covariance matrix can be orthogonalized to obtain the upper and lower bounds of the information shares.
Table II
Option Market Information Share over Time
Lower-bound and upper-bound on the information share attributable to option markets, reported by year. Each number represents the average estimated bound across days in the year and across stocks. Average daily option contract volume (in thousands), average daily stock volume (in thou-sands), and average effective option and stock spreads are also reported by year.
Lower Upper Option Stock Option Stock
Year Bound Bound Volume Volume Spread Spread
1988 0.1841 0.1856 2.1741 592.8314 0.1050 0.1232 1989 0.1827 0.1842 2.4221 662.9404 0.0957 0.1102 1990 0.1736 0.1805 2.1532 690.4711 0.1025 0.1301 1991 0.1670 0.1820 2.1125 753.4264 0.1009 0.1343 1992 0.1591 0.1723 1.9366 859.3466 0.1021 0.1390 0 0.05 0.1 0.15 0.2 0.25 0.3 1988 1989 1990 1991 1992 1993 Information Share Year
Figure 1. Upper and lower bounds on the information share attributable to the option
market.The points are cross-sectional time series averages across days in the month and across
stocks.
graphically in Figure 1, we see that the bounds became wider sometime around 1990. The timing of this change corresponds roughly to the widespread imple-mentation of “autoquote” technology, that allowed market makers to update their quotes much more quickly in response to changes in underlying stock prices.
C. Cross-sectional Variation in Information Shares
The equality of means of information shares (IS) across assets can be tested via moment conditions in GMM:εi=ISi−µi1, whereµi is firm i’s mean
in-formation share parameter to be estimated and1is the vector of ones. To test
the equality of the means of option information shares for the 60 stocks in our sample, we use the following moment conditions:
ε1=I S1−µ1 ε2=I S2−µ1 .. . ε60=I S60−µ1 . (11)
Note that the model is overidentified—there are 60 orthogonality conditions
and only one parameter,µ, to estimate. In this special case, Hansen’sχ2test
of overidentifying restrictions provides a natural test of the null hypothesis:
H0:µ1= · · · =µn.Performing this test on our sample results in aχ2statistic of 213.04 with 59 degrees of freedom, indicating that the hypothesis of equal means is rejected at the one percent significance level.
Having established that the mean information shares are not equal across stocks, we now wish to examine whether the amount of price discovery in option markets is related to observable market characteristics. To the extent that information is incorporated into prices through trading, we would expect to see a relation between price discovery and trading volume in both markets. There may also be a relation between price discovery and bid-ask spreads in either market. On one hand, the spread is a measure of trading costs, and informed traders may be attracted by narrower spreads, which would suggest an inverse relation between price discovery and spreads. On the other hand, if market makers set wider spreads in fear of informed trading, this might induce a positive relation. Finally, we suggest that there might be a relation between volatility and the level of price discovery in option markets.
Panel A of Table III reports parameter estimates for a pure cross-sectional
regression, with one observation for each security (N=60), and all variables
are aggregated over the entire sample period. The dependent variable is the midpoint of the lower and upper bound on the option information share. Ex-planatory variables include the ratio of option volume to stock volume, the ratio of effective spreads in the option to those on the stock, and stock volatility. Panel B reports the results for the same model estimated using a technique
of Fama and MacBeth (1973).9 Finally, to integrate the time-series dimension
into the cross-sectional analysis, we estimate a pooled regression model using 9See Fama and MacBeth (1973). The resulting parameter estimates are time series averages of monthly regression coefficient estimates. The statistical significance is ascertained by using the standard errors of the time series averages of the regression parameters. This allows us to control for the estimation error due to correlation of regression residuals across firms. Since the existence of autocorrelation in the parameter estimates from month-by-month regressions would
Table III
Determinants of Option Market Price Discovery
Results are based on the stock and near-term, near-the-money call options. Panel A reports coeffi-cient estimates andt-statistics for the following cross-sectional regression model:
S H AR Ei=a1+b1V O L R AT I Oi+b2S P R AT I Oi+b3V O L AT I LI T Yi
whereSHAREiis the time-series average midpoint of the lower and upper bound on the option
market information share,VOLRATIOis the ratio of option volume to stock volume, andSPRATIO is the ratio of effective option spread to effective stock spread, andVOLATILITYis measured as the average root squared daily return. Panel B reports time-series averages for monthly estimates of the same equation, in the spirit of Fama and MacBeth. Panel C reports coefficient estimates and t-statistics for the following pooled time-series cross-sectional regression model, estimated on daily data:
S H AR Eit=ai+b1V O L R AT I Oit+b2S P R AT I Oit+b3E X R E Tit2.
The dependent variable is the midpoint of the lower and upper bound on the option market in-formation share,VOLRATIOis the ratio of option volume to stock volume, andSPRATIOis the ratio of effective option spread to effective stock spread, andEXRET2is the squared excess return.
Model (1) is a constrained model where all firms have the same intercept (ai=afor alli). Model
(2) is a fixed-effects model, where each firm has its own intercept. Individual firm intercepts are suppressed.
Intercept VOLRATIO SPRATIO VOLATILITY
Panel A. Results from Cross-sectional Regression
0.225251 1.269449 −0.050196 −0.002943
(9.42) (1.02) (−2.78) (−1.62)
Panel B. Time-series Average of Monthly Coefficient Estimates
0.178733 2.768003 −0.019865 −0.031129
(15.46) (3.84) (−1.88) (−1.81)
Panel C. Results from the Pooled Time-series Cross-sectional Regression Model
Model Intercept VOLRATIO SPRATIO EXRET2
1 0.162759 3.239976 −0.011471 −0.000479
(61.54) (9.57) (−4.72) (−4.56)
2 3.659829 −0.004599 −0.000525
(6.95) (−1.83) (−4.86)
daily estimates of all variables. We use the daily squared excess return over the S&P 500 index as a measure of firm-specific volatility. We estimate this model both with and without fixed effects. Line one in Panel C of Table III reports coefficient estimates for a pooled regression where all firms are constrained to bias the statistical significance, we adjust the standard errors of the average slopes to control for the autocorrelation. The autocorrelation adjustment is made in two ways. First, we adjusted the standard errors for first-order autocorrelation by multiplying the standard errors of the average parameters by
1+ρ
1−ρ whereρis the first-order autocorrelation in monthly parameter estimates.
Thet-statistics in the table ref lect this first-order autocorrelation correction. Second, we used the
Newey and West (1987) correction with 12 lags. The results are qualitatively similar under this alternative adjustment.
have the same intercept. Line two in the same panel reports the fixed-effects model, where firms are identified by dummy variables.
In all four specifications, the coefficient on the ratio of option volume to stock volume is positive, and the coefficient on the ratio of option effective spread to stock effective spread is negative. Although the degree of statistical significance varies somewhat across specifications, our results indicate that price discovery is associated with high trading volume and narrow bid-ask spreads. Our find-ings are consistent with the results of Fleming et al. (1996), who find that low trading costs are conducive to price discovery. This effect seems to be strong enough to overcome any tendency for market makers to respond to adverse
selection by quoting wider bid-ask spreads.10 We also find a negative
coeffi-cient on volatility in the cross-sectional regressions, and a negative coefficoeffi-cient on squared excess return in the panel regression. Thus, we provide empiri-cal support for the theoretiempiri-cal prediction of Capelle–Blancard (2001) that less price discovery occurs in the option market when the level of uncertainty is high.
To further understand the direct impact of option volume, stock volume, op-tion spread, and stock spread on the opop-tion market informaop-tion share we re-peated the analyses on Table III using an alternative specification in which the option volume, stock volume, option spread, and stock spread all enter the regression equations as separate variables. In all four specifications under this new model, the coefficient on the option (stock) volume is positive (negative) and the coefficient on the option (stock) effective spread is negative (positive), indicating that more price discovery occurs in the option market when option volume is higher and stock volume is lower, and when option effective spreads are narrower and stock effective spreads are wider. We do find, however, in this specification, that the sign of the volatility coefficient is not robust to the model specification. The results of this specification are available upon request.
In addition, note that the information share as a dependent variable lies in the interval [0,1]. There is no guarantee in this regression framework that the predicted values will lie in [0,1]. Therefore, as an additional robustness check, we also estimated a separate set of regressions where we applied a logit transformation to the dependent variable. The results, available on request, are qualitatively the same under this alternative specification.
V. Information Share and Strike Price
To this point, our analysis has focused on estimating price discovery in near-term, near-the-money options, which tend to be the most actively traded and liquid of all options. As discussed above, there are conf licting theoretical pre-dictions as to which strike prices informed traders will choose. In this section,
10This result is consistent with those of Cornell and Sirri (1992) and Chakravarty and McConnell (1997, 1999), who found no significant change in spreads around known cases of illegal insider trading. The argument is that if the market maker does not know about the informed trading, or if the market maker is able to step aside and match informed trades with uninformed trades, he does not personally feel the increased adverse selection and spreads do not widen.
we extend our analysis of price discovery to options that are in- and out-of-the-money.
We begin with a caveat. Option market makers view the incoming order f low on all option series, and have the technology to update quotes simultaneously. Thus, information revealed in one series can spread quickly to all other options, making it more difficult to distinguish price discovery across multiple options. However, we should note that updating of option prices from other option prices is not automatic—it requires an active intervention from a market maker. Also quotes may be revised not only by market makers, but as a result of public limit orders. Thus, it is not uncommon to see one option price move first, and the others follow. Although the view may be somewhat clouded, we believe that differences in estimated information shares across strike prices ref lect, at least to some extent, differences in levels of price discovery across strikes.
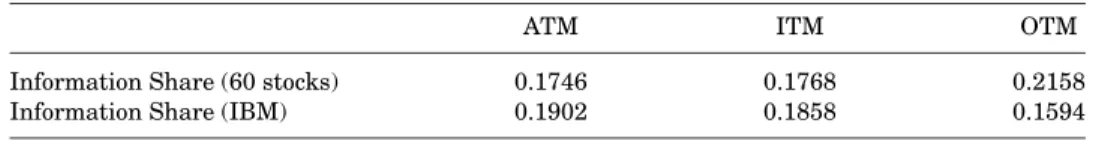
To investigate the relation between strike and price discovery, we repeat our analysis of at-the-money (ATM) options, reported above, for out-of-the-money (OTM) and in-the-money (ITM) options. As before, ATM options are defined as having a strike price within five percent of the underlying stock price. Table IV Panel A reports the average information shares for the three moneyness cate-gories, across the 60 stocks and across all the days in our sample. Using Mann-Whitney test statistics, across all 60 stocks, we find no significant difference between information shares for ATM and ITM options. On the other hand, we
Table IV
Information Share by Option Moneyness
This table reports information share results for the three moneyness categories. At-the-money options (ATM) are defined as those with strike prices within five percent of the current stock price. Out-of-the-money (OTM) options are calls with strike prices more than five percent above the stock price. In-the-money options (ITM) are calls having strike prices more than five percent below the stock price. Panel A reports the average information share for the total sample of 60 stocks and for IBM as a special case. Panel B reports coefficient estimates andt-statistics for the following regression model, estimated on daily data:
I S R AT I Oit=ai+b1V O L R AT I Oit+b2S P R AT I Oit
whereISRATIOis the ratio of daily option market information share of OTM options to that of ATM options,VOLRATIOis the ratio of OTM option volume to ATM option volume andSPRATIO is the ratio of OTM relative spread to ATM relative spread.
Panel A. Information Share
ATM ITM OTM
Information Share (60 stocks) 0.1746 0.1768 0.2158
Information Share (IBM) 0.1902 0.1858 0.1594
Panel B. Regression Results
Intercept VOLRATIO SPRATIO
1.78682 0.01794 −0.01228
find the average information share to be significantly higher for OTM options than for ATM options, around 21% as opposed to 17%. This supports the theory that informed traders are attracted by the higher leverage achievable through OTM options.
Having identified a significant difference between price discovery of OTM and ATM options, we proceed to examine whether this difference is inf luenced by the same factors as the relative rate of price discovery across stocks and options. A preliminary glance at the trading volume and bid-ask spreads suggests that this is likely to be the case. For example, compared to the other 59 stocks in our sample, IBM has unusually high ATM trading volume relative to OTM volume, very low ATM bid-ask spread relative to OTM spread, and a resulting information share is higher for ATM options than OTM options. To analyze this further, we regressed the ratio of the OTM to ATM information shares on the ratio of OTM to ATM trading volume and on the ratio of OTM to ATM relative spreads. Results are reported in Panel B of Table IV. As expected, we find the ratio of information shares to be positively related to the volume ratio, and negatively related to the spread ratio, with both coefficients statistically significant at the 5% level. Consistent with the results from Section IV.A. above, price discovery tends to be highest where trading volume is high and bid-ask
spreads are narrow.11
VI. Robustness
In order to investigate the sensitivity of our results to empirical design choices, we conducted several robustness checks. In our main analysis, implied stock prices are computed from implied volatilities lagged by 30 minutes. The choice of a 30-minute lag ref lects a trade-off. If we use a lag that is too short, our implied stock price estimate may incorporate information from recently ob-served stock prices that is not yet ref lected in the option price. This may bias our result in favor of finding too much price discovery in the option market. On the other hand, a short lag will help us avoid mistakenly impounding changes in market volatility forecasts into the implied stock price. For example, if the price of a call option increases because the market has revised upwards its volatility forecast, we will mistakenly treat this as a higher implied stock price, until the new volatility is incorporated 30 minutes later. Thus, intraday changes in volatility forecasts will cause the temporary component of the option-implied stock price to have a higher variance.
The magnitude of this problem is a function of the degree to which implied volatility changes intraday. In our data, we did find statistically significant intraday changes in implied volatility, and for this reason, we chose to use a lag of 30 minutes rather than the one-day lag used in the lead-lag studies of Stephan and Whaley (1990) and others. However, the intraday changes tend to be small in economic magnitude, generally considerably smaller than the 11These results are specific to our analysis of the difference between ATM and OTM options. No such effects were identified in a parallel analysis of ATM and ITM options.
difference between the implied volatility of the option’s bid and ask prices. Therefore, we are confident that our results are not unduly inf luenced by in-traday changes in expected volatility.
To test more formally the sensitivity of our measures to the choice of lag, we re-estimated the measure using a 15-minute lag and a 60-minute lag, for a subsample of IBM data for one month in the middle of our sample period (June, 1990). Using the original 30-minute lag, our estimate of option market information share for this month was 0.1984. When we increase the lag to 60 minutes, our estimate of option market price discovery changes only slightly, to 0.1965. Based on this limited sample, we conclude that calculating implied stock prices using an older implied volatility would not have a large impact on our conclusions. On the other hand, moving to a 15-minute lag increases the estimate to 0.2475.
We were concerned that our results may be affected by differential reporting lags across the two markets, or by asynchronous clocks. To test the sensitivity of our results to the accuracy of the timestamp, we estimated information shares for IBM options in June, 1990, adjusting the timestamps 5 and 30 seconds in each direction. Again, our original estimate of option information share for this stock this month was 0.1984. Adjusting the stock market clock in either direction by 5 seconds yields estimates between 0.1910 and 0.2028. Adjusting the clock by 30 seconds in either direction gives estimates between 0.1541 and 0.2610.
We also performed additional analysis on a sample of put options. Overall, we found the information shares based on put options to be roughly comparable to those based on call options. Finally, in our main analysis, we estimated the VMA model using 300 lags. We re-estimated the model using up to 600 lags, with no significant change in the results.
VII. Conclusion
We have applied Hasbrouck’s (1995) methodology to the joint time series of stock prices and option-implied stock prices, to measure the relative share of price discovery occurring in the stock and option markets.
We find evidence of significant price discovery in the options market, on the order of 10 to 20%. We find evidence that the proportion of information re-vealed first in the option market varies across stocks. Option markets tend to be more informative on average when option trading volume is high and when stock volume is low, when option effective spreads are narrow, and when stock spreads are wide. We find limited evidence that on average, price dis-covery in the option market tends to be lower when underlying volatility is higher.
We also investigate whether our estimates of price discovery in the option market differ across options of different strike prices. On average, the informa-tion share tends to be slightly higher for out-of-the-money opinforma-tions than at-the-money options, but this result varies cross-sectionally as a function of trading
volume and spreads. Our results suggest that both leverage and liquidity play an important role in promoting price discovery.
Future research in this area may help us gain a fuller understanding of the cross-sectional and time-series results presented here. Hopefully, this will en-hance our understanding of price discovery in option markets, and shed light on the question of how informed traders decide where to trade. The mere ex-istence of price discovery in the option market is not sufficient to show that informed traders trade in the options market. Conceivably, some or all the in-formation “discovered” first in the option market could be inin-formation that was revealed publicly. In order to better assess the extent of informed trading in option markets, it might be interesting to implement this technique in periods immediately prior to announcements of important corporate events.
REFERENCES
Anand, Amber, and Sugato Chakravarty, 2003, Stealth trading in the options market, Working paper, Syracuse University.
Arnold, Tom, Gayle Erwin, Lance Nail, and Ted Bos, 2000, Speculation or insider trading: Informed trading in option markets preceding tender offer announcements, Working paper, University of Alabama at Birmingham.
Back, Kerry, 1993, Asymmetric information and options, Review of Financial Studies6, 435– 472.
Baillie, Richard T., G. Geoffrey Booth, Yiuman Tse, and Tatyana Zabotina, 2002, Price discovery and common factor models,Journal of Financial Markets5, 309–322.
Bhattacharya, Mihir, 1987, Price changes of related securities: The case of call options and stocks,
Journal of Financial and Quantitative Analysis22, 1–15.
Biais, Bruno, and Pierre Hillion, 1994, Insider and liquidity trading in stock and options markets,
Review of Financial Studies74, 743–780.
Black, Fisher, 1975, Fact and fantasy in the use of options,Financial Analysts Journal31, 36– 72.
Booth, G. Geoffrey, Ji-Chai Lin, Teppo Martikainen, and Yiuman Tse, 2002, Trading and pricing in upstairs and downstairs stock markets,Review of Financial Studies15, 1111–1135. Brennan, Michael J., and H. Henry Cao, 1996, Information, trade and derivative securities,Review
of Financial Studies9, 163–208.
Cao, Charles, Zhiwu Chen, and John M. Griffin, 2000, The informational content of option volume prior to takeovers, Working paper, Pennsylvania State University.
Capelle-Blancard, Gunther, 2001, Volatility trading in option market: How does it affect where informed traders trade? Working paper, University of Paris.
Chakravarty, Sugato, and John J. McConnell, 1997, An analysis of prices, bid/ask spreads, and bid and ask depths surrounding Ivan Boesky’s illegal trading in Carnation’s stock,Financial
Management26, 18–24.
Chakravarty, Sugato, and John J. McConnell, 1999, Does insider trading really move stock prices?
Journal of Financial and Quantitative Analysis34, 191–209.
Chan, Kalok, Y. Peter Chung, and Wai-Ming Fong, 2002, The informational role of stock and option volume,Review of Financial Studies15, 1049–1075.
Chan, Kalok, Y. Peter Chung, and Herb Johnson, 1993, Why option prices lag stock prices: A trading based explanation,Journal of Finance48, 1957–1967.
Cornell, Bradford, and Erik R. Sirri, 1992, The reaction of investors and stock prices to insider trading,Journal of Finance47, 1031–1059.
de Jong, Cyriel, Kees G. Koedijk, and Charles R. Schnitzlein, 2001, Stock market quality in the presence of a traded option, Working paper, Erasmus University Rotterdam.
de Jong, Frank, 2002, Measures of contributions to price discovery: A comparison,Journal of
Fi-nancial Markets5, 323–328.
Diltz, J. David, and Suhkyong Kim, 1996, The relationship between stock and option price changes,
Financial Review31, 499–519.
Easley, David, Maureen O’Hara, and P. S. Srinivas, 1998, Option volume and stock prices: Evidence on where informed traders trade,Journal of Finance53, 431–465.
Engle, Robert F., Clive W. J. Granger, 1987, Co-integration and error correction representation, estimation, and testing,Econometrica55, 251–276.
Fama, Eugene F., and James MacBeth, 1973, Risk, return and equilibrium: Empirical tests,Journal
of Political Economy81, 607–636.
Finucane, Thomas J., 1999, A new measure of the direction and timing of information f low between markets,Journal of Financial Markets2, 135–151.
Fleming, Jeff, Barbara Ostdiek, and Robert E. Whaley, 1996, Trading costs and the relative rates of price discovery in stock, futures, and option markets,Journal of Futures Markets16, 353– 387.
Frye, Melissa B., Narayanan Jayaraman, and Sanjiv Sabherwal, 2001, Informed trading around merger announcements: An empirical test using transaction volume and open interest in op-tions market,Financial Review36, 45–75.
Grossman, Sanford J., 1988, An analysis of the implications for stock and futures: Price volatility of program trading and dynamic hedging strategies,Journal of Business61, 275–298. Harris, Frederick H. deB., Thomas H. McInish, and Robert A. Wood, 2002, Common factor
compo-nents vs. information shares: A reply,Journal of Financial Markets5, 341–348.
Hasbrouck, Joel, 1995, One security, many markets: Determining the location of price discovery,
Journal of Finance50, 1175–1199.
Hasbrouck, Joel, 2002, Stalking the efficient price in empirical microstructure specifications,
Jour-nal of Financial Markets5, 329–339.
Hasbrouck, Joel, 2003, Intraday price formation in the market for U.S. equity indexes,Journal of
Finance58, 2375–2400.
Huang, Roger D., 2002, The quality of ECN and Nasdaq market maker quotes,Journal of Finance 57, 1285–1319.
Hyland, David C., Salil K. Sarkar, and Niranjan Tripathy, 2002, Insider trading when there is an underlying option: Cross-sectional evidence, Working paper, University of Texas at Arlington. John, Kose, Apoorva Koticha, Ranga Narayanan, and Marti Subrahmanyam, 2000, Margin rules,
informed trading in derivatives and price dynamics, Working paper, New York University. Kaul, Gautman, Mahendrarajah Nimalendran, and Donghang Zhang, 2002, Informed trading and
option spreads, Working paper, University of Michigan.
Kraus, Alan, and Maxwell Smith, 1996, Heterogeneous beliefs and the effect of replicatable options on asset prices,Review of Financial Studies9, 723–756.
Krinsky, Itzhak, and Jason Lee, 1997, Quarterly earnings announcements and the lead/lag rela-tionship between the stock and option markets, Working paper, McMaster University. Kumar, Raman, Atulya Sarin, and Kuldeep Shastri, 1992, The behavior of option price around
large block transactions in the underlying security,Journal of Finance47, 879–889.
Lee, Jason, and Cheong H. Yi, 2001. Trade size and information-motivated trading in the options and stock markets,Journal of Financial and Quantitative Analysis36, 485–501.
Lehmann, Bruce N., 2002, Some desiderata for the measurement of price discovery across markets,
Journal of Financial Markets5, 259–276.
Manaster, Steven, and Richard J. Rendleman Jr., 1982, Option prices as predictors of equilibrium stock prices,Journal of Finance37, 1043–1057.
Mayhew, Stewart, Atulya Sarin, and Kuldeep Shastri, 1995, The allocation of informed trading across related markets: An analysis of the impact of changes in equity-option margin require-ments,Journal of Finance55, 1635–1654.
Newey, Whitney, and Kenneth West, 1987, A simple, positive semi-definite, heteroskedasticity and autocorrelation consistent covariance matrix,Econometrica55, 703–708.
O’Connor, Matthew L., 1999, The cross-sectional relationship between trading costs and lead/lag effects in stock & option markets,Financial Review34, 95–117.
Pan, Jun, and Alan M. Poteshman, 2003, The information in option volume for stock prices, Working paper, MIT.
Sacksteder, Elizabeth M., 1988, Securities regulation for a changing market: Option trader stand-ing under Rule 10b-5,Yale Law Journal97, 623–642.
Stephan, Jens A., and Robert E. Whaley, 1990, Intraday price change and trading volume relations in the stock and stock option markets,Journal of Finance45, 191–220.