Abstract— This study develops an inventory model for a small sized poultry farmer who produces both Broilers (Product 1) and their Branded chickens (Product 2) with different Weibull amelioration rates. Both products are produced in multiple lots. The poultry farmer’s total profit per unit of time is formulated as a function of selling prices by using a price-dependent demand function. We establish the existence of a unique optimal selling price for each product, which maximises the total profit. Numerical examples are presented to demonstrate the behaviour of the optimal solution when the ingredients in the poultry feed vary.
Index Terms— Amelioration, deterioration, small sized poultry farmers, optimal price
I. INTRODUCTION
HE commercial chickens are classified into mainly three categories in Japan [1]: (1) Wakadori (Broiler), (2) Meigaradori (Branded chicken) and (3) Jidori (Free-range
local traditional pedigree chicken). Broilers are the most popular young and fast-growing chicken, and their production period and commercial weight are about 50 days and from 2.5 kg to 3.0 kg, respectively. As for Branded chickens, there are no regulations on their breed (genotype), the method for rearing them, and the rearing environment. They are characterised by being fed with a low calorie diet, including ingredients such as herbs, tea, enzymes, and seaweeds. The low-calorie poultry diet makes their production period longer than that of broilers ([1], [2]). In contrast, the Jidori chickens have been certified governmentally in Japanese Agriculture Standards (JAS) by the Ministry of Agriculture in Japan. JAS 844 defines the meaning of Jidori, which refers to its genetic characteristics and longer breeding period as well as lower breeding density [3].
Statistics from Japanese government [4] have shown that the annual amount of production of broiler chickens in Japan has been increasing from 652,429 (thousands birds) in 2014 to 689,280 (thousands birds) in 2018. They also revealed that there has been a decrease in the number of poultry farmers with an annual production capacity less than 200,000 birds whilst the number of larger-scale poultry farmers with the capacity over 200,000 birds has gradually been increasing. Under such circumstances small and medium sized poultry
Manuscript received December 18, 2018; revised January 10, 2019. This work was supported by JSPS KAKENHI Grant Number JP18K01841.
H. Kawakatsu is with Onomichi City University, Onomichi, 722-8506 Japan (corresponding author to provide phone: 848-22-8311; fax: +81-848-22-5460; e-mail: [email protected]).
farmers would introduce alternative category of chickens to secure and increase their profit. Due to the high cost of producing Jidori chickens, it is relatively easy for the smaller sized poultry farmers who have limited breeding areas and/or limited budget to introduce their Branded chickens. Moreover, the local governments in 37 of 47 prefectures have been developing the branded chickens in their own experimental stations of livestock as part of an agricultural promotion [5]. There should be enough demand for branded chickens if they are produced in accordance with the instruction from the local governments.
In the field of inventory management, livestock such as chickens, fish, and ducklings are referred to as ameliorating items. Several models have been studied for items with the Weibull amelioration rate, since Hwang ([6], [7]) first developed EOQ models for ameliorating items. Mondal et al. [8] conducted an inventory model for ameliorating items with price dependent demand rate for a prescribed time period. Hwang [9] dealt with a stochastic set-covering location problem for both ameliorating and deteriorating items. Law et al. [10] developed an integrated, production-inventory model for ameliorating and deteriorating, taking into account the time discount. Wee et al. [11] developed an inventory model with consideration of the time value of money in the case where both amelioration and deterioration rates were assumed to follow a Weibull distribution. Vandana and Srivastava [12] proposed an inventory model for ameliorating/deteriorating items with trapezoidal-type demand rate under the condition of inflation and time discounting rate. Chou et al. [13] and Tuan et al. [14] established analytical frameworks to obtain an optimal solution for the EOQ model proposed by Hwang [6]. Our previous study [15] has developed an inventory model for a small sized poultry farmer who produces both Broilers (Product 1) and Branded chickens (Product 2) with different amelioration rates under the assumption that each product is only produced in a single lot.
This study formulates the total profit by relaxing the assumption of a single lot for each product under the following situations. The breeding area is limited and divided into two regions; one for Product 1 and the other for Product 2. Each product has a different breeding period due to the different Weibull amelioration rates. The product with longer breeding period has higher selling prices. We examine the existence of the optimal selling price for each product to maximise the total profit per unit of time.
D. Li is with Loughborough University, Loughborough, Leicestershire, LE11 3TU UK (e-mail: [email protected]).
K. Kato is with Hiroshima Institute of Technology, Hiroshima, 731-5193 Japan (e-mail: [email protected]).
Pricing Strategy for Small Sized Poultry
Farmers with Two Different Products
Hidefumi Kawakatsu, Dong Li, and Kosuke Kato
The amelioration and the feed conversion rates are considered to vary depending upon the ingredients in feed. Numerical examples are presented to demonstrate the behaviour of the optimal solution when the ingredients in poultry feed are changed.
II. NOTATION AND ASSUMPTIONS The main notation used in this paper listed below:
index of Product ( 1, 2)
selling price of Product (decision variable) order quantity per cycle of Product
, a function of
daily demand quantity of Product , a function of
production period for Product number of lots for Product
maximum capacity of each lot for Product maximum capacity of breeding area, which is given by ∑
deterioration rate for Product
disposal cost of deteriorated birds for Product feed conversion rate (FCR) for Product unit cost of ameliorating (diet) for Product unit inventory carrying cost per unit of time for Product
unit purchasing price of newly-hatched chick of Product
unit ordering cost initial body weight final body weight
The assumptions in this study are as follows:
i) The quantity of a product is expressed as its weight and treated as continuous for simplicity.
ii) No shortages are allowed.
iii) The breeding area is divided into two areas; one for Product 1 (Broiler chicken) and the other for Product 2 (Branded chicken).
iv) The poultry farmer has a maximum capacity, denoted by , of the breeding area.
v) The inventory level (e.g., total body weight) of Product continuously increases due to growth during 0, , but at the same time, the inventory level is depleted due to deterioration.
vi) The amelioration rate of Product at time , denoted by , is expressed as the following equation ([6]-[14]):
0, 0 , (1) where and represent the probability density function and the distribution function of Weibull distribution, respectively, i.e.,
, (2)
1 . (3)
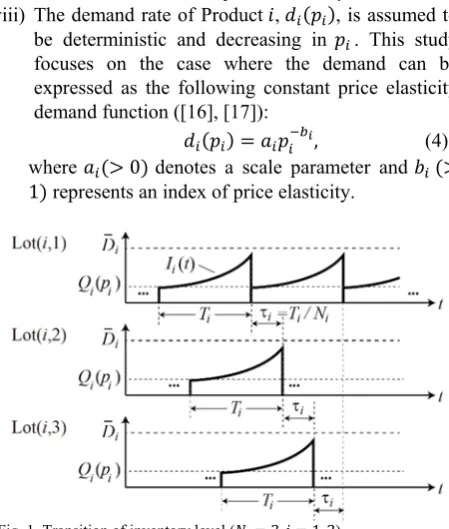
vii) The products in each lot are shipped in one batch to the buyer in ( 1, 2) units of time after the start
of the production of each lot. Figure 1 illustrates an example of the transition of the inventory level in the case of 3 , where Lot , expresses the th lot for Product 1, 2, 1, 2, ⋯ , .
viii) The demand rate of Product , , is assumed to be deterministic and decreasing in . This study focuses on the case where the demand can be expressed as the following constant price elasticity demand function ([16], [17]):
, (4) where 0 denotes a scale parameter and 1 represents an index of price elasticity.
III. TOTAL PROFIT
By assumptions v) and vi), the inventory level of Product 1, 2 at time can be expressed by
/ 0 . (5)
Solving the differential equation in (5) with a boundary
condition / yields
. (6) Equation (6) implies that the order quantity per lot is given by
0 . (7)
The total amount of ameliorating during 0, in each lot is given by
1 . (8)
Furthermore, the total amount of inventory level and deteriorated units over cycle in each lot are respectively expressed by
[image:2.595.319.544.98.363.2]. (10) Therefore, the total profit of Product can be represented by
/ /
1
/ . (11) Let be the positive multiplies, independent of , in (11), i.e.,
1
, (12) then equation (11) can be rewritten as
/ . (13)
Hence, the poultry farmer’s total profit per unit of time,
denoted by , , is given by
, ∑ / . (14)
It is straightforward to see that , in (14) is increasing in and decreasing in , , , and 1, 2 .
IV. FEASIBLE REGION
By assumption iv), a lower bound of selling price is given by
/ / 1, 2 . (15)
Solving ∑ for , we have
/ / . (16)
Let be the right-hand side of (16), i.e.,
/ / . (17)
The following property can be shown by the simple differential operation.
Property 1.
(a)
→ ∞ and → ∞ .
(b) is decreasing in and /
0.
From Property 1, the behaviour of can be characterized as shown in Fig. 2 in our previous study [15]. The feasible region, denoted by , is expressed as
, | . (18)
It can be confirmed that 1, 2 holds for
, ∈ .
V. OPTIMAL SELLING PRICES
Under the constraint of , ∈ , the problem is formulated as follows:
maximise ,
subject to (19)
As mentioned in Section IV, 1, 2 holds if in (19) is satisfied.
By introducing a Lagrange multiplier, denoted by , the problem (19) can be expressed as
, , , , 0,
, 0, 0, ⋅ , 0. (20)
where
, , , ⋅ , . (21)
, . (22)
The conditions in (20) are referred to as the Karush-Kuhn-Tucker (KKT) conditions ([18]).
In the case of ⇔ , 0 , the KKT
conditions in (20) indicates that a critical point of , in (14) becomes a solution to the problem (19). In this case, a unique global solution, denoted by , ,
, to the problem (19) is given by the following Lemma 1. Lemma 1.
(a) A unique finite positive solution for each product, which maximises , is given by
/ 1 1, 2 . (23)
(b) A unique pair of , , attains
the maximum value of , in (14), which is a unique finite solution to the problem (19) for
.
In the case of ⇔ , 0 , although it
cannot be shown that , is concave for
1, 2 . Therefore a maximum value of , is
obtained on for . We can also prove
that there exists a unique finite solution ̂ that attains the maximum value of , . This signifies that the solution to (20) becomes a global solution to (19).
A unique finite solution , ̂ , ̂ to (19) for can be summarised in the following Lemma 2. Lemma 2. In the case of , ̂ is given as a unique solution to
0, (24)
and ̂ is expressed as
̂ ̂ . (25)
The Theorem 1 below follows immediately Lemma 1(b) and Lemma 2.
Theorem 1. A unique positive finite solution to (19), denoted by , ∗, ∗ , is given by
∗, ∗ , , ,
̂ , ̂ ̂ , . (26)
VI. NUMERICAL EXAMPLES
This section considers a case where the poultry diet for branded chickens consists of the ordinary diet (the same as for broiler chickens) and Plantago lanceolata (a species of herb that grows in temperate areas and can be used as livestock feed). We assume that the cost of collecting the wild herb can be ignored. The unit cost of amelioration (diet) for Product 2, denoted by , is expressed as
1 Blending ratio of herb , (27) where is the unit cost of amelioration for Product 1.
Nishiwaki et al. [2] have observed the change of body weight of broiler chickens when the ratio of herb (Plantago lanceolata) contained in the ordinary diet is 0%, 10%, and 20%. We estimate the parameters of the amelioration rate ( and in (1)) and the length of the production cycle of Branded chicken by using their data when the initial and final body weight of the birds are 0.04 (kg) and 2.7(kg), respectively. For 4% of the mortality rate, we estimate the values of since the mortality rate of the broilers is controlled to be less than 4% in Japan.
The estimated values are shown in Table I. The parameters of broiler chickens are set as , , , and in the case where the blending ratio of herb is 0%. Regarding to the demand rate, we consider a scenario as follows: (a) the buyer will purchase 1,500kg (1,800kg) of Product 1 if its unit selling price is 300 (270). (b) the buyer will buy 400kg (500kg) of Product 2 if its unit selling price is 500 (400).
In this case, the parameters of the demand rate for each product can be estimated as , 567824.727, 1.73 and , 453699035.445, 3.106 .
For 0.04 and 2.7, the feed conversion ratio (FCR) of broiler chickens can be estimated as approximately 1.7 using the data in [19]. The value of FCR is considered to increase with the blending rate of herb due to the decrease in the fat content ratio in the feed. This section estimates the FCR corresponding to each blending rate of herb by assuming that the amount of feed intake for 50 days is the same regardless of the blending ratio of herb. The other parameters are set as
, , , , , , , , ,
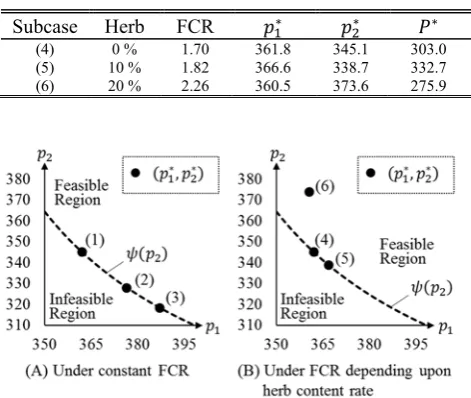
120, 1500, 3, 3, 1.1, 1.2, 2, 2, 100, 100 . Table II(A) shows the numerical examples in reference to ∗, ∗, and ∗ ∗, ∗ for the constant FCR=1.7. Table II(B) summarises the results when FCR increases with the blending ratio of herb. Figure 2(A) and (B) correspond to Table II(A) and (B), respectively.
Table II(A) and Fig. 2(A) show that ∗ and ∗ increase and ∗ decreases as the herb content rate increases under a constant FCR. This is mainly because the total cost of the diet significantly decreases as the herb content ratio increases under a constant FCR, whereas the low-calorie diet containing herb increases the production period of the chickens as shown in Table I.
In contrast, Table II(B) demonstrates that the total profit TABLEI
ESTIMATED VALUES OF , , , AND
Content ratio of herb
0 % 0.909 0.390 51.100 0.000799 10 % 0.759 0.432 52.940 0.000771 20 % 0.685 0.445 59.529 0.000686
TABLEII
(A)NUMERICAL EXAMPLE UNDER CONSTANT FCR=1.7
Subcase Herb FCR ∗ ∗ ∗
(1) 0 % 1.70 361.8 345.1 303.0 (2) 10 % 1.70 376.2 328.0 367.7 (3) 20 % 1.70 387.0 318.2 454.6
(B)NUMERICAL EXAMPLE UNDER FCR DEPENDING UPON
HERB CONTENT RATE
Subcase Herb FCR ∗ ∗ ∗
[image:4.595.309.545.261.460.2](4) 0 % 1.70 361.8 345.1 303.0 (5) 10 % 1.82 366.6 338.7 332.7 (6) 20 % 2.26 360.5 373.6 275.9
per unit of time increases when the herb content rate increases from 0% to 10%, but decreases when it increases from 10% to 20%. In this case, the total cost of amelioration increases with FCR, though the unit cost of the diet becomes small as the mixed ratio of the herb increases. This result implies that there may be cases that there exists an optimal herb content rate, which maximises the total profit, if the cost of diet for branded chickens can be reduced by adding herbs into the ordinary feed for broiler chickens.
VII. CONCLUSION
This study has proposed an inventory model for two products with different Weibull amelioration rates under the following circumstances. The small sized poultry farmer not only produces Broilers (Product 1) to meet the demand of the dominant buyer, but also introduces their own branded chickens (Product 2) for other customers. The breeding area is limited and divided into two regions; one for Product 1 and the other for Product 2. Each product is produced in more than one lots and has a different breeding period. The product with longer breeding period has higher selling prices.
We formulated the farmer’s total profit per unit of time as a function of selling prices and proved that there exists a unique positive finite optimal selling price for each product, which maximises the total profit.
The numerical examples illustrate the behaviour of the optimal solution and the total profit when the content rate of the herb (Plantago lanceolata) varies. We have assumed that the cost of collecting the Plantago lanceolata can be ignored. Since it is widely accepted that the amelioration rate decreases and the feed conversion rate (FCR) increases with the content ratio of herb, we estimated the parameters of the amelioration rate and the FCRs using the actual data for three different content ratios of herb (0%, 10%, and 20%). The results indicate that there may exist an optimal content ratio of herb if the cost of feed can be reduced by adding herbs into the poultry diet.
In order to show the existence of the optimal content ratio of herb, however, we need to clarify the relationship between the content ratio, the amelioration, and the feed conversion rates more precisely. Furthermore, the feed conversion rate is not constant over the production period but varies with the age of products. These factors will be considered in an extended paper in the future.
ACKNOWLEDGMENT
This work was supported by JSPS KAKENHI Grant Number JP18K01841.
REFERENCES
[1] R. Komai, “Branded chicken and Free-range local traditional pedigree chicken (Meigaradori to Jidori) (in Japanese),” Animal-husbandry, vol.
62, no. 6, pp. 657–664, Jun. 2008.
[2] M. Nishiwaki et al., The effect of feeding herb on growth and meat quality of broiler chickens (Shiryouyou herb ga broiler no seichou oyobi nikushitsu ni ataeru eikyou) (in Japanese), Japanese Journal of Grassland Science, vol. 47, no. Separate, pp. 232–233, Mar. 2001.
[3] K. Sasaki et al., “Qualitative and quantitative comparisons of texture characteristics between broiler and Jidori-niku, Japanese indigenous chicken meat, assessed by a trained panel,” The Journal of Poultry Science, vol. 54, no. 1, pp. 87–96, Aug. 2017.
[4] Statistic Bureau, Ministry of internal affairs and communications, “Livestock statistics” (2018, February 1) [Online]. Available: https://www.e-stat.go.jp/en.
[5] Y. Horiuchi, “Business strategy for poultry farm management utilising regional characteristics (Chiikitokusei wo ikashita nikuyoukei no jigyo senryaku) (in Japanese),” The norin kinyu, vol. 71, no. 7, pp. 2-14, Jul. 2018.
[6] H. S. Hwang, “A study on an inventory model for items with Weibull ameliorating,” Computers & Industrial Engineering, vol. 33, pp. 701–
704, Dec.1997.
[7] H. S. Hwang, “Inventory models for both deteriorating and ameliorating items,” Computers and Industrial Engineering, vol. 37, pp. 257–260, Oct. 1999.
[8] B. Mondal, A. K. Bhunia and M. Maiti, “An inventory system of ameliorating items for price dependent demand rate,” Computers & industrial engineering, vol. 45, pp. 443–456, Oct. 2003.
[9] H. S. Hwang, “A stochastic set-covering location model for both ameliorating and deteriorating items,” Computers & Industrial Engineering, vol. 46, no. 2, pp. 313–319, Apr. 2004.
[10] S. T. Law and H. M. Wee, “An integrated production-inventory model for ameliorating and deteriorating items taking account of time discounting,” Mathematical and Computer Modelling, vol. 43, pp. 673–685, Mar. 2006.
[11] H. M. Wee, S.-T. Lo, J. Yu, and H. C. Chen, “An inventory model for ameliorating and deteriorating items taking account of time value of money and finite planning horizon,” International Journal of Systems Science, vol. 39, no. 8, pp. 801–807, Aug. 2008.
[12] Vandana and H. M. Srivastava, “An inventory model for ameliorating/deteriorating items with trapezoidal demand and complete backlogging under inflation and time discounting,”
Mathematical Methods in the Applied Sciences, vol. 40, no. 8, pp. 2980–2993, May. 2017.
[13] S. Y. Chou, W. T. Chouhuang, J. S-J. Lin, and P. Chu, “An analytic solution approach for the economic order quantity model with Weibull ameliorating items,” Mathematical and computer modeling, vol. 48, pp. 1868–1874, Dec. 2008.
[14] H. Tuan, S. Lin, and P. Julian, “Improvement for amelioration inventory model with Weibull distribution,” Mathematical Problems in Engineering, pp. 1–8, Jun. 2017.
[15] H. Kawakatsu, D. Li and K. Kato, “Optimal selling prices for small sized poultry farmers,” International Journal of Economics and Management Engineering, Vol. 12, No. 3, pp. 318-322, Mar, 2018. [16] K. Hahn, H. Hwang, and S. Shinn, "A returns policy for distribution
channel coordination of perishable items,'' European Journal of Operational Research, vol. 152, no.3, pp. 770–780, Feb. 2004. [17] D. Seifert, R. W. Seifert and O. H. D. Isaksson, “A test of inventory
models with permissible delay in payment,'' International Journal of Production Research, vol. 55, no. 4, pp. 1117–1128, Aug. 2017.
[18] R. K. Sundaram, A First Course in Optimization Theory. Cambridge
University Press, Cambridge, 1996.