Extractive Distillation
F.-M. Lee, GTC Technology Corporation, Houston, TX, USA
Copyright^ 2000 Academic Press
Introduction
In the Rrst half of the twentieth century, extractive distillation (ED) became an important industrial process when World War II demanded high purity toluene for explosive production and butadiene for synthetic rubber production. Over the years, substan-tial developments in ED have been carried out in terms of novel solvent discovery for a particular sep-aration, as well as the development of more sophisti-cated ED tower internal designs. In the petroleum and petrochemical industries, ED has been found effective in separating mixtures of aromatics/nonaromatics, dioleRns/oleRns, oleRns/parafRns and naphthenes/ parafRns.
This article will brieSy review the basic concept of ED, and summarize the development of ED technolo-gies for the applications in the following areas:
1. Aromatic puriRcation from reRning and petro-chemical streams.
2. CycloparafRn (cyclohexane or cyclopentane) re-covery from naphtha or natural gas liquid. 3. Light oleRns from light hydrocarbon mixtures.
The basis of ED is the increase of relative volatility between the close-boiling components caused by in-troducing a selective solvent, which has stronger
af-Rnity with one type of the components in the mixture. If there is a single liquid phase (no phase separation), the solvent selectivity can be measured from the ex-perimentally observed relative volatility () between the key components in the presence of solvent as:
"(Y1/X1)/(Y2/X2)
where X1 and X2 are the mole fractions of compo-nents 1 and 2, respectively, in the liquid phase, and
Y1andY2 are those in the vapour. All compositions are measured on a solvent-free basis.
In some cases, liquid-phase separation may occur in the ED tower, especially in the upper portion of the tower where less polar components are concentrated. Under this condition, the solvent phase can reject a second liquid phase, which can be deRned as the rafRnate liquid phase. The liquid in the solvent-rich phase is deRned as the extract liquid phase. The solvent selectivity is determined by the relative
vola-tilities of the key components in the two interrelated liquid phases and the common vapour phase, accord-ing to the followaccord-ing formulae:
r"(1rp1r)/(2rp2r)
e"(1ep1e)/(2ep2e)
whererandeare the relative volatilities of compo-nents 1 and 2, respectively, in the rafRnate phase and extract phase;1rand2rare the activity coefRcients in the rafRnate phase, and 1e and 2e are the activity coefRcients in the extract phase; andp1r,p2r,p1e, and p2eare the vapour pressures of the pure components
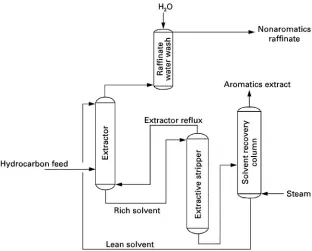
(which can be estimated from an Antoine equation). A schematic diagram of a typical ED process is presented inFigure 1. During a normal run, a polar, high-boiling (low volatility) solvent is introduced to near the top of the ED tower. As the nonvolatile solventSows down the column, it preferentially asso-ciates the more polar components in the ascending vapour mixture, thus increasing the relative volatility between the polar and less polar components. The process feed stream is introduced to the middle por-tion of the ED tower. The more polar components are concentrated in the rich solvent, exiting the bottom of the ED tower, while the less polar components are concentrated in the overhead rafRnate stream. The tower reSux stream is provided to knock down the entrained solvent from the overhead rafRnate stream. The solution, rich in polar compounds from the bottom of the ED tower, is fed to the solvent stripper, where the polar components are stripped from the solvent by heat alone or by heat and a stripping gas, such as steam. The lean solvent is then recycled to the ED tower from the bottom of the stripper.
Aromatic Puri
\
cation from Re
\
ning
and Petrochemical Streams
Advantages and Principle of ED Technology
Although liquid}liquid extraction (LLE) technologies
have dominated the industrial processes for purifying benzene, toluene, xylene (BTX) aromatics from reR n-ing and petrochemical streams, ED technologies have gained ground quickly since the 1980s for more re-cent grassroots plant installations. In comparison to LLE, ED has the following advantages:
1. Lower capital costs. ED requires two major pro-cess units (ED tower and solvent stripper), while
Figure 1 Configuration of an ED process.
Figure 2 Configuration of liquid}liquid extraction using sulfolane for aromatic recovery.
the popular LLE, using sulfolane as the solvent, requires four major process units, including LLE tower, extractive stripper, solvent recovery column, and rafRnate wash tower (see
Figure 2).
2. Higher operationalUexibility. LLE uses only sol-vent selectivity (polarity) for separation, while ED uses both solvent selectivity and boiling point for separation, so it has one extra dimension for op-erationalSexibility.
3. Less physical property restrictions. Interfacial ten-sion and density difference between the liquid phases are important concerns for LLE, but not for ED.
The principle of ED for aromatic puriRcation was studied as early as 1944. One example was the recov-ery of toluene from parafRns using phenol as the selective solvent. The effect of phenol on a
[image:2.568.129.441.444.695.2]Figure 3 Effect of phenol on the vapour}liquid equilibrium of
[image:3.568.296.511.405.671.2]paraffin and toulene. Numbers on curves refer to mol%solvent in liquid.
Figure 4 Effect of phenol on the activity coefficient of paraffin and toluene.
Figure 5 McCabe}Thiele diagram for paraffin and toulene
sep-aration in the presence of phenol. Part (B) is an enlargement of part of the diagram in (A).
diagrams as shown inFigure 3, in which the parafRn is considered as a hypothetical octane having the same boiling point as toluene. In the absence of phe-nol, there exists an azeotrope of parafRn and toluene. However, at 50 mol% phenol, the azeotrope is de-stroyed and the mixture is easily separated; at 100 mol% phenol, the separation between parafRn and toluene becomes very easy. Figure 4 illustrates the effect of phenol on the change in relative volatility between parafRn and toluene. Phenol causes an in-crease of activity coefRcient for both parafRn and toluene, but the activity coefRcient of the parafRn increases to a greater extent than that of toluene. Therefore, the relative volatility of parafRn over tol-uene can be increased from 1.0 (no separation) to 3.7 (easy separation) at near zero hydrocarbon concen-tration in phenol (inRnite dilution).
The vapour}liquid equilibria of the
para-fRn}toluene}phenol system were applied to test
a commercial ED tower for toluene puriRcation. As shown in Figure 5, the McCabe}Thiele diagram,
drawn on a phenol-free basis, was used to carry out the theoretical calculations from tray to tray in the ED tower.
The calculated results were then compared with the actual results generated from a commercial ED tower with 2.1 m diameter and 65 trays. The hydrocarbon feed tray and the solvent feed tray are located at trays 19 and 39 (counted from the bottom of the tower), respectively. The tower was operated at a solvent-to-feed ratio (S/F) of 2.5, a reSux-to-overhead ratio (R/D) of 2.75, and reboiler temperature at 1703C
under 1.3 atm bottom pressure. On the basis of the charge, overhead and bottoms analyses, tray-to-tray calculations were made.
Figure 6 shows the calculated concentration
pro-Rles for each component plotted against theoretical tray number. It also shows the plot of the tray ana-lyses against actual tray number. The overall efR cien-cies calculated over small sections of the tower are given in Table 1. The average of the overall tray efRciencies throughout the tower is about 50%.
Based on the above principle, much more rigorous algorithms for tray-to-tray calculation of ED towers for multicomponent systems have been developed in
[image:3.568.66.265.509.682.2]Figure 6 Calculated versus actual concentration profile of the componenets in an ED tower. Key: 䊏, methylcyclohexane;
[image:4.568.51.277.488.697.2]䉱, toluene;;phenol;***, calculated values.
Table 1 Tray efficiency of ED tower for toulene purification
Section of tower trays
Theoretical trays
Actual trays
Overall efficiency (%)
Below phenol feed tray
1}3 1.8 3 60.0
4}7 2.7 4 67.5
8}11 2.1 4 52.5
12}15 1.5 4 37.5
15}18 1.8 3 60.0
23}27 2.1 4 52.5
27}30 2.5 4 62.5
31}34 2.65 4 66.0
35}39 2.35 5 47.0
Above phenol feed tray
43}65 10.8 23 47.0
49}65 8.6 17 50.7
57}65 4.5 9 50.0
61}65 2.8 5 56.0
All trays numbered from bottom of tower.
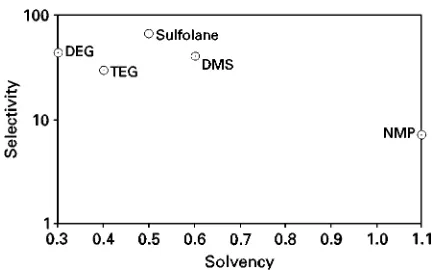
Figure 7 Selectivity versus solvency (solubility) of the common commercial solvents. DEG, diethylene glycol; TEG, triethylene glycol; DMS, dimethyl sulfoxide; NMP,N-methyl pyrrolidone.
recent years, with the help of advanced vapour}liquid
equilibrium theories and high-speed computers.
Handling Two Liquid Phases in ED Towers
One of the challenges of ED technology for aromatics puriRcation is the handling of the possible formation of two liquid phases in the upper portion of the ED tower where nonaromatics are concentrated. The oc-currence of a second liquid phase is due to the fact that the nonaromatics, such as parafRns, naphthenes and oleRns, have signiRcantly lower solubility in the polar solvent than aromatics.
One way to solve the problem of two liquid phases in the ED tower is to select a polar solvent that has
enough solvency to dissolve both aromatics and nonaromatics in the mixture under process condition. In general, however, solvents with a high selectivity for compounds to be separated will have a reduced solvency (capacity), and vice versa. The selectivity versus solvency of the common commercial solvents for aromatic extraction is shown inFigure 7. There-fore, in order to eliminate two liquid phases, one may have to compromise the solvent selectivity, some-times to a great extent.
A better way is to cope with two liquid phases in the ED tower, without sacriRcing the solvent selectiv-ity, for the following reasons:
1. Two liquid phases normally reduce the solvent selectivity in the three-phase equilibrium (va-pour}liquid}liquid) condition in the ED tower.
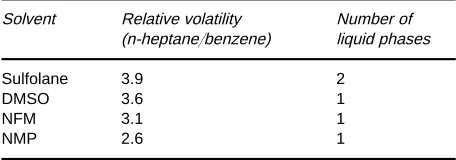
[image:4.568.294.512.544.679.2]Table 2 ED solvent screening for aromatics recovery
Solvent Relative volatility (n-heptane/benzene)
Number of liquid phases
Sulfolane 3.9 2
DMSO 3.6 1
NFM 3.1 1
NMP 2.6 1
Feed: 20% n-heptane and 80% benzene; pressure 1 atm; DMSO, dimethyl sulfoxide; NFM, N-formyl morpholine; NMP, N-methyl pyrrolidone.
compared with those of N-formyl morpholine (NFM) and N-methyl pyrrolidone (NMP). The ability of these solvents to enhance the relative volatility ofn-heptane over benzene (an aromatic and nonaromatic separation) in a one-stage equi-librium cell was determined.Table 2shows that, although two liquid phases were observed using sulfolane as the solvent, sulfolane still gave a bet-ter performance than the other solvents where a single liquid phase existed in the mixture. 2. Two liquid phases have no ill effects on the efR
-ciency of small tray or packed towers with dia-meter from 0.08 m to 0.46 m. However, in larger towers, the heavy liquid phase tends to accumulate on the tray if the liquid phases are not well mixed. This problem can be eliminated by tray designs promoting gas agitation, forcing the two liquid phases to behave as a homogeneous liquid. For larger packed columns, liquid}liquid
redis-tributors are specially designed to allow separate distribution of the two liquid phases.
Computer simulations have been developed which are capable of accurately predicting the development of two liquid phases in the ED tower. In one approach, the simulation algorithm starts from linearized pressure, temperature and concentration proRles and feed conditions given by the program operator. New estimates of composition are solved, using the material balance and equilibrium relation-ship for each tray. Then the equilibrium constants are re-estimated and a new temperature gradient is estab-lished to calculate a tray-by-tray energy balance. Ac-cumulated errors are calculated for the energy, mater-ial and equilibrium balances. Appropriate column operation restraints are factored in at this point. A correction factor is found for the temperature, rate proRles, and liquid composition proRle by inverting the accumulated error matrix. These correction fac-tors are used to form new iterative estimates of com-position to start the process again until the correction factors are small enough to call the components converged.
Multicomponent vapour}liquid and liquid}liquid
equilibria solutions are required for the algorithm. Two activity coefRcient models, NRTL (nonrandom two liquids) and UNIQUAC (universal quasichemi-cal), are readily extendable to multicomponent sys-tems and capable of such solutions. Experimental activity coefRcients,, at inRnite dilution are used for calculating binary parameters for the NRTL equa-tion. These parameters are then tested using experi-mental liquid}liquid ternary data, experimental va-pour}liquid equilibrium data, and data from pilot plant or commercial plant. The NRTL equation is used in the algorithm to calculate activity coefRcients and is given in the following equations:
ln1"x2
2[21(G21/(x1#x2G21))2
#12(G12/(x2#x1G12)2]
ln2"x2
1[12G12/(x2#x1G12))2
#21G21/(x1#x2G21)2]
where
lnG12"!1212
lnG21"!2121
12"(12#S12T)/RT
21"(21#S21T)/RT
and whereGij,ij,Sijandijare empirical constants, i is activity coefRcient, R is the gas universal con-stant,Tis absolute temperature, andxiis liquid phase
mole fraction of component i.
The simulation uses a Newton}Raphson-based Sash algorithm that checks for two liquid phases by checking Gibbs free energies for components the pro-gram operator lists as possible second liquid phase formers. If two liquid phases are indeed present, regu-lar solution theory provides a method of combining the liquid-phase activity coefRcients.
State-of-the-art ED Technologies
The modern state-of-the-art ED technologies for BTX aromatic puriRcation are based on several solvent systems: sulfolane, NFM and NMP. Proprietary cosolvents may be blended into the base solvent to enhance the performance in speciRc applications.
Table 3 summarizes the key performance para-meters of LLE and ED for aromatics recovery. ED process can provide up to 25% savings in capital investment as compared with the commercially avail-able LLE processes. This saving is attributavail-able to the
Table 3 Comparison of aromatic recovery technologies
System UDEXTM ArosolvanTM SulfolaneTM Morphylane威 GT-AromexTM
Solvent Tetra-EG NMP Sulfolane N-formyl morpholine Proprietary ISBL capital cost (million US$) 9.5 11.0 10.7 11.0 8.1
Utilities
Power (kWh per t of feed) * 6.6 2.4 4.6 4.8
Steam (kcal per kg of feed) 211 225 177 250 194
Cooling H2O (gal per lb of feed) 19 * * 16 21
Aromatics recovery
Benzene 99.9% 99.9% 99.9% 99.9% 95.0%
Toluene 99.5% 99.5% 99.0% 99.5% 99.5%
Xylene 95% 95% 95% 97% 100%
Solvent-to-feed ratio (v/v) 4 : 1 0.4 : 1 2 : 1 3 : 1 3 : 1
Data are for 1994 construction, extraction section only; all processes are pro rata for 1600 metric tons day\1reformate feed; sources
include SRI International, Handbook of Solvent Extraction, Petroleum Refining Technologies&Economics, and licensor literature.
Figure 8 Schematic diagram of the Morphylane威process for aromatic purification.
smaller number of operating units, as mentioned above. The ED process recovers more xylenes but less benzene than LLE processes.
The Morphylane威process offered by Krupp Kop-pers uses NFM as the selective solvent. A schematic diagram of the Morphylane威process is given in Fig-ure 8. The diagram is very similar to the general ED process scheme as shown in Figure 1, except the nonaromatic vapour exiting the top of the ED tower contains a small amount of NFM solvent (0.9 wt%), which must be recovered. Two methods are used for this solvent recovery, both of which require addi-tional equipment and expense: (1) a separate solvent recovery column; and (2) additional trays or packings
Rtted to the top of the ED tower (above the solvent tray), using nonaromatics as the reSux toSush NFM back into the ED tower. To use the second method,
the feedstocks to the ED tower must contain only very small amounts of critical components, such as methylcyclohexane and dimethylcyclopentane in py-rolysis gasoline feedstock, or C7oleRns in reformate
feedstock.
The Morphylane威process is available in commer-cial applications for recovering high purity benzene from C6fraction, or pure benzene and toluene from
the C6}C7fraction of reformate or pyrolysis gasoline.
For example, the process has been commercially tes-ted with a feedstock from a mixture of C6reformate
fraction and a C6fraction of a pyrolysis gasoline. The
[image:6.568.128.441.517.696.2]Table 4 ED performance for benzene recovery from the C6
fraction
Parameter Units Value
Throughput t h\1 23.0
(approx. 116%) Benzene production t h\1 12.89
Benzene purity wt% 99.98 Benzene yield wt% 98.11 Solvent consumption g t\1aromatics 6.0
Solvent in benzene product
ppm Not ascertainable
Steam consumption (16;105Pa)
kg t\1feed 564
(including benzene column)
Energy consumption for extractive distillation only 16;105Pa steam
kg t\1feed
Gcal t\1feed
349 0.161
Figure 9 Hybrid scheme for aromatic recovery process expansion.
boiling aromatics, such as mixed xylenes or C#9 and
higher aromatics, probably because of the relatively low boiling point of NFM.
The GT-BTXSM process offered by GTC
Techno-logy Corporation is available for recovering not only benzene and benzene/toluene, but also a full range of aromatics (benzene, toluene and xylenes) with high purity and recovery. The process uses a proprietary sulfolane-based solvent blend. Due to the high boiling point of the solvent, the process is very effective in recovering higher boiling aromatics, such as xylenes
and C#9 and higher aromatics. Unlike the
Mor-phylane威process, the overhead nonaromatics stream from the ED tower in the GT-BTXSMprocess contains
essentially no solvent, and does not require a separate solvent recovery tower.
A hybrid concept of the GT-BTXSMprocess can be
used to increase substantially the capacity of the liquid}liquid extraction unit and improve the quality
of the benzene product, through retroRtting of the existing unit. The retroRtting can be carried out using this hybrid concept without requiring extensive
modi-Rcations, investment or lengthly shutdown time.
Figure 9shows a new process using a hybrid of the sulfolane liquid}liquid extraction process with the
GT-BTXSM process that bypasses part of the feed
around the original extraction section. In the hybrid scheme, the ED tower is better suited to purifying the benzene-rich feed than the liquid}liquid extraction
unit, and it is not subject to the maximum aromatics limit in the hydrocarbon charge. The ED tower nonaromatic stream (rich in cyclohexane) may be recycled to the reformer unit for producing more benzene, while the rafRnate stream from the liquid}liquid extractor (rich in parafRns) could be routed to gasoline blending or used as a feedstock for naphtha cracking to produce ethylene and pyrolysis gasoline. The major changes are modiRcations of the solvent system to be compatible with both extraction operations and to make the appropriate tie-ins to the ED tower.
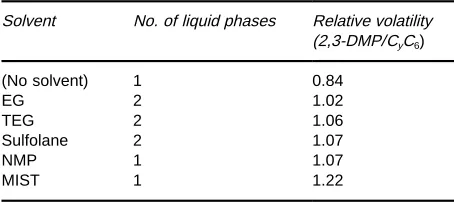
[image:7.568.129.440.438.694.2]Table 5 Equilibrium cell study forCyC6and 2,3-DMP separation
Solvent No. of liquid phases Relative volatility (2,3-DMP/CyC6)
(No solvent) 1 0.84
EG 2 1.02
TEG 2 1.06
Sulfolane 2 1.07
NMP 1 1.07
MIST 1 1.22
Table 6 Computer simulation for solvent comparison
Solvent 2,4-DMP recovery (%)
CyC6purity
(wt%)
Separation factora
MIST 85.5 97.5 586
TEG 53.7 92.4 115
Sulfolane 51.7 92.1 106
NMP 45.9 91.2 84
EGb 0.0 85.0 0
aSeparation factor
"mole fraction 2,4-DMP raffinate/mole fractionCyC6raffinate
mole fraction 2,4-DMP extract/mole fractionCyC6extract
.
bSimulation failed to converge.
Premises: 99%CyC6recovery, overhead product allowed to vary;
S/F weight ratio"16; 25 equilibrium stages (solvent fed on stage 24, hydrocarbon fed on stage 12); reflux fixed at 0.48 (hydrocar-bon feed).
Cyclohexane Recovery from Naphtha
or Natural Gas Liquid
In recent years, ED technology has also been applied to the separation of parafRns and cyclopara-fRns, a much more difRcult separation than aromatics and nonaromatics. One of the major developments was cyclohexane recovery from naphtha or natural gas liquid (NGL) streams. Cyclohexane, an important raw material for the nylon industry, exists naturally in naphtha and NGL streams. However, recovery of high purity cyclohexane from naphtha or NGL through conventional distillation is virtually imposs-ible, owing to the close-boiling C7 isomers
in the streams. Since the polarity difference between cyclohexane and C7 isomers is substantially smaller
than that for aromatic and nonaromatic compounds, no extractive solvent has been found that can effect the separation. However, through the use of a cosol-vent (to enhance the solvency of the mixed solcosol-vent), an ED process has been commercialized to recover high purity cyclohexane directly from an NGL frac-tion containing 85%cyclohexane.
Many solvent blends show synergistic improve-ment over what would be expected by pure compon-ent mixing. To test the concept, experimcompon-ents were conducted in a one-stage vapour}liquid equilibrium
(VLE) cell to compare the selectivity ofRve solvents. To a hydrocarbon mixture of 85 wt% cyclohexane (CyC6) and 15 wt%2,3 dimethylpentane (2,3-DMP),
a selective solvent or a mixed solvent was added, at a solvent-to-feed ratio (S/F) of 7.0. The relative vola-tility of 2,3-DMP over CyC6 was measured in the
equilibrium cell with various solvents.Table 5 pres-ents a comparison of relative volatilities obtained for
Rve solvents tested, including a proprietary mixed solvent (MIST) from Phillips Petroleum Company. MIST solvent, discovered by investigating the combi-nations of many other solvents, has a signiRcantly higher relative volatility than the other single solvents.
Computer simulations were carried out to conRrm the results on solvent screening from the one-stage
VLE cell for the mixed and single solvents shown in Table 5. These simulations were based on experi-mental physical property data, such as the inRnite dilution activity coefRcients of binary solvent}
hydrocarbon mixtures. Again, NRTL thermodyn-amic correlations were used to predict the occurrence of two liquid phases and a Newton}Raphson
convergence method was used to carry out the simu-lations.
Simulations of a ED process separating an 85/15 wt% CyC6/2,4-DMP mixture were made to
compare the MIST solvent with four common extrac-tion solvents, ethylene (EG), triethylene glycol (TEG), sulfolane and N-methyl pyrrolidone (NMP). The simulations were for a 25 theoretical stage ED tower at a S/F ratio of 16. The CyC6recovery in the extract
stream was speciRed at 99.0% and the overhead rafRnate product was allowed to vary.Table 6shows that the MIST solvent has a separation factor 5 times greater than TEG, which has the highest separation factor of the single solvents.
The MIST solvent was Rrst tested in a 150 mm diameter ED pilot plant using as the feedstock a
re-Rnery stream that had an average composition as shown inTable 7. Based on the successful pilot plant study, a commercial plant purifying 100 metric tonnes per day cyclohexane was designed, construc-ted and commissioned in 1991.
Light Ole
\
n and Paraf
\
n
Separations
[image:8.568.50.277.610.711.2]Table 7 Average ED pilot plant feedstock
Components wt%
Cyclohexane 89.1
2,2-Dimethylpentane 1.3
2,4-Dimethylpentane 4.0
3,3-Dimethylpentane 0.1
2,3-Dimethylpentane 0.9
2-Methylhexane 1.6
3-Methylhexane 1.1
2,2,3-Trimethylbutane 0.8
Dimethylcyclopentanes 1.0
n-Heptane 0.1
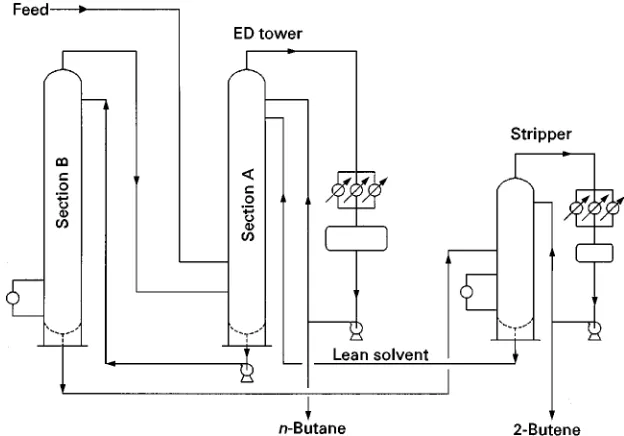
Figure 10 Schematic ED process diagram for separating 2-butene andn-butane.
butenes, the feedstock to butadiene units, were also in great demand. ED process technology was developed to recover high purity n-butenes suitable for pro-ducing butadiene to feed the synthetic rubber process. In this case, the selective solvent, developed by Shell Development Company in Houston, Texas, USA, was a mixture of 85% acetone and 15% water.
Later, furfural was used as an ED solvent for separ-ating isobutane from butene-1, n-butane from bu-tene-2, and butene-1 from butadiene. As shown in
Figure 10, furfural was tested in an ED tower consist-ing of two 50-tray sections in series for separatconsist-ing butene-2 from n-butane. Solvent was charged to a tray, which was several trays from the top of the
Rrst section (A), and Sowed to the bottom of this section. It was pumped together with dissolved hy-drocarbons to the top of the second section (B), and
withdrawn from the bottom of this section together with hydrocarbon bottoms. The solvent and bottoms are separated in a smaller 20-tray stripper tower, the solvent-free bottoms being removed as overhead and stripped solvent circulated back to the ED tower. Hydrocarbon feed is charged at some point below the solvent feed, near the bottom of the
Rrst section or top of the second section of the ED tower.
Forn-butane and 2-butene separation, the purity of 2-butene was 94.6 vol%with only 39.4 vol% recov-ery. For mixed butanes and mixed butenes separ-ation, the purity of mixed butenes was 88.7 vol% with 96.7 vol% recovery, and for butadiene and butenes separation, the purity of butadiene was 96.9 vol% with 89.7 vol% recovery. Obviously, these results did not meet the industrial require-ments for producing high purity product with high recovery.
Further studies were carried out to screen solvents for oleRn and parafRn separations. For example, a comprehensive solvent screening study was conduc-ted for n-butane and butene-2 separations. Eighty solvents were evaluated, including ester-type solvents containing hydroxyl groups, aldehyde groups, amine groups, nitrile groups, nitro groups, ketone groups, nitrogen; ether-type solvents; and miscellaneous sol-vents. It was found that aniline and furfural were the most selective solvents. The VLE data forn-butane and 2-butenes in furfural and aniline solvents are given inFigures 11and12. AlthoughN-formyl mor-pholine was also tested among the nitrogen-contain-ing solvents for n-butane and 2-butenes separation,
[image:9.568.126.438.475.693.2]Figure 11 Vapour}liquid equilibrium ofn-butane and 2-butene
in Furfural. Solvent dosage: 䢇, 3.7; 䉺, 4.5. Pressure, 3862 mmHg.
Figure 12 Vapour}liquid equilibrium ofn-butane and 2-butene
in aniline. Solvent dosage, 5.0; pressure, 3862 mmHg.
for unknown reasons the solvent was not considered for commercialization until recently.
Krupp Koppers has offered the BUTUNEX pro-cess, an ED process usingN-formyl morpholine as the selective solvent, for recovering 1-butene and 2-bu-tene from C4 hydrocarbon streams. On the basis of
such a feedstock with the composition of 25.6% isobutane, 32.7% n-butane, 26.6% 1-butene and 15.1% 2-butene, the following yields can be
achieved:
1-Butene 95.6% 2-Butene 99.1% Butanes 98.9%
The purity of 1-butene and 2-butene products can be 99.6%and 95.9%, respectively.
Conclusions
Since the 1940s, ED technology has gone through extensive development for solving many difRcult sep-aration problems in the petroleum and petrochemical industries. The development in cosolvent selection tailored for a speciRc separation and the advancement in tower internal design have made ED a competitive process. In many cases, ED processes can be more efRcient and economical than conventional LLE in terms of capital investment, energy consumption and ease of operation. It is anticipated that the ED technology will be selected more frequently in the future for the petroleum and petrochemical industries.
See also: II/Distillation: Theory of Distillation. III/React-ive Distillation.
Further Reading
Benedict M and Rubin LC (1945) Extractive and azeotropic distillation: I. Theoretical aspect. Transactions of the American Institution of Chemical Engineers 41: 353d370.
Brown RE and Lee FM (1991) Way to purity cyclohexane.
Hydrocarbon ProcessingMay: 83d86.
Doherty MF and Knapp JP (1993) Distillation, azotropic and extractive. In:Kirk}Othmer Encyclopedia of
Chem-ical Technology, 4th edn, vol. 8, pp. 358d398. New
York: John Wiley and Sons.
Drickamer HG and Hummel HH (1945) Application of experimental vapor}liquid equilibria to an analysis
of the operation of a commercial unit for the puriRcation of toluene from petroleum.Transactions of the American Institute of Chemical Engineers 41: 607d629.
Gentry JC and Kumar CS (1998) Improve BTX
Process-ing Economics. Hydrocarbon Processing (March):
69}74.
[image:10.568.61.267.439.616.2]