Ames Laboratory Conference Papers, Posters, and
Presentations
Ames Laboratory
1999
Electrochemical Pitting And Repassivation On
Icosahedral AL-CU-FE, And A Comparison With
Crystalline Phases
Nicholas A. Spurr
Iowa State University
Patrick J. Pinhero
Iowa State University
Daniel J. Sordelet
Iowa State University
Kurt R. Hebert
Iowa State University
Patricia A. Thiel
Iowa State University
, thiel@ameslab.gov
Follow this and additional works at:
http://lib.dr.iastate.edu/ameslab_conf
This Conference Proceeding is brought to you for free and open access by the Ames Laboratory at Iowa State University Digital Repository. It has been accepted for inclusion in Ames Laboratory Conference Papers, Posters, and Presentations by an authorized administrator of Iowa State University Digital Repository. For more information, please contactdigirep@iastate.edu.
Recommended Citation
Spurr, Nicholas A.; Pinhero, Patrick J.; Sordelet, Daniel J.; Hebert, Kurt R.; and Thiel, Patricia A., "Electrochemical Pitting And Repassivation On Icosahedral AL-CU-FE, And A Comparison With Crystalline Phases" (1999).Ames Laboratory Conference Papers, Posters, and Presentations. 69.
Electrochemical Pitting And Repassivation On Icosahedral AL-CU-FE,
And A Comparison With Crystalline Phases
Abstract
We report the electrochemical potentials at which localized pitting and repassivation occur on icosahedral
Al-Cu-Fe, and on a series of related alloys and elemental metals. The electrochemistry occurs in a buffered NaCI
solution, pH 8.4. Under these conditions, pitting and repassivation appear to be controlled mainly by the
chemical composition of the alloy, although the quasicrystalline phase displays an anomalous resistance to
repassivation. Corrosion of this phase proceeds by dissolution of Al and Fe, leaving behind pits which are
Cu-enriched.
Comments
This article is from
Quasicrystals: Proceedings of the MRS 1998 Fall Meeting
553 (1999): pp. 275—280,
doi:
10.1557/PROC-553-275
ELECfROCHEMICAL PITTING AND REPASSIV ATION ON ICOSAHEDRAL
AL-CU-FE, AND A COMPARISON WITH CRYSTALLINE PHASES
NICHOLAS A. SPURR, PATRICK J. PINHERO, DANIEL J. SORDELET, KURT R.
HEBERT, PATRICIA A. THIEL
Department of Chemistry and Ames Laboratory, Iowa State University, Ames, IA 50011 USA
Abstract
We report the electrochemical potentials at which localized pitting and repassivation occur on icosahedral Al-Cu-Fe, and on a series of related alloys and elemental metals. The electrochemistry occurs in a buffered NaCI solution, pH 8.4. Under these conditions, pitting and repassivation appear to be controlled mainly by the chemical composition of the alloy, although the quasicrystalline phase displays an anomalous resistance to repassivation. Corrosion of this phase proceeds by dissolution of AI and Fe, leaving behind pits which are Cu-enriched.
Introduction
The process of localized corrosion is important to the failure of materials, particularly in liquid environments.
Pitting corrosion typically begins at defects on the surface of a material.[!] The oxide layer is removed by increasing the electrochemical potential at the metal (during voltarnrnetry).
This causes the metal to be exposed, and the metal dissolves away, creating a pit which emanates radially from the defect. The potential where pitting begins corresponds to a sudden increase in electrochemical current. A more positive pitting potential indicates higher resistance to this localized corrosion. Similarly, as potential decreases during voltarnrnetry, an oxide re-forms on the surface and re-passivates. This is signalled by an abrupt decline in electrochemical current. The value of the repassivation potential is related to the ability of the exposed metal to reform the passive oxide layer, which is also important to corrosion resistance.[!] A more positive repassivation potential indicates easier formation of the passivating layer.
Hence, the pitting and repassivation potentials during cyclic voltarnrnetry serve as indications of the conditions under which these localized corrosion events can occur. Previously, electrochemical corrosion of quasicrystals has been investigated,[2-4] but pitting and repassivation potentials have not been examined.
Experimental Description
Sample preparation. The alloys
p,
A, \jf, ro were prepared by hot-isostatically-pressing a gas atomized powder (1 0-25 J.lm). The resultant monoliths were cut and polished down to 1 J.lrn diamond paste. They were examined using scanning electron microscopy (SEM) and scanning Auger microscopy (SAM) for secondary phases; none could be detected. (The detection limit is about 0.1% in surface area.) Table 1 shows the bulk composition of each of the alloys; these are determined by inductively-coupled plasma atomic-emission spectroscopy (ICP-AES). The'!'-phase is the quasicrystalline '!'-phase. The
p,
A, and ro alloys border on the \jf-phase in the phase275
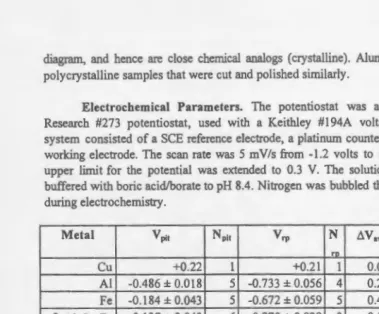
diagram, and hence are close chemical analogs (crystalline). Aluminum, copper and iron were polycrystalline samples that were cut and polished similarly.
Electrochemical Parameters. The potentiostat was an EG&G Princeton Applied
Research #273 potentiostat, used with a Keithley # 194A voltarnmeter. The three-electrode system consisted of a SCE reference electrode, a platinum counter electrode, and the sample as working electrode. The scan rate was 5 mV/s from -1.2 volts to 0.2 V. In the case of Cu, the upper limit for the potential was extended to 0.3 V. The solution was aqueous 0.1 M NaCl, buffered with boric acid/borate to pH 8.4. Nitrogen was bubbled through the solution before and during electrochemistry.
Metal Ypit Npit
vrp
N D.V,. %Al %Cu %Fero
Cu +0.22 I +0.21 I 0.01 100
AI -0.486 ± 0.018 5 -0.733 ± 0.056 4 0.25 100
Fe -0.184 ± 0.043 5 -0.672 ± 0.059 5 0.49 100
~-Al-Cu-Fe -0.137 ± 0.043 6 -0.270 ± 0.029 3 0.13 51.1 34.6 14.3
±0.3 ±1.2 ±0.3 A.-Al-Cu-Fe -0.153 ± 0.038 3 -0.457 ± 0.110 3 0.30 74.5 3.0 22.5 ±0.3 ±1.2 ±0.3 \jf-Al-Cu-Fe -0.194 ± 0.033 8 -0.667 ± 0.014 3 0.47 65.7 22.2 12.1 ±0.3 ±1.2 ±0.3 co-Al-Cu-Fe -0.276 ± 0.055 3 -0.470 ± 0.025 3 0.19 69.58 20.27 10.14 ±0.17 ±0.2 ±0.19
Table l: Measured pitting and repassivation potentials, and chemical compositions, of the metals. The pitting potentials, V, are measured vs. a saturated calomel electrode (SCE). The uncertainties are 95% confidence intervals. The number of measurements is N. The difference between the average values of V ~· and V ,., 6 V ,., indicates the width of the hysteresis illustrated in Fig. I. Compositions are given in atomic per cent.
Experimental Results
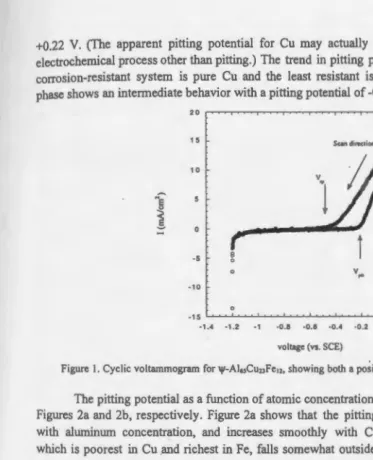
Typical Voltammogram. Figure I shows a typical cyclic voltarnmogram. During the positivegoing sweep, the curve shows a low and constant value between the initial potential of -1.2 V and -0.25 V. At -0.25 V the current density starts to increase quickly to a fmal value of + 16.5 mA/cm2 at 0.2 V. The potential corresponding to the change in the slope is the pitting potential, V pit· The pitting potential can be determined more exactly by approximating the
baseline (at V<-0.25V) and the increasing current density (V>-0.21V) as straight lines, and
extrapolating them to their intersection. In Fig. I, Vpit equals -0.25 V.
After reversing the potential ramp, the curve decreases rapidly between 0.2 V and -0.66 V, then flattens out at -0.66 V. The repassivation potential, V rp is also determined by extrapolation of the two sections of the curve. In this example, V rp equals -0.66 V. The cyclic voltarnmograms for the other phases show similar behavior; the difference is that the pitting and repassivation potentials are shifted toward positive or negative values.
Pitting potentials. The pitting potentials for the different metals are given in Table 1. These values are negative for all the compounds, except for Cu which shows a positive value,
[image:4.612.35.414.41.355.2]re
~d je
as
1e :1, ld
e
g e
j
+0.22 V. (The apparent pitting potential for Cu may actually indicate oxidation [5] or some
electrochemical process other than pitting.) The trend in pitting potentials implies that the most corrosion-resistant system is pure Cu and the least resistant is pure AI. The quasicrystalline
phase shows an intermediate behavior with a pitting potential of -0.194 V.
20
1 5
10
M~ u
1
·5
v,h
·10
·15 c..._._._..~..._~.._,_~.._._.~_,__~.J...~L...__._j
·1.4 ·1.2 ·1 ·0.8 ·0.6 ·0.4 ·0.2 0.2
voltage (vs. SCE)
Figure I. Cyclic voltammogram for 1ji-AI.,CuuFe,>, showing both a po~itive-and negative-going sweep.
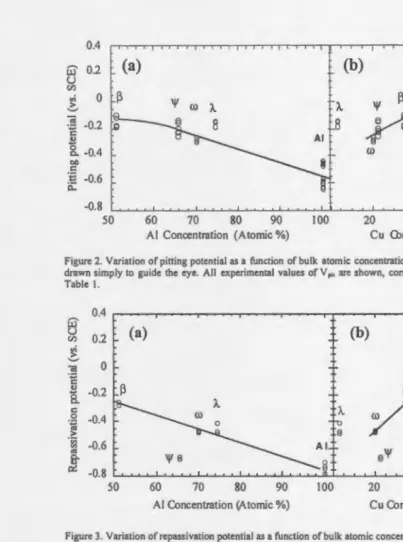
The pitting potential as a function of atomic concentration of Al and Cu is represented in Figures 2a and 2b, respectively. Figure 2a shows that the pitting potential decreases smoothly
with alUlllinum concentration, and increases smoothly with Cu concentration. The A.-phase,
which is poorest in Cu and richest in Fe, falls somewhat outside the trends established by the other metals. We speculate that the reactivity of the A.-phase may be controlled by Fe, rather than by Al or Cu. There is no obvious correlation between Vpit and Fe concentration (not shown
as a Figure), at least over the range of compositions spanned by these alloys.
Repassivation Potentials. The repassivation potentials were determined for the various
alloys. The results are included in Table I. The repassivation potentials range from +0.21 V for
copper to -0.733 V for pure aluminum. The \jf-phase shows an intermediate value, -0.667 V.
Repassivation potentials are shown as a function of atomic composition in Figures 3a and
3b. The same trends are followed as for the pitting potential: the repassivation potential
decreases with AI content (Fig. 3a), and increases with Cu content (Fig. 3b). There is little or no
correlation with Fe content (not shown). The A.-phase tends to deviate toward more positive
values ofV rp• as it did also for the pitting potential. Again, this may be related to the low Cu .and
high Fe content of this phase. An even stronger deviation is shown by the \jf-phase, toward
negative values ofVrp· Note that the ljf-phase did not show such a deviation in the values of Vpit
(Fig. 2). This is also reflected in the fact that the voltage hysteresis, i.e. the difference between
pitting and repassivation potentials, is unusually large in the ljf-phase, relative to the other Al-rich alloys (see Table 1). The more negative potential exhibited by the ljf-phase is an undesirable property, as it signals an unusual resistance to repassivation.
[image:5.612.15.388.59.519.2]0.4 I ' ' I
(a)
(b)
Cuiii'
0.2u C/J
.,; 0 ~ 'V
~ (I) A.
] c -0.2
8
~ c.. -0.4 (I)
bl)
c
.B -0.6 0:::
-0.8
[image:6.612.12.415.60.602.2]50 60 70 80 90 IOO 20 40 60 80 IOO AI Concentration (Atomic%) Cu Concentration (Atonic%)
Figure 2. Variation of pining potential as a function of bulk atomic concentrations of (a) AI, and (b) Cu. Lines are drawn simply to guide the eye. All experimental values of V ,;, are shown, corresponding to the averages given in Table I.
0.4
iii'
(a)
u 0.2 C/J Cu(b)
.,; ~ ca 0-~
<U
-0.2 ~
8.
A.c
0 -0.4
·~ > ·v; -0.6
"'
"'
c.. \j/€1
<U
~
-0.8
50 60 70 80 90 IOO 20 40 60 80 IOO AI Concentration (Atomic%) Cu Concentration (Atomic%)
Figure 3. Variation ofrepassivation potential as a function of bulk atomic concentrations of(a) AI, and (b) Cu. Lines are drawn simply to guide the eye. All experimental values ofV,, are shown, corresponding to the averages given in Table I.
Microscopic and Chemical Analysis of \j/-Phase Pits. A scarming electron micrograph of the pits formed on the \j/-phase is shown in Figure 4. The pits exhibit high contrast relative to
the background material, i.e. they are either white or black, and they are about I ~m in diameter. The boundaries between the powder particles which comprised the sample originally (before hot isostatic pressing) are evident as strings of smaller black dots, which mark the original oxide coating. The pits do not form preferentially at the prior particle boundaries.
Both SAM, and energy-dispersive spectroscopy (EDS) of x-rays generated in SEM, show Cu-enrichment in the pits. SAM, for instance, indicated that the pits contain 35-37% AI, 7% Fe, and 55-58% Cu, whereas the matrix surrounding the pits contains 62% AI, 20% Fe, and
18% Cu. Within the probable limits of accuracy of the SAM measurement (3-4 atomic %), the values for the matrix agree with the values expected for the bulk sample (Table 1 ). The values for both the matrix and the pits were measured only on a single sample (which underwent one cycle ofvoltammetry), and for only a few pits. Hence, their precision is uncertain. Nonetheless, they provide a qualitative example of the degree of Cu-enrichment.
This analysis of the pits is consistent with the chemical composition of the solution measured with ICP-AES. The solution after corrosion showed a concentration of 0.24 ppm AI,
0.07 ppm Fe, and no Cu. (The detection limit was 0.05 ppm for all three elements.). Hence, all
three analyses (SAM and EDS of the pits, and ICP-AES of the solution) lead to the conclusion
that AI and Fe dissolve during cyclic voltammetry, leaving pits which are enriched in the noblest metal, Cu.
These chemical analyses provoke conclusions analogous to those of Asami, et al.,[3] who found that electrochemical corrosion of icosahedral Al-Pd-Mn in media similar to ours left a surface enriched in the noble metal, Pd. Also, Dubois et al. [2] analyzed the solution left after electrochemical corrosion of an Al-Cu-Fe-Cr coating in acidic media. They found very little Cu in solution, implying that the remaining solid surface would be Cu-rich. Hence, the general trend seems to be that the noblest metal remains at the surface during corrosion, while the other components dissolve.
Figure 4: Scanning electron micrograph (2500x) of the ljl-phase after cyclic voltammetry. The pit concentration
increases toward the lower left comer. Particle boundaries are evident as strings of small dark dots. The horizontal white line at the bottom of the figure corresponds to a length of I 0 Jlm.
Conclusions
Among the alloys examined here, the propensity for electrochemical pitting appears to be
controlled mainly by chemical composition. Resistance to corrosion is enhanced with decreasing
AI content, and with increasing Cu content. There is no apparent correlation with Fe content, over the range of metals examined here. Repassivation potentials follow a similar trend, although
the icosahedral phase shows an anomalous resistance to repassivation. The pits on the
icosahedral phase are Cu-rich, apparently forming by dissolution of AI and Fe.
Our conclusion that corrosion is controlled mainly by chemical composition, is quite similar to that of Massiani, et al.[4] They found that the resistance to electrochemical corrosion as a function of pH, in a series of Al-Cu-Fe alloys, was a function of their composition rather
than their specific atomic structure.
ACKNOWLEDGEMENTS
This work was supported by the Director, Office of Energy Research, Office of Basic Energy Sciences, Materials Sciences Division of the U.S. Department of Energy under Contract No. W-405-Eng-82.
References
1. R. Baboian, Corrosion Tests and Standards Application and Interpretation. (American Society for testing on Materials Philadelphia, PA 1995) 166-174.
2. J-M. Dubois, Y. Massiani, S. Ait Yaazza, "Electrochemical corrosion behavior of quasicrystalline coatings in dilute acetic acid," Proceedings of the Fifth International Conftrence
on Quasicrystals, Ed. C. Janot and R. Mosseri, (World Scientific, Singapore 1995) 790-793.
3. K. Asami, A.-P. Tsai, K. Hashimoto, Material Science and Engineering Al81/Al82 1141-1144 (1994).
4. Y. Massiani, S. Ait Yaazza, J.P. Crousier, and J. M. Dubois, Journal of Non-Crystalline Solids 92-100 (1993).
5. M. Pourbaix, Atlas of Electrochemical Equilibria in Aqueous Solutions, (Pergamon, Oxford 1966) 384.