MEASURING RAINFALL FROM ABOVE AND BELOW THE SEA SURFACE
G. D. Quartly, T. H. Guymer, M.A. Srokosz, K.G. Birch & C.E. Jones
Southampton Oceanography Centre
Empress Dock, Southampton, UK
ABSTRACT
Satellites play a major role in the determination of the rainfall at sea. Researchers at Southampton Oceanography Centre (SOC) have been involved in two projects addressing this task. First they have been instrumental in developing techniques to retrieve rain rate information from the 10+ years of dual-frequency altimeter data. The TOPEX radar measures rainfall via the attenuation it causes, producing a climatology that is independent of those derived from passive microwave (PM) and infra-red (IR) sensors. Because TOPEX is an active microwave sensor, it can have a much smaller footprint than PM sensors. Therefore it can be used to estimate the size of rain cells, showing that the ITCZ and mid-latitude storm tracks are characterized by larger rain systems than elsewhere. TOPEX’s simultaneous recording of wind and wave data reveal that, for mid-latitude systems, rain is most likely in association with developing seas.
All satellite-based datasets require validation, and SOC's work on the development and testing of acoustic rain gauges is the second aspect of this paper. By listening at a range of frequencies, an underwater hydrophone may distinguish the spectra of wind, rain, shipping etc., and estimate the wind speed or rain rate according to the magnitude of the signals. All our campaigns have shown a good acoustic response to changes in wind speed. However the quantitative inversion for recent trials has given values that are too high, possibly because of significant acoustic reflection from the sea bottom. The changes in spectral slope often agree with other observations of rain, although validation experiments in coastal regions are hampered by the extraneous sources present. Acoustic rain gauges would eventually see service not only for routine satellite validation, but also for real-time monitoring of locations of interest.
1. ALTIMETRIC ANALYSIS
1.1 BACKGROUND TO TOPEX'S RAIN RECORDS
TOPEX, launched in 1992, is the first satellite altimeter to operate at two radar frequencies (Fu et al., 1994). Comparison of the oceanic backscatter strengths at Ku- and C-band has enabled sub-satellite
rainfall to be detected (Quartly et al., 1996). The differential performance at the two frequencies is mainly caused by the attenuation (absorption) of the Ku-band signal, leading to the development of a
rain rate algorithm (Quartly et al., 1999). The formula used
is:-∆σ
0= 2 H a R
b(1)
in the mid-latitude storm tracks in the N. Atlantic and N. Pacific. Figure 1 shows the interannual behaviour in the tropical Pacific. The start of 1998 is marked by a broader, more southerly ITCZ, with a greater frequency of rain in that region too. The geographical changes in rainfall coincide with the enlarged region of the western warm pool (Quartly et al., 2000a).
Figure 1 : Change in precipitation patterns during the recent El Niño The thick and thin white lines show the 28˚C and 24˚C isotherms respectively. (Taken from Quartly et al., 2000a.)
1.2 COMPARISON OF CLIMATOLOGIES
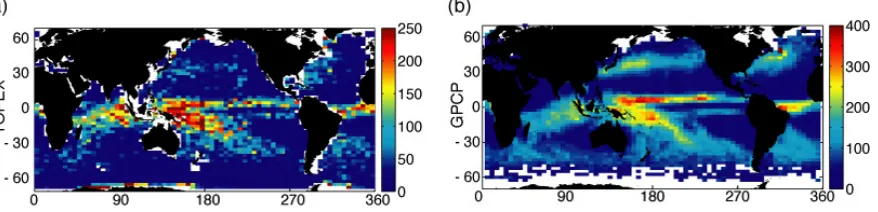
We compared the TOPEX-derived climatology with that of the Global Precipitation Climatology Project (GPCP, see Huffman et al., 1997). Although displaying the same spatial patterns, the magnitudes differ, with TOPEX returning only 70% of the GPCP values in the tropics, and much less at higher latitudes.
Figure 2 : Composite of rainfall for March-April 1993-1996. a) TOPEX climatology, b) GPCP.
This apparent bias was investigated by comparing TOPEX rain rates to the near-simultaneous measurements from rain radars (McMillan et al., 2002). The comparison with the TOGA-COARE rain radar actually suggested that TOPEX was reading high by a factor of two; however, in another comparison using these 'ground truth' data, Ebert and Manton (1998) found the magnitudes of PM and IR rain algorithms also gave readings that were far too high. The TOPEX rain algorithm is purely physical, with no empirical tuning; however, the TOGA-COARE analysis did imply that TOPEX would underestimate due to inhomogeneities within the 6 km footprint (non-uniform beamfilling), and also due to no account being taken of the unrecorded 'drizzle fraction' since the algorithm's detection threshold corresponds to a rain rate of ~2.3 mm hr-1.
However, there are also sizeable differences between other climatologies, such as the TMI and PR datasets from the TRMM satellite (Kakar and Kummerow, 2000), so we do not feel it appropriate to adjust our values empirically, but accept that there are some physical reasons for our underestimation.
[image:2.595.82.521.413.519.2]do allow for analyses not possible with PM or IR sensors. These are addressed in the succeeding two sections.
1.3 MEASURING RAIN CELLS
[image:3.595.79.521.284.423.2]The footprint for TOPEX's backscatter measurement is approximately 6 km in diameter, with consecutive measurements being taken every 5.8 km (1s flight time) along track. Thus compared to a PM footprint of ~40 km, TOPEX is able to provide fairly fine resolution measurements of the size of rain cells. We investigated this for 10˚ x 10˚ regions globally, and in all locations noted that the majority of events affect only isolated individual records along track (Fig. 3a) However, if we examine the tail of the probability distribution function, calculating a mean length scale of attenuation events affecting more than one point, we find that the areas with the higher total rainfall receive their rain from larger rain cells (Fig. 3b). For example, the storms in the North Atlantic are larger in the west, where they release most of their rain, than they are by the time they reach the east. Marked zonal differences are also seen in the Pacific ITCZ.
Figure 3 : a) Illustrative histogram of length of rain events at one 10˚ x 10˚ location. b) Mean length of all events more than one point long (Jan. 1993 – Dec. 1996).
Although poor at detecting low rain rates, the attenuation algorithm does not suffer any problems (such as saturation) at high rain rates. Quartly et al. (2000a) used this property to investigate the mean intensity of rain events in the tropical Pacific. As well as a greater occurrence of rain (see Fig. 1), the 1997/98 El Niño was marked by a greater rain rate when raining.
1.4 CORRELATION WITH SEA STATE
Figure 4 : a) Scatter plot of simultaneous wind and wave observations. The black line shows the Pierson-Moskowitz relation for waves in equilibrium with the winds. Points above the line are 'Swell'
(wave heights greater than that supported by the wind) and those below correspond to 'developing seas'. b) Rain likelihood as a function of wind-wave conditions. Data are for March-April averaged
over 1993-1996. (Taken from Quartly et al., 1999)
2. ACOUSTIC ANALYSIS
2.1 BACKGROUND TO UNDERWATER ACOUSTIC SENSING OF RAIN
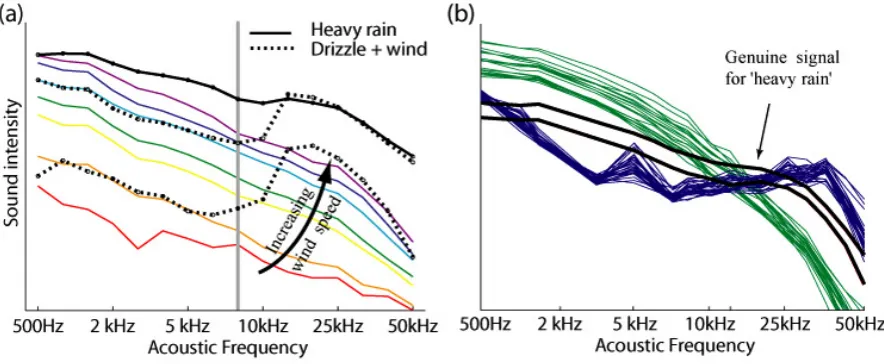
A series of laboratory measurements has shown that there are several mechanisms by which rain creates underwater sound. First, there is the initial impact of the drop on the surface (Nystuen, 1986). Second, there is the generation of a sub-surface bubble — a very common and loud process for the small drops in drizzle, resulting in a characteristic peak in intensity around 14 kHz (Pumphrey et al., 1989). Third, the largest raindrops generate splash products on impact, and these in turn add to the sound generated (Nystuen et al., 1993).
There may be many other sources of underwater sound. One of the key features of Acoustic Rain Gauges (ARGs) is their recording of sound levels over a wide range of frequencies, and their use of that information to distinguish between various possible sources (Nystuen and Selsor, 1997).
Fig. 5 : Comparison of spectra from various sources. a) Wind-only (in colour), wind and drizzle (black dashed) and heavy rain (solid black). b) Heavy rain compared with two believed man-made
[image:4.595.75.517.535.717.2]2.2 DESIGN AND DEPLOYMENT OF ACOUSTIC RAIN GAUGES
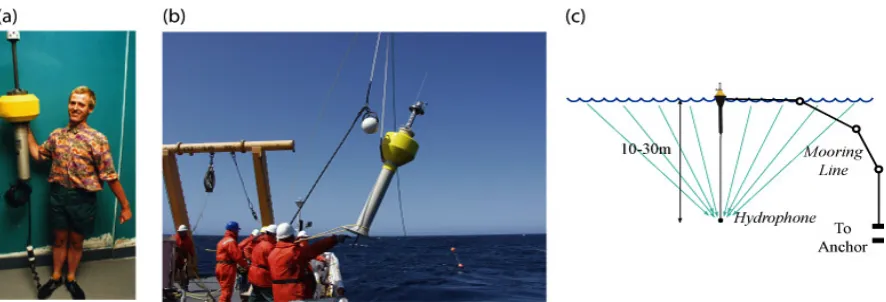
[image:5.595.76.519.244.395.2]SOC's initial trials of ARGs were with a surface unit ~1m long, with the hydrophone on a thin cable 30m long (Fig. 6a). The early easily-portable versions were used in a series of month-long trials in Loch long and Loch Etive (Quartly et al., 2000b). The hardware has been changed over the years, to allow us to move from testing in a sheltered environment to long-time exposure in harsher situations. Our first coastal deployment was near Aberporth in Wales (Quartly et al., 2002), with more recent trials on the Scotian Shelf off Canada and in the English Channel off Plymouth. The present version is 3.4m long, and requires a crane to move it (Fig. 6b). However, the concept behind it is the same as for the Mk I buoy. An omni-directional hydrophone tens of metres below the surface is sensitive to rain over a large area of the sea surface (Fig. 6c); this enables it to be sensitive to the slightest rainfall and detect short period changes. As it is important to avoid the hydrophone being on a taut resonant line, we use small buoyancy spheres to keep the mooring line away from the hydrophone cable.
Figure 6 : Developments in the SOC Acoustic Rain Gauge programme. a) Mk I ARG, based on a helicopter-deployable sonarbuoy, b) Mk IV ARG being deployed from CFAV Quest. c) Schematic of
mooring arrangement and area over which rain is detected.
2.3 SENSITIVITY OF ACOUSTIC RAIN GAUGES TO WIND SPEED
Figure 7 : Comparsion of 8 kHz acoustic intensity with local measurement of wind speed. Expected curve of Vagle et al. (1990) given by black line; the crosses show the mean and the vertical bars ±1
std. dev. of the ensemble of observations. a) Loch Etive. b) Scotian Shelf.
2.4 DETECTION OF RAIN BY ACOUSTIC RAIN GAUGES
The theory behind the acoustical detection of rain is illustrated in Fig. 5a — bubbles produced by the small drops in light rain generate a characteristic 'drizzle peak' around 14 kHz; heavier rain reduced the magnitude of the slope of the acoustic spectrum. Our trials in Loch Etive, a generally quiet location, often showed a reliable discrimination between wind and rain (Fig. 8a). However there were periods for which the acoustic sensors reported 'heavy rain', but none of the other sensors showed any rainfall. The spectra on such occasions (Fig. 5b) were not similar to those for corroborated rain events, and the events were confined to daylight hours. We suspect that the anomalous spectra are due to boating activity near the moorings and operation of machinery on the boats; neither of which have been automatically recognised as 'acoustic contamination'. Experiences in the open ocean test were similar. The presence of a 'drizzle peak' and changes in spectral slope did coincide with some of the independent observations of rain (Fig. 8b), but the automatic acoustic classification was not always reliable. This may be due to the increased sound levels, noted in Fig. 7b.
Figure 8 : Acoustic observations during rain events. a) Comparison of acoustic classification during Loch Etive trial, with nearby tipping bucket data (each 'X' marks a tip equivalent to 0.1 mm of rain. b) Spectral slope and drizzle peak during Scotian Shelf trial compared with an optical rain gauge and
[image:6.595.77.519.523.671.2]3. SUMMARY
TRMM and its successor GPM should lead to great advances in our understanding of the global precipitation field. However there is much that can still be done with existing sensors to address the variability on various temporal and spatial scales. Southampton Oceanography Centre has been heavily involved in the development of a rainfall climatology based on dual-frequency altimeter data, and in the testing of acoustic rain gauges. The first technology gives a global picture allowing studies of interannual variations, length scales of events and the associated wind-wave conditions. The second method may yield frequent rainfall estimates over a sizeable area, which should contribute to satellite validation, as it will be important for calibration of GPM to have measurements over the deep ocean, as well as at coastal sites and over land. Acoustic Rain Gauges could also provide real-time monitoring of selected locations for the purpose of weather forecasting. However, further tests are still needed in order to address differences in performance for different locations.
4. REFERENCES
EBERT, E.E., and MANTON, M.J., (1998) Performance of satellite rainfall estimation algorithms during TOGA COARE. J. Atmos. Sci., 55, pp 1537-1557.
FU, L-L. et al., (1994) TOPEX/POSEIDON mission overview. J. Geophys. Res., 99, pp 24369-24381. GOLDHIRSH, J. and WALSH, E.J., (1982) Rain measurements from space using a modified
Seasat-type radar altimeter. IEEE Trans. Antennas and Propagation, 30, pp 726-733.
HUFFMAN G.J. et al., (1997) The Global Precipitation Climatology Project (GPCP) combined precipitation dataset. Bull. Amer. Met. Soc., 78, pp 5-20.
KAKAR, R. and KUMMEROW, C., (2000) The tropical rainfall measuring mission (TRMM) - What have we learned and what does the future hold? Proc. of PORSEC '00, Goa, India, 5th-8th Dec. 2000, Vol. I, pp 138-142.
MCMILLAN, A.C., QUARTLY, G.D., SROKOSZ, M.A. and TOURNADRE, J., (2002) Validation of TOPEX rain algorithm: Comparison with ground-based radar. J. Geophys. Res., 107, 3.1-3.10. (DOI 10.1029/2001JD000872)
NYSTUEN, J.A., (1986) Rainfall measurements using underwater ambient noise. J. Acoust. Soc. Am., 79, pp 972-982.
NYSTUEN, J.A., MCGLOTHIN, C.C., and COOK, M.S., (1993) The underwater sound generated by heavy rainfall. J. Acoust. Soc. Am., 93, pp 3169-3177.
NYSTUEN, J.A. and SELSOR, H.D., (1997) Weather classification using passive acoustic drifters. J. Atmos. Oceanic Technol., 14, pp 656-666.
PUMPHREY, H.C., CRUM, L.A., and BJØRNØ, L., (1989) Underwater sound produced by individual drop impacts and rainfall. J. Acoust. Soc. Am., 85, pp 1518-1526.
QUARTLY, G.D., GUYMER, T.H., and SROKOSZ, M.A., (1996) The effects of rain on Topex radar altimeter data. J. Atmos. Oceanic Tech. 13, pp 1209-1229.
QUARTLY, G.D., SROKOSZ, M.A., and GUYMER, T.H., (1999) Global precipitation statistics from dual-frequency TOPEX altimetry. J. Geophys. Res.104 (D24), pp 31489-31516.
QUARTLY, G.D., SROKOSZ, M.A., and GUYMER, T.H., (2000a) Changes in oceanic precipitation during the 1997-98 El Niño. Geophys. Res. Lett., 27, pp 2293-2296.
QUARTLY, G.D., GUYMER, T.H., BIRCH, K.G., SMITHERS, J., GOY, K., and WADDINGTON, I., (2000b) Listening for rain: Theory and practice. Proc. of 5th European Conference on Underwater Acoustics, Lyon, France, 11th-13th July 2000, Vol. I, pp 723-728.
QUARTLY, G.D., SHANNON, K.M., GUYMER, T.H., BIRCH, K.G., and CAMPBELL, J.M., (2002) Testing acoustic rain gauges in inland and coastal waters. Proc. of the 6th European Conference on Underwater Acoustics, 24th-27th June 2002, Gdansk, pp 659-664.