1
Determining the welfare effects of introducing a cap-and-share scheme on
rural commuters
David McNamara and Brian Caulfield*
Department of Civil, Structural and Environmental Engineering, Trinity College Dublin, Ireland
Abstract
Commuters in rural Ireland, like in many other countries are primarily constrained to using private vehicles as their primary form of transport. This reliance on motorcars is much greater than in urban areas which are well served by public transport. With this in mind, carbon reduction schemes such as carbon taxation and carbon trading which penalise the use of these less sustainable modes of transport, have the potential to create inequitable outcomes for commuters in rural areas. This paper evaluates the welfare effects of introducing a cap-and-share scheme on the end users of transport in rural Ireland. It focuses on individuals who undertake daily commute trips as surveyed in the Census of Population, 2006. Two distinct regions are chosen as study areas for the analysis: the urbanised Dublin Metropolitan Region (DMR) and the rural Western & Border Region (WBR). These two regions are chosen as a means of comparing the welfare loss of rural commuters against urban commuters.
A welfare analysis utilising a consumer surplus model is used to determine the effects of the scheme on each region. The findings show a significantly higher welfare loss to commuters residing in sparsely populated rural areas in comparison to urban commuters. This finding is also true of commuters living in relatively deprived areas which frequently are also rural regions where the more affluent areas bear less of the welfare loss than deprived areas. These results demonstrate the need for policies which compensate the most deprived areas in tandem with introducing a cap-and-share scheme in Ireland to avoid inequity outcomes.
1. Introduction
In Ireland the transport sector has become one of the major sources of green house gas
(GHG) emissions growth in recent years. According to Ireland’s Environmental Protection
Agency (EPA) transport emissions accounted for 21.1% of Ireland’s GHG emissions in 2008.
This was a 176% increase on 1990 levels. Road transport accounted for 97% of transport emissions (EPA, 2010). This increase is second only to Cyprus amongst the 27 EU countries *Manuscript
2 (EPA, 2010). Therefore significant reductions of road transport emissions as part of overall GHG emissions is required.
A number of carbon reduction policies have been examined in Ireland and in 2010 the Irish
Government introduced a carbon tax. This tax was applied to fossil fuels at €15 per tonne on
Kerosene, Marked Gas Oil, Liquid Petroleum Gas (LPG), Fuel Oil and Natural Gas. Research conducted to-date on the scheme has found that such a tax levied at a flat rate across the economy is regressive without simultaneously increasing social benefits and tax credits (Tol et al., 2008, Callan et al., 2009). While research into the effects of carbon taxation is substantial, research into alternative market based carbon reduction schemes is not nearly as comprehensive, particularly with respect to welfare issues. Moreover, due to the regressive aspects of the carbon taxation identified in previous literature it is important to study the effects of alternative schemes which may have less regressive effects on the population. The research presented in this paper seeks to investigate the welfare effects of an alternative carbon reduction policy, cap-and-share. This study examines two distinct regions in Ireland, the urbanised Dublin Metropolitan Region (DMR) and the rural Western and Border Region (WBR). Measures of deprivation will be compared in both regions and a welfare analysis will determine the consumer surplus loss to commuters who fall above the cap in both regions with particular focus on the effects on commuters in more deprived rural areas.
Cap-and-share schemes set a limit on the quantity of GHG’s which can be emitted in an
economy annually. This cap is enforced by issuing permits to GHG emitters in the economy. If an entity exceeds their allowance they can purchase permits from entities that have a
surplus. This creates a market for GHG’s which is operated and regulated by government.
The different methods of implementing such schemes are discussed in more detail in the subsequent sections.
3 2. Literature review
2.1 Cap-and-share
Literature relating to cap-and-share has reached near consensus that such a scheme can effectively reduce GHG emissions and is less regressive than a carbon tax (AEA Energy & Environment 2008, Starkey and Anderson, 2005). Two distinct methods of implementing a cap-and-share scheme have been researched; an upstream cap and a downstream cap. An upstream cap issues permits to producers and importers of energy i.e. oil refineries, fuel importers etc, who then pass on the cost of maintaining emissions under the cap to the consumers who purchase that energy in its various forms. These entities can also trade or share any allowances they do not use with other entities that require them. A downstream cap bypasses the producers and importers of energy and issue permits to end users who trade these permits as they require creating a much larger market for carbon than an upstream cap. Fleming (1997) was one of the first authors to advocate the use of “tradable quotas” in
reducing carbon emissions. The scheme distributed free allowances to end users creating an auction process for businesses and public sector bodies to purchase quotas. This approach is an example of a downstream cap. Wadud (2008) also advocated the use of a downstream cap in the form of a personal tradable carbon permits. Equity issues are also researched in this paper and are discussed in section 2.2.
Advocates of a downstream cap argue that durable reductions in GHG emissions can only be achieved through the behavioural changes associated with a downstream cap on consumers (Fleming, 1997, Fawcett, 2005, Niemeier et al., 2008). A downstream cap applied to each individual provides a direct incentive to change behaviour rewarded with positive equity outcomes. The potential outcome of an upstream cap is increased fuel and utility prices which would be in effect a tax on consumers creating inequitable results (Fleming, 1997). Niemeier et al. (2008) proposed a household GHG cap and trade which would target consumers with four key elements: a state allocation to households, household to household trading, households to utility company credit transfers, and utility companies to government credit
transfers. The proposed system augmented Fleming’s model in allocating free allowances to
consumers while granting regulation of the scheme to energy utility companies. This system is found to be more equitable than carbon taxes and an upstream cap. It also avoids politically motivated movements of the cap level by placing the regulation of the scheme in utility
4 Subsequent studies have advocated an upstream cap (Ellerman, 2000, Tietenberg, 2002, Millard-Ball, 2008). Millard-Ball (2008) recommended the use of such a scheme due to its administrative simplicity and complete coverage of a small group of energy importers. This is
a view shared by California’s Market Advisory Committee (MAC). The MAC was created to study market-based mechanisms to reduce GHG emissions in the US state. The MAC recommended an upstream cap due to reduced administrative costs in comparison to a downstream cap and the presence of fewer agents in the market (California Air Resources Board, 2007). While the simplicity of an upstream cap in an advantage the behavioural changes required to reduce emission are perhaps only possible by applying the cap downstream on each individual agent in the economy. Cramton and Kerr (2002) also advocate the introduction of an upstream cap scheme for reasons of administrative simplicity and efficiency while discussing the auction process involved in regulating and operating such a scheme. The regulation and operation of any scheme is beyond the remit of this paper but is a topic that requires further research to fully understand the costs and complexities of introducing a cap-and-share in either form.
2.2 Equity and Deprivation
As this research is concerned with the end users of road transport, the impacts of a potential downstream are examined. Research in the transportation sector is limited, with many authors suggesting a cap on household energy use only. McNamara and Caulfield (2011) determined the socio-economic characteristics of individuals who would fall above a cap determined by average individual emissions. This method of calculating the carbon cap is also utilised in this study. This is ignoring the importance of the transport sector’s contribution to GHG
emissions. The Sustainable Development Council of Ireland (2008) recommended an initial cap on the transport sector applied downstream. This cap was compared to other carbon reduction measures and the potential effects of a cap were discussed. A minority of lower income households were predicted to be worse off from such a scheme and inequities between rural and urban dwellers were predicted to arise. Recent literature has suggested research is needed in the area of cap-and-share and associated energy poverty and equity issues (Brand and Preston, 2010).
5 allocations being adjusted accordingly. Raux and Marlot (2005) stressed the importance of a free allocation of CO2 permits to mitigate equity issues together with a tailored allocation of
permits based on socio-economic characteristics. The literature has suggested further research is needed in the area of cap-and-share and associated energy poverty and equity issues (Brand and Preston, 2010). In light of this research, this paper will seek to determine the welfare loss, if any, to rural commuters in the event of a downstream cap-and-share scheme being introduced employing a similar consumer surplus analysis used in Wadud (2008). The availability of individualised travel data also lends itself to the research of a downstream scheme. The issue of deprivation will also be compared to the results of the welfare analysis. To do so a measure of deprivation is required. The study conducted by Hasse & Pratschke (2005) with subsequent revisions of results on 2008 is the most substantial study of deprivation and affluence levels in Ireland. A number of indicators are calculated in determining an overall level of deprivation and affluence in each region of the country and is the most comprehensive measure available in Ireland. Some of the data associated with the findings from that study is used as part of the research presented in this paper. This data extracted for use in this paper is explained in more detail in the methodology section.
3. Methodology
The dataset used in this paper is a sub section of the Irish Census of Population, 2006 tabulating individual trips to work, school and college. This dataset is named the place of work Census of anonymised records (POWCAR). It contains information on the trips of 1,834,472 individual in Ireland. This dataset is the most extensive travel behaviour dataset available in Ireland at present and is tabulated by the central Statistics Office (CSO). It also contains information on residential location, household composition and socio-economic groupings of each individual. As this paper is concerned with a potential cap on personal
travel emissions, a method for calculating individual’s annual emissions must be determined initially. Once this is calculated a cap can be set on emissions and a welfare analysis conducted.
6 Leitrim, Donegal, Cavan and Monaghan. The population of this region is 698,971 persons. The percentage of the population studied in each region is those who commute to work as tabulated in the POWCAR dataset. The population sample sizes for each region are presented in Table 1. The geographical spread of each region is illustrated in Figure 1. Aside from the rural-urban differential, the geographical size of each region differs significantly. The DMR is a small densely populated region with covering 921 km2, while the rural WBR is a much larger sprawling region covering 25,700 km2.
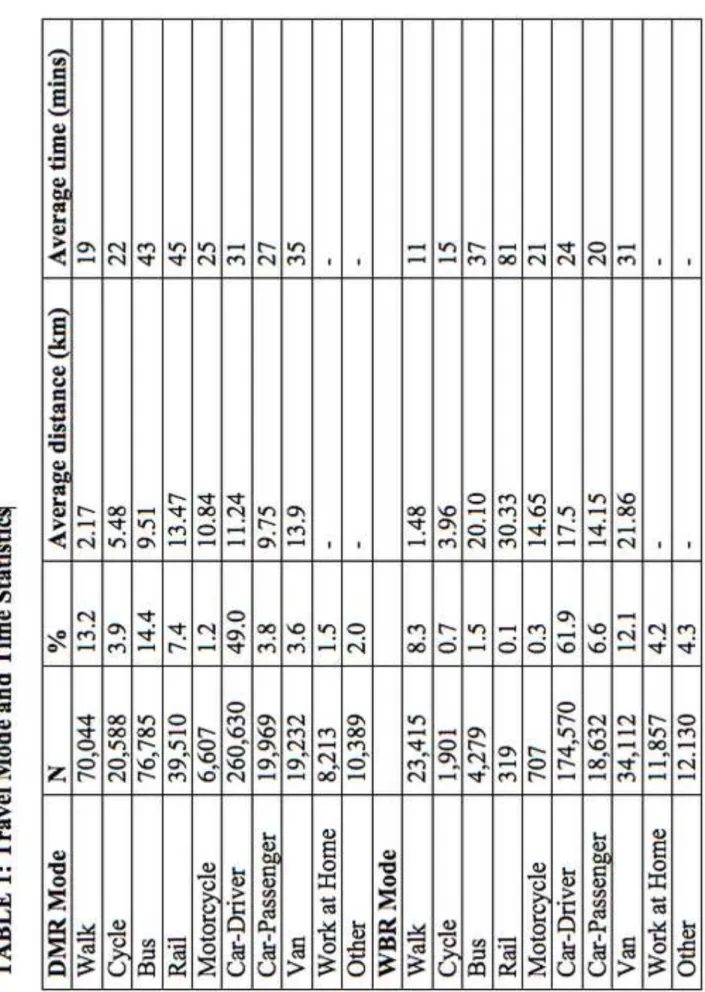
Table 1 presents some of the descriptive statistics associated with the various means of travel in each region. The major difference between the two regions is the very low percentage of commuters who use public transport in the WBR (1.6%) compared to the DMR (18.3%) while there is a heavy reliance on the motor car in both regions. The average distance covered by commuters by car is also much higher in the WBR while travel time is on average less than the DMR.
<<INSERT FIGURE 1: DMR and WBR Regions >>
<<INSERT TABLE 1: Travel Mode and Time Statistics >>
3.1 Emissions Estimation
To determine the cap the emissions associated with each individual’s daily trips must be calculated. Emission factors calculated in Walsh et al. (2008) and are used in this case as they are one of the most comprehensive studies on Irish emissions to date. These Irish emission factors are inclusive of an occupancy rate for the relevant modes of public transport and are measured in kilograms of CO2 per passenger kilometre. The following equation was used to
7 VKM is the total number of kilometres travelled by the mode of transport in question and EF is the emissions factor per kilometres travelled by that mode. This was then doubled to calculate the emissions for a return journey and multiplied by 215 to calculate annual emissions. This figure of 215 days is the average working year in Ireland. Average emissions can be calculated and a potential cap personal emissions set.
3.2 Setting the Cap
While determining the level of an actual cap would involve a number of considerations, the prospective cap level chosen in this case is based on the average national emissions calculations (McNamara and Caulfield, 2011). Average emissions for each commuter were found to be 2 kilograms of CO2 per trip. Table 2 presents sample size used in the study and
the percentage of commuters who would fall above and below a cap. Those above the cap emit more CO2 than the national average of 2kg per trip. Table 2 shows a much higher
percentage of commuters falling above this cap in the WBR than in DMR. This difference can be attributed to a higher percentage of individuals that use private cars to travel to work and the longer distances that they cover in the WBR.
<<INSERT TABLE 2: Percentage of Commuters over the cap >>
3.3 Welfare Analysis
This section outlines the calculation of the welfare model. In determining any welfare loss to commuters a consumer surplus (CS) analysis is used. Consumer surplus measures the difference between what a consumer is willing to pay and what is actually paid for a good. In this case the consumer good is CO2. Specifically the change in CS is measured based on
pre-cap and post-pre-cap scenarios. It is therefore a useful tool in determining the relative loss in CS between different groups as a way of determining welfare changes. This is a partial equilibrium analysis utilised in Wadud (2010) to determine the welfare loss based on gasoline consumption. In this case, as the policy is directly related to CO2 emissions, the levels of CO2
for each commuter are used instead of gasoline consumption. The equation to calculate the
8 Where P1 is the pre-policy price of travel and P2 the post-policy price. ΒPi is the price
elasticity of demand for travel and G1i is the consumption of CO2. If CS is found to be a
negative, a welfare loss has occurred and vice versa.
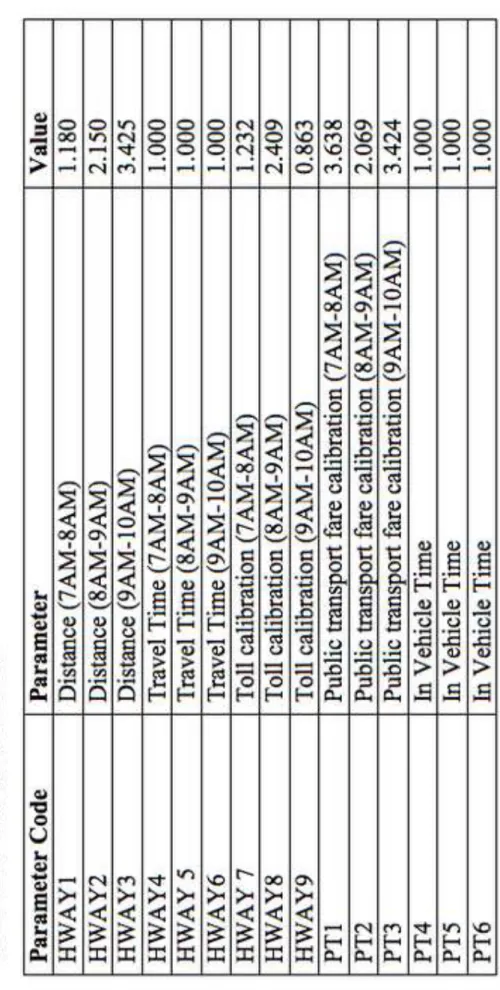
To determine the price of travel, cost equations are used to determine the cost of travelling by private vehicle and by public transport. Research carried out by the Irish National Transport Authority (NTA) has determined mode and departure time parameters for these cost equations and these parameters have been obtained for the purpose of this research. The parameters vary across three different time periods in which a commuter undertakes a trip: 7-8AM, 8-9AM and 9-10AM. Parameters are related to distance travelled, travel time and tolls occurring. The parameters used in the analysis are defined in Table 3.
<<INSERT TABLE 3: Travel Parameters >>
Private vehicle travel includes trip made by private cars and motorcycles. Public transport trips cover all Dublin Bus (urban bus service in Dublin), national bus services, tram lines, commuter rail and intercity rail trips in the two regions. Having defined the parameters required, these are then inputted into the cost equations to determine each individuals average trip cost. The cost equations utilised for travel by private vehicles and public transport are:
9 Public Transport (PT)
Distance is calculated in kilometres, trip time is calculated in minutes, PT fare is the cost of a public transport ticket and VOT is the value of time to commuters. The value of time is calculated by the NTA as 9.476 euro per hour in 2006 prices. Toll costs do not apply for commute trips in the rural WBR as no trips would have incurred a toll in this region at the time of the census (2006). Toll trips in the DMR are averaged at 0.23 euro per trip. The cost equations include for CO2 in the post-policy price of travel (P2). The price of carbon per trip
is determined using marketvalues.
3.3.1 Density of Population
The measures of welfare are also compared across different density levels of population to determine whether rural regions less well served by public transport will be adversely affected by the introduction of a cap. The levels of population density are split into deciles as a means of comparison. These deciles range from the most sparsely populated areas (Decile 1) to the most densely populated areas (Decile 10). The density deciles are tabulated in Table 4 below. These density deciles are linked to each individual in the POWCAR dataset based on electoral district they reside in that corresponds to the density levels calculates from the census.
<<INSERT TABLE 4: Density levels>>
3.3.2 Measure of Deprivation
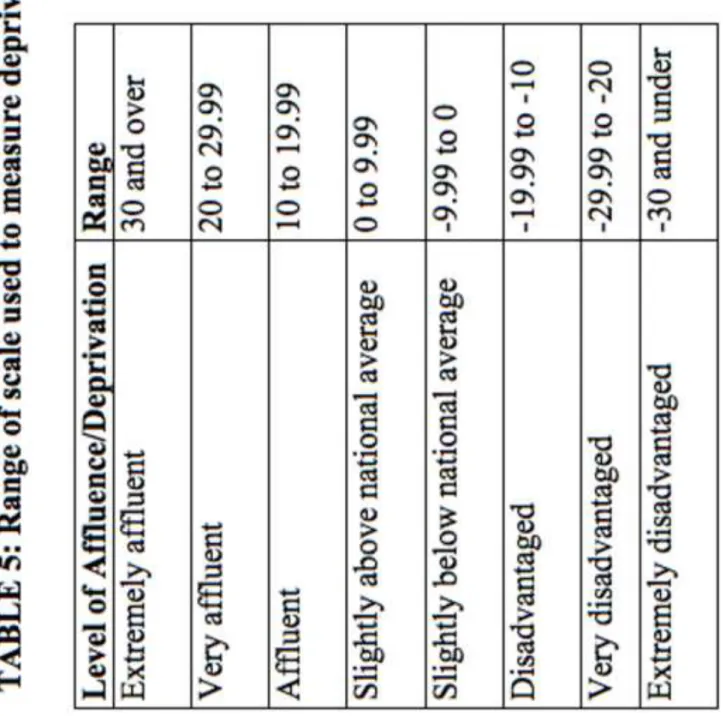
10 this study. The most recent results published by Hasse & Pratschke (2008, 2005) outlined in section 2.2 provide a detailed snapshot of the spatial distribution of deprivation in Ireland in 2006 and compares the changes in various economic and social indicators since 1991. One of the main measures of deprivation used in this study is the Relative Measure of Deprivation (RCFS) – A measure of deprivation relative to other regions with a mean of zero and standard deviation of ten. This measure calculates a score for each electoral district within the range presented in Table 5, which corresponds to a level of affluence or deprivation. This data is combined and matched to the electoral district code of each commuter in the POWCAR dataset to give a corresponding level of deprivation or affluence for each individual studied. A cross tabulation can then be used to observe any links between potential welfare outcomes and existing deprivation.
<<INSERT TABLE 5: Range of scale used to measure deprivation>>
The RCFS includes economic indicators such as unemployment rates, social indicators including age dependency ratios (number of people fewer than 15 or over 65) and levels of higher education. Demographic indicators are also included such as population changes and numbers of lone parents in each electoral district. These figures combine to provide a
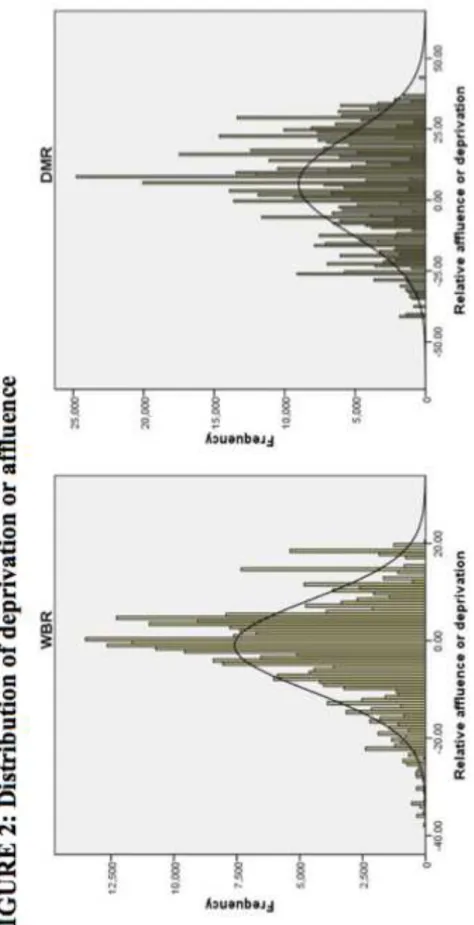
comprehensive ‘score’ of deprivation or affluence. The distribution of this score is presented
in Figure 2. While the data from the two regions roughly follows a normal distribution, the spread in the DMR is much greater than in the WBR with a standard deviation of 17 in the DMR compared to a standard deviation of 9 in the WBR. In terms of the average level of deprivation or affluence the mean score in the DMR is 5.65 compared to -0.97 in the WBR. These scores confirm that on average the DMR is more affluent than the national average while the WBR is more deprived than the national average.
<<INSERT FIGURE 2: Distribution of deprivation or affluence >>
4. Results
11 4.1 Cost Calculations
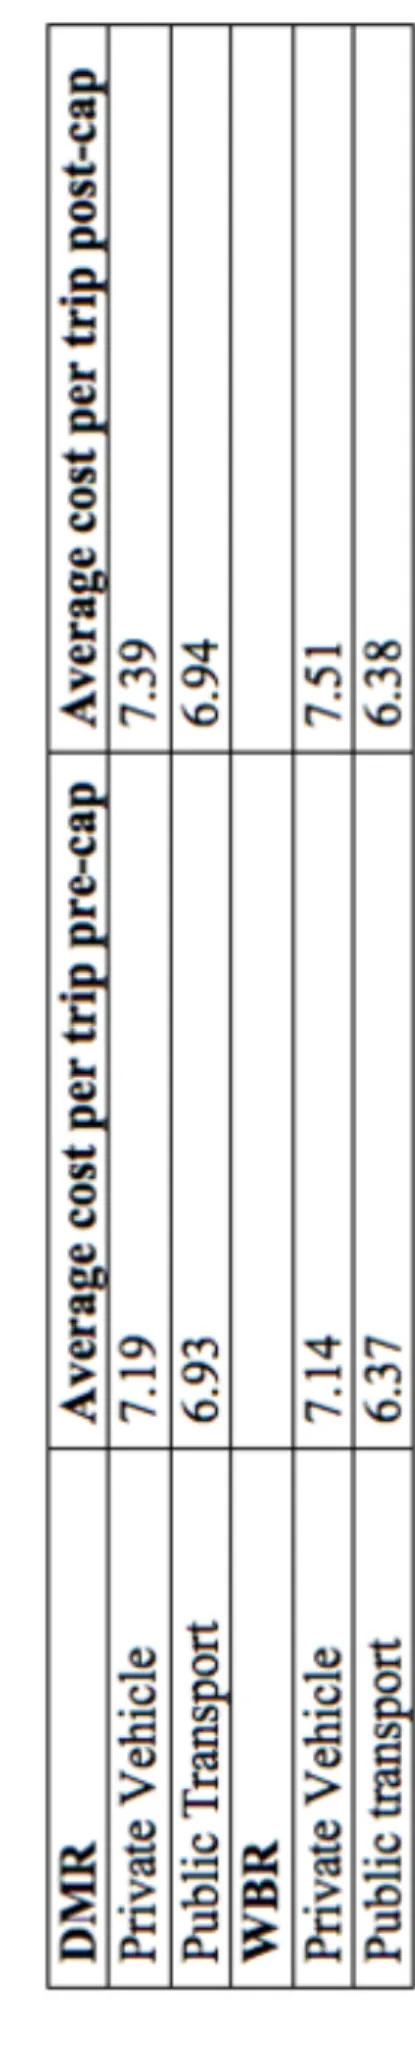
The cost calculations were determined using the cost equations presented in section 3.3. The results of which are presented in Table 6. Costs for travel by private vehicles are found to be slightly higher in the DMR at 7.19 euro per trip. Trips in the WBR are 7.14 euro per trip. Public transport trips on average cost more in the rural areas which one would expect due to the longer distances that people cover to travel to work. Once the cap is applied average trip costs increase only slightly for public transport trips in comparison with private vehicle trips, which increase significantly by 0.20 euro in the DMR and nearly 0.37 euro in the WBR.
<<INSERT TABLE 6: Travel cost calculations>>
4.2 Welfare Analysis
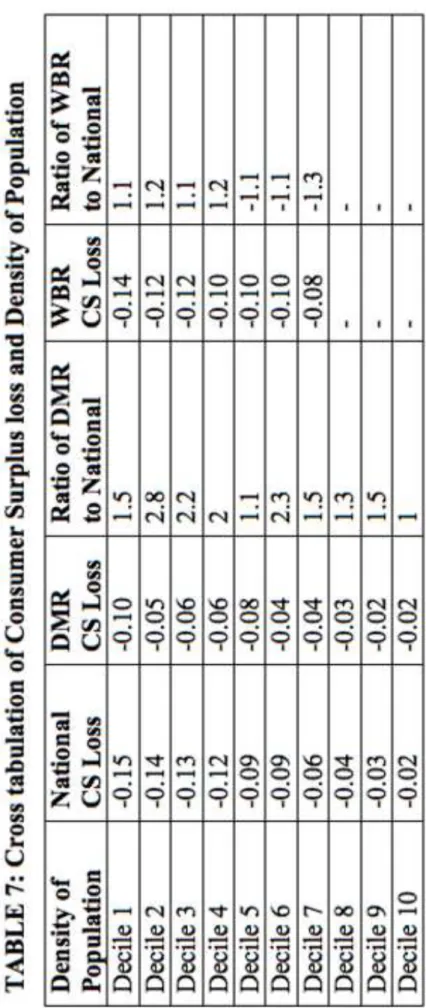
The welfare loss to individuals travelling to work can be measured using a consumer surplus analysis (see section 3.3). To determine whether rural commuters are affected more than urban commuters by the cap, the results are cross-tabulated against density deciles. The results are presented in Table 7. Decile 1 represents the population living in the most sparsely populated areas and Decile 10 represents the population living in the most densely populated areas. The results for each decile are all negative numbers indicating a shrinking of individual consumer surplus on average after the cap is introduced. The changes in CS are estimated for the DMR, WBR and a national change in CS.
These results demonstrate that as population density increases, CS loss also decreases. In lower deciles commuters in the WBR have a greater loss of CS compared to urban commuters in the DMR. Commuters living in sparsely populated areas will be worse off as a result of introducing cap on CO2. As population density increases rural commuters are found
12 <<INSERT TABLE 7: Cross tabulation of Consumer Surplus loss and Density of Population>>
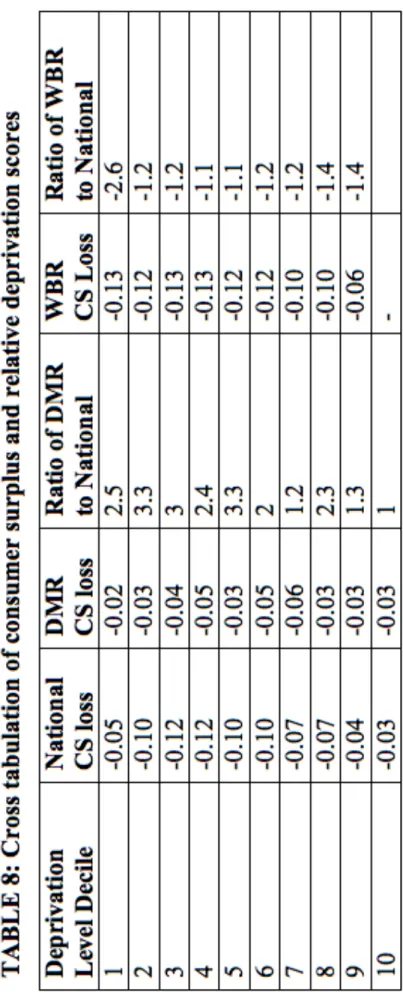
As this research is concerned with commute trips in isolation reflected in the CS loss, it is useful to compare these welfare losses against the measure of overall deprivation. The reason is to determine whether the spatial distribution of national deprivation is linked to that of the predicted welfare losses in the model. As was discussed in section 3.3.2, some of the most deprived districts in Ireland are rural areas, which Table 6 has shown experience a greater CS loss. One would expect therefore, a higher welfare loss in the most deprived areas. To test this hypothesis, the relative measure of deprivation variable (RCFS) was also divided into deciles. Decile 1 represents the most deprived areas and Decile 10 represents the most affluent areas.
<<INSERT TABLE 8: Cross tabulation of consumer surplus and relative deprivation
scores >>
The results in Table 8 reveal that the most deprived areas represented by the lower deciles will suffer a greater loss in consumer surplus compared to those commuters living in more affluent areas represented by the higher deciles, as one would expect. The only exception to this finding is Decile 1 in the DMR, which has the lowest CS loss of the ten deciles. The mitigating factor may be due to the fact that the most deprived areas in the DMR represented by this decile are generally inner city areas which would be well served by public transport. As was found in the density of population deciles, CS losses abate in the higher deciles. Most crucially welfare losses are generally higher in the rural WBR compared to both the national DMR averages as was the case when CS was cross-tabulated with density of population deciles. In comparing the ratios of each region to the national average, a clear divide emerges. Every decile of deprivation in the DMR is better off than the national average. Deciles 3 and 5 are found to be nearly three and a half times better off representing the largest disparity. In contrast each decile in the WBR is worse off than the national average. Individuals living in decile 1 are up to two and a half times worse off than the national average representing the largest disparity from the national average in the region.
cap-and-13 share scheme. A national cap would evidently lead to inequitable outcomes for rural commuters unable to switch to sustainable modes of transport.
5. Conclusions and Recommendations
This paper evaluated the welfare effects of introducing a cap-and-share scheme on the end users of transport in Ireland. In particular it focused on individuals who undertake daily commute trips. Questions relating to the complexities and administrative costs of introducing such a scheme are beyond the remit of this paper and its focus was solely on the potential effects of the scheme in the event of a cap being introduced. Two distinct regions were chosen as part of the analysis: the urbanised DMR and the rural WBR. These two regions were chosen as a means of comparing the welfare loss of rural commuters compared to urban commuters.
A consumer surplus calculation was used to determine this welfare loss using a partial equilibrium analysis based on daily individual emissions and the pre-policy and post-policy price of carbon. This consumer surplus loss was then compared across population density deciles in each region to determine whether the loss to commuters was greater in sparsely populated areas less well served by public transport. The results of this analysis showed that commuters in more sparsely populated areas in rural regions where worse off than commuters in the more densely populated urban areas as a result of introducing a cap. Moreover, the most deprived areas as measured on a scale of deprivation were found to bear a greater welfare loss as a result of introducing the scheme.
14 policies to compensate deprived areas must be introduced in tandem with any cap-and-share schemes to avoid the inequitable results presented in this paper.
Acknowledgements
The authors would like to thank the Central Statistics Office of Ireland and the National Transport Authority for providing the data for this study.
References
AEA ENERGY AND ENVIRONMENT. 2008. Cap and Share: Phase 1; policy options for reducing greenhouse gas emissions. Dublin: Sustainable Development Council, Ireland. BRAND, C. & PRESTON, J. M. 2010. ‘60-20 emission'--The unequal distribution of greenhouse gas emissions from personal, non-business travel in the UK. Transport Policy,
17, 9-19.
MARKET ADVISORY COMMITTEE TO THE CALIFORNIA AIR RESOURCES BOARD. 2007. Recommendations for Designing a Greenhouse Gas Cap-and-Trade System for California. California Air Resources Board, Sacramento, Calif.
CALLAN, T., LYONS, S., SCOTT, S., TOL, R. S. J. & VERDE, S. 2009. The distributional implications of a carbon tax in Ireland. Energy Policy, 37, 407-412.
CRAMTON, P. & KERR, S. 2002. Tradeable carbon permit auctions: How and why to auction not grandfather. Energy Policy, 30, 333-345.
ELLERMAN, A. D. 2000. Tradable Permits for Greenhouse Gas Emissions: A primer with particular reference to Europe. MIT Joint Program Report no. 69, Mass
ENVIRONMENTAL PROTECTION AGENCY. 2010. Ireland's Greenhouse Gas Emissions 2009, Environmental Protection Agency, Dublin, Ireland, 2008
FAWCETT, T. 2005. Investigating carbon rationing as a policy for reducing carbon dioxide emissions from UK household energy use. PhD. University College London.
FLEMING, D. 1997. Tradable Quotas: Using information technology to cap national carbon emissions. European Environment, 7, 139-148.
HAASE, T. & PRATSCHKE, J. (2005) Deprivation and its Spatial Articulation in the Republic of Ireland – New Measures of Deprivation based on the Census of Population,
1991, 1996 and 2002, Pobal, Dublin
15 MILLARD-BALL, A. 2008. Cap-and-Trade: Five Implications for Transportation Planners.
88th Annual Meeting of the Transportation Research Board. Washington D.C.
MILLARD-BALL, A. 2008 Municipal Mobility Manager: New Transportation Funding Stream from Carbon Trading? Transportation Research Record: Journal of the Transportation Research Board, No. 2079, Transportation Research Board of the National Academies, Washington, D.C., , pp. 53–61.
MCNAMARA, D. & CAULFIELD, B. 2011. Measuring the potential implications of introducing a cap and share scheme in Ireland to reduce green house gas emissions,
Transport Policy, In Press
NIEMEIER, D., GOULD, G., KARNER, A., HIXSON, M., BACHMANN, B., OKMA, C., LANG, Z. & HERES DEL VALLE, D. 2008. Rethinking downstream regulation: California's opportunity to engage households in reducing greenhouse gases. Energy Policy, 36, 3436-3447.
RAUX, C. & MARLOT, G. 2005 A system of tradable CO2 permits applied to fuel consumption by motorists.Transport Policy, 12, 255-265.
STARKEY, R. & ANDERSON, K. 2005. Domestic Tradable Quotas: A policy instrument for reducing greenhouse gas emissions from energy use. Tyndall Centre, Norwich, U.K. TIETENBERG, T. 2002. The tradable permits approach to protecting the commons: what have we learned. The drama of the commons, 197-232.
TOL, R.S.J., T. CALLAN, T. CONEFREY, J.D. FITZ GERALD, S. LYONS, L. MALAGUZZI VALERI and S. SCOTT. 2008. A Carbon Tax for Ireland, Working Paper 246, Economic and Social Research Institute, Dublin.
WADUD, Z., NOLAND, R. B. & GRAHAM, D. J. 2008. Equity analysis of personal tradable carbon permits for the road transport sector. Environmental Science & Policy, 11, 533-544.
WADUD, Z. 2010. Personal tradable carbon permits for road transport: Why, why not and who wins? Transportation Research Part A: Policy and Practice, In Press, Corrected Proof. WALSH, C., JAKEMAN, P., MOLES, R. & O'REGAN, B. 2008. A comparison of carbon dioxide emissions associated with motorised transport modes and cycling in Ireland.
Figure 1
Table 4