Cite this paper as follows:
O’Kelly B.C., 2008. Development of a large consolidometer-permeameter apparatus for testing soft soils, Proceedings, ASCE GeoCongress on the Challenge of
Development of a Large Consolidometer-Permeameter Apparatus for Testing Soft Soils
Brendan C. O’Kelly1 1
Lecturer in Civil Engineering, Department of Civil, Structural and Environmental Engineering, Museum Building, Trinity College Dublin, Dublin 2, Ireland; [email protected]
ABSTRACT: The development of a large consolidometer-permeameter apparatus
(CPA) to measure the 1-D compressibility and hydraulic conductivity k, value of soft soils, and in particular peat material, over low to medium stress levels is presented. The k value is measured directly under low Reynolds Number flow conditions. Proving tests conducted on undisturbed Sphagnum peat showed that test specimens (250–280 mm in length; 152-mm in diameter; aspect ratio of 1:0.5–1:0.6), which had been fitted with a lubricated membrane in the CPA floating-ring setup, experienced practically identical levels of compressibility as recorded over the same stress range by a conventional oedometer apparatus (aspect ratio of 1:4.0). However, the advantage of the CPA is that the k values measured are for a larger specimen size (mini-structural scale), which is more representative of field conditions.
1. INTRODUCTION
Peat is an inherently heterogeneous, anisotropic, low shear strength material, which is highly compressible with a typical hydraulic conductivity k, value of 10-6 to 10-7 m/s reported from field measurements on Sphagnum peat (H3–H6 on von Post scale) by
Hobbs (1986). Relatively small applied loads, e.g. due to roadway construction, cause significant ongoing settlement of peat deposits, and hence reductions in k values, which can significantly affect the natural groundwater flow regime.
The paper presents the development of a large consolidometer-permeability apparatus (CPA) to measure the 1-D compressibility and k value of undisturbed, soft structured soils, and in particular peat material, over low to medium stress levels ( v' ≤ 50 kPa).
The new apparatus contains a larger specimen (nominally 152 mm in diameter and 250–280 mm in length, which is mini-structural scale) that is more representative of the insitu deposit. The k value of the peat is measured directly at low Renyolds Number flow (laminar) conditions for which Darcy’s Law has been shown to be valid (Hemond and Goldman, 1985), and once again the longer flow path through the CPA test specimen is on the mini-structural scale level. Proving tests that were conducted on peat using fixed and floating-ring cells in the CPA, and conventional oedometer apparatus, are compared.
2. CONSOLIDOMETER-PERMEAMETER APPARATUS (CPA)
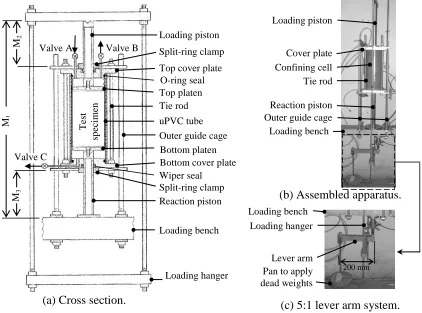
Figure 1 shows the new CPA. The confining cell comprises commercially-available uPVC tube (152-mm (6”) inner diameter and 400-mm in length), which is sealed at both ends by square, aluminium cover plates that are bolted together by four 12-mm diameter, stainless steel, tie rods. The 20-mm-deep boss on the cover plates includes a rubber O-ring seal that push fits inside the end of the uPVC tube.
(b) Assembled apparatus.
[image:3.612.97.519.330.643.2](c) 5:1 lever arm system.
FIG. 1. New consolidometer-permeameter apparatus.
The 5-mm thick, perforated, aluminium, top and bottom platens comfortably fit inside the uPVC tube (even gap of about 2 mm between the platen rim and the inner tube surface) and are set up in contact with the ends of the test specimen. The hollow,
200 mm
Loading piston
Cover plate Confining cell Tie rod
Loading hanger
(a) Cross section.
Split-ring clamp Loading piston
Outer guide cage uPVC tube Top cover plate
Tie rod Top platen
Reaction piston Wiper seal
Loading bench Valve A Valve B
M
1
M
2
M3 Valve C
T
est
sp
ec
im
en
Bottom cover plate O-ring seal
Bottom platen Split-ring clamp
Reaction piston Outer guide cage Loading bench
Loading bench Loading hanger
stainless steel loading and reaction pistons (each 300-mm in length) are connected to the top and bottom platens, respectively. The wiper seals, located in both cover plates, seal the entry to the cell of the 40-mm diameter pistons. The vertical movement of the floating-ring cell is guided by an outer cage, which comprises four vertical steel bars, each 15-mm in diameter, that are bolted to the loading bench. Split-ring clamps locate around the pistons. Two loading mechanisms can be used, depending on the applied stress range required: (i) a rectangular loading hanger and dead weights ( v < 10 kPa),
and (ii) a 5:1 lever-arm system used when higher stresses must be applied. A seating stress as low as 0.5 kPa (due to the deadweight alone of the loading piston and platen) can be applied at the top of the specimen. Three displacement transducers record the overall specimen compression (M1), and the relative movements between the loading
platens and the cell ends (M2 and M3), during the loading stages. A constant-head water
reservoir (located 1.15 m above the bottom platen) generates an hydraulic gradient of between four and five, and hence low Renyolds Number (laminar) flow conditions across the specimen. Water enters and exits the cell via on/off valves A, B and C located in the top and bottom cover plates. Standpipes can be connected to manometer tappings thought the wall thickness of the uPVC tube (tappings are equi-spaced at 45-mm centres along the lower half of the tube) to measure the head loss, and hence the hydraulic gradient, which acts locally along the specimen length.
3. PROVING TESTS 3.1 Test Material
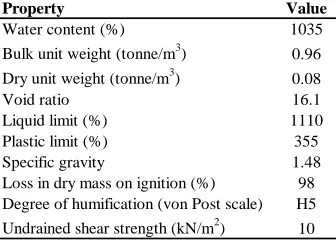
[image:4.612.221.389.523.643.2]The test material was a very soft, moderately decomposed, fine fibrous peat. Undisturbed samples of the H5 Sphagnum peat (Table 1) were taken from a blanket bog at a depth of about 1.0-m below the ground surface (groundwater level was coincident with the ground surface, hence saturated conditions) by pushing the 400-mm long uPVC tube into the soft ground. The thin wall and sharp cutting edge of the uPVC tube limited the preloading of the cores during sampling. The tube containing the sample was subsequently excavated and its ends sealed, before being transport to the geotechnical laboratory. The material properties in Table 1 were determined in accordance with BS1377 (1990).
Table 1. Some properties of the peat material
Property Value
Water content (%) 1035
Bulk unit weight (tonne/m3) 0.96
Dry unit weight (tonne/m3) 0.08
Void ratio 16.1
Liquid limit (%) 1110
Plastic limit (%) 355
Specific gravity 1.48
Loss in dry mass on ignition (%) 98
Degree of humification (von Post scale) H5
Undrained shear strength (kN/m2) 10
3.2 Specimen Preparation
During one of the proving tests, the specimen was separated from the inner wall surface of the uPVC tube by low density polyethylene cling-film (about 10–11 microns in thickness), which was saturated in oil in order to reduce the side-wall friction, and in this case the manometer standpipes were not fitted to the cell body. After extruding the specimen fully from the uPVC tube (the fibrous peat material was stiff enough to stand unsupported), the wall surface of the specimen was wrapped in three layers of cling film. The specimen was carefully guided back into the uPVC tube after oil had been generously smeared over the inner surface of the tube. The membrane protruded beyond the top end of the specimen and was clamped between the top end of the tube and the top cover plate to prevent water seepage along the inner wall of the tube. The membrane protrusion was sufficient to accommodate the anticipated cell and specimen movements.
3.3 Assembly of the Apparatus
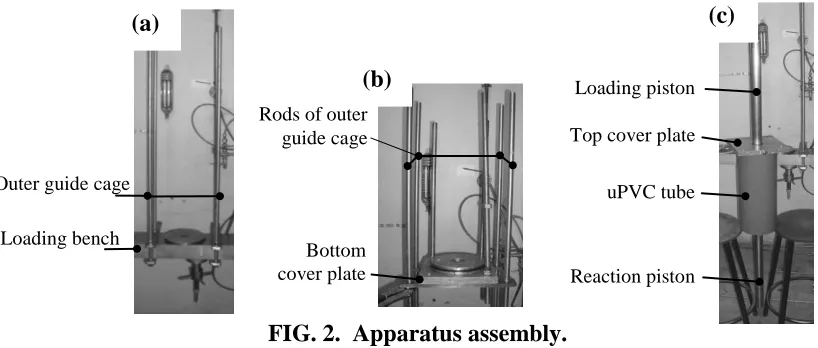
[image:5.612.97.506.437.611.2]The stages in the assembly of the CPA are shown in Fig. 2. The outer guide cage was bolted to the loading bench (Fig. 2a), and the bottom cover plate was located and temporarily clamped in position (Fig. 2b). With the uPVC tube resting upright on a flat working surface, the reaction platen was guided down into the tube to contact against the bottom end of the test specimen. The system was then carefully inverted after which the top platen assembly was guided inside the other end of the tube to contact the top end of the specimen (Fig. 2c). A layer of clean, uniform sand (about 5-mm in thickness) separated the specimen ends from the top and bottom platens. A fine wire screen prevented the sand from falling through the perforations in the bottom reaction platen. The assembly in Fig. 2c was located around the outer cage, and guided by the top cover plate, was lowered into position above the bottom cover plate. The cell was sealed by bolting the two cover plates together using the four tie rods.
FIG. 2. Apparatus assembly.
The top and bottom pistons were locked in position using the split-ring clamps before the loading system was brought in contact with the top loading-piston. The water from the constant-head reservoir was allowed to enter the cell via valve A in the top cover plate (Fig. 1a) in order to bleed any air, which may have been contained in the void above the specimen, via valve B. The water was then allowed to permeate downward through the specimen in order to saturate it and the cell itself, with the effluent exiting to atmosphere via valve C in the cell base.
(a)
(b)
(c)
Outer guide cage
Loading bench
Rods of outer guide cage
Bottom cover plate
Loading piston
Top cover plate
uPVC tube
3.4 Experimental Method
3.4.1 Loading Stages
A series of maintained-load compression tests were conducted on a pair of specimens, 280 and 250-mm in length using fixed and floating-ring cells, respectively, in the CPA. A conventional oedometer test (fixed-ring cell) was also conducted on a specimen (76.2-mm in diameter and 19.0-mm in length) as a basis for comparing the compressibility response measured in the CPA set-ups. All of the tests were conducted in a temperature-controlled environment, at an ambient temperature of 20oC.
The specimens were loaded in the CPA by releasing the piston clamps. The clamps were released from both pistons in the case of the floating-ring cell so that the uPVC tube could move relative to both platens. The uPVC tube and the reaction platen remained clamped together in the case of the fixed-ring cell. Only the floating-ring test incorporated the lubricated membrane wrapped around the specimen wall surface. Valve A and the valves on the manometer tappings were closed. Valves B and C in the cover plates (Fig. 1a) were opened to allow both ends of the specimen to drain freely to atmosphere. A stress increment ratio of unity was adopted and each load stage was about three to four days in duration. The displacements M1, M2 and M3 (Fig. 1a) were
regularly recorded during the load stages.
3.4.2 Hydraulic Conductivity
Constant head permeability tests were conducted over a period of about four to five days at the end of each load stage. The split ring clamps on both of the loading pistons were secured during the hydraulic conductivity tests so that the specimen height, and hence the void ratio, remained constant. Valve A, which leads from the constant head reservoir, and valve C through the cell base (Fig. 1a), were both opened to allow vertical downward flow to occur, and the permeant volume was regularly determined by measuring the permeant mass that had collected in a graduated cylinder over successive time periods. Steady flow rate conditions were allowed to establish. The hydraulic conductivity tests were terminated after successive measurements yielded consistent k values. The bleed valve B, located in the top cover plate, was opened before the start of the hydraulic conductivity test to release any biogas that may have been generated in the intervening time period by the peat specimen itself. Leakage through preferential flow paths along the sidewall was not significant since the very soft peat material (undrained shear strength of 10 kPa) sealed against the inner wall of the uPVC tube. Finally, the cell was disassembled following the final permeability test and the specimen was removed, subdivided and tested in order to determine the distribution of water content and unit weight over its length.
4. EXPERIMENTAL RESULTS AND ANALYSIS
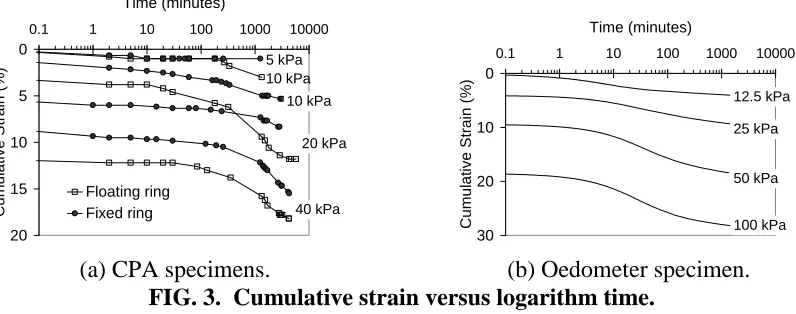
experienced practically identical strains of about 18.2% under v' = 40 kPa, indicating
that side wall friction had similar effects overall, whereas the fixed-ring CPA specimen experienced a slightly smaller 15.5% strain under the same applied stress (effects of side wall friction were greater). The initial specimen compression recorded at the start of the different load stages were negligible indicating, for practical purposes, that the peat specimens had been in a fully saturated condition.
0
5
10
15
20
0.1 1 10 100 1000 10000
Time (minutes) Cum u lative S train (%) Floating ring Fixed ring 10 kPa 20 kPa 40 kPa 10 kPa 5 kPa 0 10 20 30
0.1 1 10 100 1000 10000
Time (minutes) Cum u lative S train
(%) 12.5 kPa
25 kPa
50 kPa
100 kPa
(a) CPA specimens. (b) Oedometer specimen.
FIG. 3. Cumulative strain versus logarithm time.
Figure 4 shows the relative displacements (M2 and M3, Fig 1a) that were recorded
between the ends of the CPA floating-ring cell and the top and bottom platens, respectively. Assuming that the specimens were homogeneous, and that the cell had not slipped under gravity, then the displacements M2 and M3 would have been expected to
be similar, and equal in magnitude to M1/2 (Fig. 5). However, the actual slippage that
occurred for the floating-ring cell by the end of the 40-kPa load stage corresponded to a relative downward movement at the specimen mid-height of about 8% of the cumulative strain. 0 5 10 15 20 25 30
1 10 100 1,000 10,000
Time (minutes) Di spla cemen t (m m )
[image:7.612.105.503.172.329.2]M2 (top end) M3 (bottom end) Mean 10 kPa 20 kPa 40 kPa Slippage floating ring
FIG. 4. Maintained-load compression using CPA floating-ring cell.
Figure 6 shows the unit weights and the reductions in the water content achieved across the length of the CPA specimens for v' = 40 kPa. As expected, a more uniform
water content value were achieved near the top end rather than the bottom end of the specimen.
Figure 7 shows the k values that were calculated using Darcy’s equation (1) for the steady flow conditions, established following each load stage.
k = Q.L/ H.A.t (1)
[image:8.612.193.403.204.367.2]where Q is the volume of water that flowed though the specimen cross-section over a given period of time, t; A is the cross-sectional area (181.5 cm2), and H is the loss in the hydraulic head that occurred across the specimen length, L.
[image:8.612.210.378.585.694.2]FIG. 5. Displacement measurements in CPA floating-ring cell.
FIG. 6. Non-uniformity of specimen compression.
1.E-09 1.E-08 1.E-07 1.E-06
0 500 1000 1500 2000 2500 Time (minutes)
Hy
d
ra
u
lic co
n
d
u
ctivi
ty (m
/s)
10 kPa 20 kPa 40 kPa
Effective stress
FIG. 7. Constant head permeability tests in CPA floating-ring cell.
Reduction in Water Content (%)
S
p
ec
ime
n
Len
g
th
x
2
x
2
x
2
x
x
2
0
x
2
x
2 0
Specimen compression
CELL
DISPLACEMENT RELATIVE
The void ratio and k values are plotted against the effective stress in Fig. 8. The strain response and hence the compressibility of the CPA floating-ring and conventional oedometer specimens were similar (Fig. 3) with primary compression index Cc, values
of 4.5 and 5.0, respectively, and primary compression ratio Cc* = (Cc/1+eo) values of
0.26 and 0.29, respectively. However, the same material when tested in the CPA fixed-ring cell experienced a lower compressibility (Cc 3.5, and Cc* 0.20) with the
error again arising mainly due to the greater affects of sidewall friction. Lambe (1951) reported that the sidewall friction in fixed-ring cells was twice that in floating-ring cells. The k values, which reduced significantly with relatively small increases in effective stress (characteristic inverse relationship on log-log plot, Fig. 8), were consistent with the field measurements of typically 10-6 to 10-7 m/s reported for similar material by Hobbs (1986).
10 12 14 16 18 20
1 10 100
Effective stress (kPa)
Vo
id Ra
tio
1E-10 1E-09 1E-08 1E-07 1E-06
Hy
d
ra
u
lic co
n
d
u
ctivi
ty
(m
/s)
Oedometer Void ratio (CPA fixed ring) Void ratio (CPA floating ring) Permeability (CPA floating ring)
FIG. 8. Void ratio and hydraulic conductivity versus effective stress.
5. SUMMARY AND CONCLUSIONS
The development and assembly of a large consolidometer-permeability apparatus (CPA) to measure the 1-D compressibility and hydraulic conductivity k, value of soft soils over low to medium stress levels has been presented. Proving tests on undisturbed Sphagnum peat showed that a test specimen (250-mm in length, 152-mm in diameter, and an aspect ratio of 1:0.54 to 1:0.61), which had been fitted with a lubricated cling-film membrane in the CPA floating-ring cell, experienced practically identical levels of compressibility as occurred over the same stress range in the conventional oedometer consolidation apparatus. However, the advantage of the CPA is that the larger test specimen size (mini-structural scale) is more representative of the inherently heterogeneous and anisotropic peat deposit. The k values, which were measured in the CPA using constant-head permeability tests, were consistent with field measurement values reported in the literature.
6. REFERENCES
BS1377 (1990). Methods of test for soils for civil engineering purposes, British Standards Institution, London.
Hemond, H.F., and Goldman, J.C. (1985). “On non-Darcian water flow in peat.” J. of Ecology, 73: 579–584.
Hobbs, N.B. (1986). “Mire morphology and the properties and behavior of some British and foreign peats.” Quarterly J. of Engrg. Geology, 19 (1): 7–80.