Czech consumers’ attitudes to food waste
Michaela Macková, Naďa Hazuchová*, Jana Stávková
Department of Marketing and Trade, Faculty of Business and Economics, Mendel University in Brno, Brno, Czech Republic
*Corresponding author: nada.hazuchova@mendelu.cz
Citation: Macková M., Hazuchová N., Stávková J. (2019): Czech consumers’ attitudes to food waste. Agricultural Economics – Czech, 65: 314–321.
Abstract: The paper deals with Czech households’ subjective views on food waste. It examines households’ attitudes to food waste, including the causes of food waste. The primary data were obtained via a questionnaire survey with 1 582 respondents. The analyses allowed the identification of three categories of Czech households with different attitudes to food waste and its causes. These findings provide a basis for a proper selection of corrective measures aimed at amending or even completely transforming the current behaviour.
Keywords: attitudes to waste; causes of waste; consumer behaviour; food loss; segmentation
Food loss and waste are grave global problems. Food loss occurs at all stages of the food chain – pro-duction, harvest, processing, distribution, and con-sumption. In developing and low-income countries, most losses occur at production and harvest stages. In developed countries, the problems of food loss and waste lie primarily in consumers’ behaviour. The point is that in these countries, people can afford to waste their food. High disposable income and affordable food prices reduce the share of income spent on food prod-ucts and thus contribute to food wastage. This trend is also supported by sociological factors, specifically by the shift in a typical family/household structure, as well as factors related to changes in lifestyle. Food waste is not just a big economic and ethical problem. It also leads to higher raw material consumption and long-term depletion of our planet’s resources (Borma 2017). The European Agency for the Environment (2016) highlighted the amount of ethane created by dumped food and the fact that the ethane also contributes to cli-mate change. All actors in the food chain are able to effectively tackle the process of wastage (European Commission 2018). The focus on this problem is also one of the objectives of the European plans – to halve the amount of food waste by 2030.
There are various definitions of food loss and food waste. Gustavsson et al. (2011) emphasizes the need
of the term definitions and distinguishes between the following concepts: food loss which occurs at the levels of production, harvest, and processing and food waste which occurs at the levels of trade and consumption. Food waste is a characteristic prob-lem in developed countries. WRAP’s (2014) study defines three different categories in terms of food waste. Avoidable food waste – it includes food and bev-erages that are commonly consumed or thrown away in case the consumer does not eat/drink them; pos-sibly avoidable waste – this category includes food that some people consume and others do not (such as fruit peel); and unavoidable food waste – food or drink that is not edible under normal circum-stances (e.g. meat bones). Tostivint et al. (2016) add that food waste also includes food and inedible parts of food that have been removed from the food chain for recycling or disposal. Wasting these products has negative environmental impacts.
of in individual households and sorting and deter-mining the weight of food waste in landfills, it is also possible to use statistical models. The models can be applied to population metabolism and body weight, shares of total calories consumed, or shares of total food consumed. Given the absence of a com-mon methodology, it is not possible to decide which of the estimated values can be considered relevant.
Most estimates identify consumers as the main producers of food waste. Monier et al. (2011) es-timated the average annual food waste per the EU inhabitant to 179 kg, in terms of the household it was 76 kg per household member.
In the Czech Republic, there are many activists who try to draw attention to the issue of food waste. The questionnaire survey conducted by the Euro-pean Court of Auditors (2017) identified two groups of Czech consumers who waste food the least – people older than 60 years and people whose households’ income does not exceed 508 EUR per month. In the Czech Republic, the research on food waste is at its early stage, and it is, therefore, necessary to ap-proach the issue comprehensively with the necessary scientific erudition. We need to identify the causes of food waste and seek ways, suggestions, and rec-ommendations for food waste reduction. Within the initial research phase, we need to focus on food waste in more detail and identify factors that cause the population to waste its food and to define pos-sible preventive measures. The issue of food waste has aroused both political and public interest and the importance of addressing it is growing.
Thanks to the efforts of the European Economic and Social Committee (EESC), the issue of preventing and reducing food waste has been added as one of the European Parliament’s political agendas. The EESC formulated the need for a common methodology for objectification and quantification of food waste. Special attention should be paid to research on all the links in the food chain. In developed countries, the greatest share of food losses occurs in the final consumption stage. Therefore, the main effort must be made in the fields of education and communica-tion with consumers. The efficiency of such com-munication depends on the knowledge of consumers’ attitudes to food waste.
The aim of this paper is to identify subjective at-titudes to food waste, together with individuals’ con-scious reasons for wasting food. The authors also aim to identify consumer groups who have consciously or unconsciously positive attitudes to food waste
and find ways how to efficiently address and edu-cate these groups. Knowledge of attitudes and causes of food waste is also a prerequisite for the prepara-tion of methodology for monitoring the quantity and structure of wasted food.
MATERIAL AND METHODS
The aim of the paper is to find the causes of food waste, as well as to evaluate Czech households’ attitudes to food waste. The questionnaire survey was primarily aimed at information on food purchasing habits, at-titudes to food waste, causes of food waste, and most commonly wasted food products, including estimates of waste amounts.
The survey had 1 582 respondents. It was conducted in late October and early November 2017. The ques-tionnaire consisted of 21 questions related to food waste and 9 identifying questions. Respondents’ atti-tudes and opinions were evaluated on a 10-point scale where 1 meant “I absolutely disagree” and 10 “I fully agree”. Table 1 shows the respondent structure based on identification data.
The results of the survey were processed by the use of descriptive statistics. The authors also employed the cluster analysis in order to make it possible to ef-ficiently address respondents in future via the creation of opinion-homogeneous groups.
Table 1. Respondent sample structure
Identification Absolute frequency Relative frequency (%)
Sex female 973 61.50
male 609 38.50
Age (year)
18–29 266 16.81
30–49 735 46.46
50–64 361 22.82
65 and more 220 13.91
Highest qualification
elementary school 32 2.02
secondary education, no high school degree 211 13.34 secondary education high school degree 697 44.06
higher education qualification 78 4.93
university education 564 35.65
Household members
I live alone 209 11.72
I live with my parents 203 11.39
I live with my partner 276 15.48
I live with my husband/wife 294 16.49
I live with my partner and my children 112 6.28 I live with my husband/wife and my children 484 27.15
I live with my siblings 74 4.15
I live with a friend 77 4.32
I live with someone else 54 3.03
Children living in the household
0 1 107 69.97
1 225 14.22
2 199 12.58
3 37 2.34
4 or more 14 0.88
Economic activity
employee 911 57.59
farmer 5 0.32
private entrepreneur 148 9.36
pensioner 248 15.68
unemployed 9 0.57
student 198 12.52
maternity leave 39 2.47
other 24 1.52
Income evaluation
insufficient (household depends on state contributions or
short-term bank loans, its monthly income is not sufficient) 11 0.70 low (household’s income covers its basic needs only, they
need to cut down on expenses) 140 8.85
average (household’s basic needs, i.e. food, housing,
cloth-ing, are fully covered) 551 34.83
satisfactory (household’s income covers all its needs
within a reasonable scope) 788 49.81
high (household can afford larger investments and luxury
goods) 92 5.82
Municipality of residence
less than 2 999 inhabitants 530 33.50
3 000–89 999 inhabitants 566 35.78
90 000 or more inhabitants 486 30.72
This analysis is performed through a cross-section analysis. Dependencies are determined by the use of Cramer coefficient. Statistical variables’ critical value was set to 0.7 for coefficients and 0.05 for the significance level.
Data processing was performed by the use of SPSS Statistics and Statistica by StatSoft.
RESULTS AND DISCUSSION
The survey showed that the average Czech consumer bought food regularly (about 80% of respondents), while the same percentage of consumers did their shopping after some kind of preparations (they checked the food they had in their refrigerators, pantries). A smaller percentage of respondents said they went shopping less frequently and bought larger amounts of food products. Thus, we can assume that food purchases do not bother consumers and that frequent shop visits suit consumers as they can, for example, take advantage of other occasional offers/sales.
The marketing tool for discount offers was per-ceived as an important decision-making factor. Al-most 70% of respondents said they bought special offer products even if they did not need them.This finding points at one of the possible causes of food waste. The question of whether consumers planned their purchases in order to prevent food waste showed that most consumers did not think of food waste at all. However, more than 75% of respondents said they consumed all purchased food products. We need to ex-amine what do the consumers mean by “consuming all food products” (taking into account the responses to buying special offer goods).
Food waste was considered an important prob-lem by a vast majority of respondents (almost 90%) while the same percentage of respondents thought food waste represented a threat to society. Despite this, respondents admitted they were wasting their food. The most frequent reason for wasting food was food spoilage during storage (65% of respondents), followed by expirations of “use by” or “best before” terms. The other reasons were (sorted by frequencies): we cooked too much food, we did not like the food, the packaging was damaged, I did not like the food product’s appearance when I brought it home.
The most frequently wasted products were baked goods (half of the respondents reported they wast-ed bakery products), followwast-ed by vegetables, fruits, and dairy products. A significantly lower share of re-spondents reported they were wasting home-made
meals, meat products (20%), raw meat (8%), food from restaurants, preserves and cans, and other types of food. These results are shown in Figure 1.
Respondents were also asked to total their total weekly food waste. 55% of respondents said they threw away 51–500 g of food per week, 15% of respondents said they threw away 50 g of food per week, and a similar share of respondents said they threw away 501–1 000 g of food per week. Less than 10% of re-spondents said they threw away 1 001–1 500 g of food per week. The remaining 5% of respondents reported they threw away more than 1 500 g of food per week. With respect to individual family members (father, mother, children, parents), the survey showed that all family members’ shares in food waste amount were about the same.
The most frequent answers to questions on attitudes to food wastage were:
– I think that food waste should be more widely spoken and written about in the media.
– We would appreciate more information on the pos-sibilities of reducing food waste.
– If somebody grows crops or breeds animals, their attitude to food changes.
– I have heard about the food bank, but I would need more information.
– It is necessary to explain the “use by” and “best before” terms better.
– I am familiar with the negative impacts of food waste on the environment.
648 respondents claim that they can explain the dif-ferences between "use by" and "best before" dates; 218 respondents admit they throw away the food which "best before" date has expired (yet the food is still edible). This can be caused by the ignorance of the term meanings.
Many respondents also said they had not heard about the food bank’s public collections and that they were not interested in the issue of food waste. These opinions were held by 10–20% of respondents. The insufficient awareness of the food bank’s activities was also evident from the survey results. Only 17% of respondents have donated food to the food bank, 67% said they were willing to do so, almost 30% said they would not donate anything, and the remaining 3% were undecided respondents.
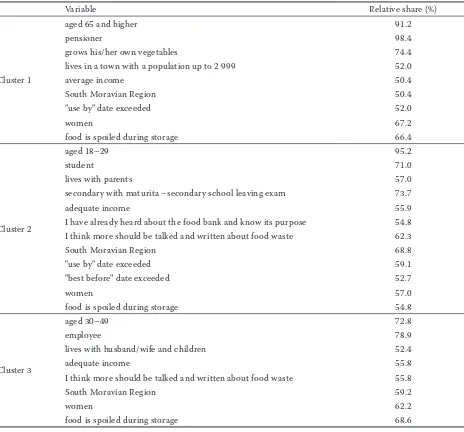
An effective solution would require targeted address-ing of individual population segments, not across-the-board campaigns. Based on the results of the survey of food waste causes and attitudes to food waste, an identification-feature-based cluster analysis was performed.The analysis resulted in the creation of three separate segments (clusters) shown in Table 2.
Cluster 1. Segment of “unintentional food economisers”
This segment mostly consists of women; 91% of the segment is people aged 65 and more; one-third of the segment members live alone; about half of the segment members are married. The most common educational background in the segment is primary or secondary school; segment members are mainly retired persons. 25% of the segment members find their incomes insufficient; another 30% considered their incomes sufficient to meet their basic needs; the remaining said their income was sufficient. Most of the segment members live in municipalities with up to 3 000 inhabitants.
They do not distinguish between “use by” and “best before” terms, and they did not report any causes of wastage, i.e. they do not waste their food. They do
not know much about food waste; they do not follow nor are interested in advertisements or publications on food waste. They are generally aware of the harmful impacts of food waste on the environment, yet they did not mention any specific impacts. About 20% of the segment members are aware of the food bank. This segment is identifiable; its members do not waste their food, which is given by their education and life experiences. Their behaviour can be described as un-conscious non-wasting. It is not necessary to address this segment, nor to seek a change of its behaviour – it would be counter-productive and probably even unachievable.
Cluster 2. Segment of respondents “affected by systematic education since primary school”
The segment consists both of men and women; most of the members (almost 95%) belong to the young generation, i.e. the age group of 18–29 years. Most of the segment members have secondary education; they mostly live with their parents or siblings, a certain number of them live with their friends or as single individuals. The vast majority of the segment members are students, and thus they cannot judge their income situations (they consider their incomes average,
cover-17.42 14.83 0.73
0 25 10 15 20
8.02 2.28
0.44 0.31 0.27 0.15 0.93
1.95
11.18 2.65
0.97
Fruit
Percentage (%) Vegetable
Dairy products Butter Meat products Meat (raw) Fish (raw) Bakery products Pasta (not heated) Rice (not heated) Legumes (not heated) Cans Preserves Home prepared meals Purchased ready meals Other
(salami, sausages)
19.05
[image:5.595.67.530.92.394.2]18.81
Figure 1. Food products most co-mmonly wasted by households
ing all their needs). They are not characterised by a typical size of their municipality of residence – they live both in smaller towns and cities.
As the main causes of food waste, this segment reports the “use by” and “best before” terms, fol-lowed by food spoilage or quality loss, and the fact that they do not like the food. These are also reasons to throw food away. Some of the segment members are aware of the connection between food waste and the environment, as well as the issue of food waste (they learned about it through advertisements, articles, or the internet). They recognise that the issue should be discussed more. We can say this segment is aware of the problem of food waste, is interested in it, and
would appreciate more information about it. This is the segment that should be addressed. The com-munication should be systematic and incorporated in compulsory education. Well-prepared communica-tion/education would be very effective in this segment.
Cluster 3. Segment of consumers who need “re-education”
Shares of men and women are almost equal in this segment; the segment mostly consists of middle-aged people in the “productive age” with secondary or university education. They mostly live with a spouse or a partner and children. Most of the segment
mem-Table 2. Results of the cluster analysis – the most common option of variables
Variable Relative share (%)
Cluster 1
aged 65 and higher 91.2
pensioner 98.4
grows his/her own vegetables 74.4
lives in a town with a population up to 2 999 52.0
average income 50.4
South Moravian Region 50.4
"use by" date exceeded 52.0
women 67.2
food is spoiled during storage 66.4
Cluster 2
aged 18–29 95.2
student 71.0
lives with parents 57.0
secondary with maturita –secondary school leaving exam 73.7
adequate income 55.9
I have already heard about the food bank and know its purpose 54.8 I think more should be talked and written about food waste 62.3
South Moravian Region 68.8
"use by" date exceeded 59.1
"best before" date exceeded 52.7
women 57.0
food is spoiled during storage 54.8
Cluster 3
aged 30–49 72.8
employee 78.9
lives with husband/wife and children 52.4
adequate income 55.8
I think more should be talked and written about food waste 55.8
South Moravian Region 59.2
women 62.2
food is spoiled during storage 68.6
[image:6.595.67.531.112.544.2]bers are employees or self-employed. This segment also includes women on maternity leave. They live in municipalities of all sizes (up to 3 000 inhabitants, up to 90 000 inhabitants, and over 90 000 inhabitants) while the shares are almost equal. They consider their incomes satisfactory, rather higher.
According to this segment, the main causes of food waste include the expiration of “use by” or “best before” terms, the food’s quality loss, spoilage during storage, bad look, and bad taste. Each of these facts is a reason to throw food away, i.e. this segment does not avoid food wastage. In their value hierarchy, food waste is lower than health concerns related to consuming longer-stored food.
They are aware of the food waste issue, as well as the negative impacts of food waste on air quality, they understand the whole concept of food waste and are familiar with the term of the food bank. However, they do not care about food waste reduction as they do not consider it their problem. They prefer other factors, such as health care, financial possibilities, and social status. In their view, these factors allow them to consume fresh, high quality, and visually appealing food only. This segment can be seen as the segment in which behaviour will be hard to change. The change will require a sophisticated approach to communication; it will be very demanding to achieve a shift in the segment’s opinions.
CONCLUSION
The results of the survey of Czech consumers’ at-titudes to food waste and the identification causes of food waste confirm the opinions published in the literature. The results of the survey also show that food wastage is most common among well-off households, i.e. it is behaviour resulting from affluence, which is a typical feature of today’s consumerist society. The sur-vey results confirmed the need for a more intense public communication about the issue of food waste, including its negative impacts on the environment, economic consequences of food loss, and the need to provide food to people who do not have the access/cannot afford sufficient nourishment. The main contribu-tion of the survey is the identificacontribu-tion of consumer clusters determined by opinions and attitudes to the issue of food waste. Based on these clusters, it will be possible to prepare and deploy effective commu-nication means for addressing consumers.
The analysis performed identified three distinct consumer segments: “Unintentional food
economis-ers” who do not waste food because they have no choice but to behave economically. Their behaviour is determined by their education and life experiences. It is not necessary to specifically address this segment.
The segment of “consumers affected by systematic education since primary school” includes consumers who are aware of all the negative consequences of food waste, yet they waste food because they have sufficient financial resources. It is necessary to develop a com-prehensive system of education on the subject of food waste aimed at this consumer segment. The system would need to address all the negative impacts of food waste on society, the environment, and general living conditions. If a proper systematic education system is deployed, positive results can be expected. Con-sumers who fall into this segment, yet who are too old for participation in an organised education system, can be addressed by modern marketing tools like guerilla marketing or on-line marketing campaigns.
Education in this area is crucial. It is, therefore, necessary to develop appropriate policy instruments that can be implemented to contribute to the long-term improvement of the situation with food waste. It is appropriate to make this issue a compulsory part of the education process starting at primary school. Pupils and students should be taught about the basic pillars of reducing food loss through information, for example, on proper food storage and its use in order to keep it fresh for as long as possible and not spoiled unnecessarily. This group should definitely be made aware of both the environmental and economic impacts of food waste from the point of view of households, but ultimately in global terms.
The third segment consists of consumers who need “re-education”. These are the typical food-wasters whose consumer behaviour is determined by suf-ficient or surplus income. The prospective change of this segment’s attitudes to food waste is the most demanding task, both in terms of the time needed, as well as the search for change-motivating arguments (human health, environmental protection, limited natural resources). This segment is risky and therefore requires a specific approach. A good option is com-municating with emphasis on the consequences of risk behaviour with regard to food waste and especially with emphasis on the aspect of health. Consumers in need of “re-education” can be efficiently addressed via mass-media campaigns.
of food waste, however, there is a primary common background factor – the affluent life of today’s society. It means the primary causes of food waste do not stem from individual characteristics and attitudes. There-fore, it is necessary to focus on educating the entire population segments. An important factor is proper value orientation – it should be built in every indi-vidual both by the family (i.e. from their early age) and educational institutions. Marketing activities can act as a useful supportive tool here.
REFERENCES
Borma A. (2017): Food waste – a global problem. SEA: Practi-cal Application of Science, 5: 353–362.
European Agency for the Environment (2016): Food Waste. Available at https://www.eea.europa.eu/signals/sig-nals-2012/close-ups/food-waste (accessed Jan 25, 2017). European Commission (2018): Food Waste. Available
at htt-ps://ec.europa.eu/food/safety/food_waste_en (accessed Feb 13, 2018).
European Court of Auditors (2017): Combating Food Waste: an Opportunity for the EU to Improve the Resource-Ef-ficiency of the Food Supply Chain. Publications Office of the European Union, Luxembourg. Available at http://
publications.europa.eu/webpub/eca/special-reports/food-waste-34-2016/ (accessed Jan 20, 2018).
Food and Agriculture Organisation (2011): The State of the World’s Land and Water Resources for Food and Agriculture. Managing Systems at Risk. FAO, Rome. Avail-able at http://www.fao.org/docrep/017/i1688e/i1688e.pdf Gustavsson J., Cederberg C., Sonesson U. (2011): Global
food losses and food waste. In: Proceedings Save Food Congress, Düsseldorf May 16, 2011. Available at: http:// www.madr.ro/docs/ind-alimentara/risipa_alimentara/ presentation_food_waste.pdf (accessed Mar 24, 2017). Monier V., Mudgal S., Escalon V., O’Connor C., Gibon T.,
An-derson G., Montoux H. (2010): Preparatory Study on Food Waste across EU 27. Technical Report 2010–054. Bio Intelligence Service, France. Available at http://ec.europa. eu/environment/eussd/pdf/bio_foodwaste_report.pdf (ac-cessed Feb 1, 2018).
Tostivint C., Östergren K., Quested T., Soethoudt H., Sten-marck A., Svanes E., O’Connor C. (2016): Food Waste Quantification Manual to Monitor Food Waste Amounts and Progression. Bio by Deloitte, Paris.
WRAP (2014): Household Food and Drink Waste in the UK. Final Report. WRAP, Banbury Available at http://www. wrap.org.uk/sites/files/wrap/Household_food_and_drink_ waste_in_the_UK_-_report.pdf (accessed Feb 8, 2018).