Editors
John FitzGerald, Ide Kearney
Authors
Adele Bergin, Thomas Conefrey, David Duffy,
John FitzGerald, Ide Kearney, Kevin Timoney,
Nuša Žnuderl
Boxes
Tim Callan, Conor O’Toole, Nuša Žnuderl
Number 12
Medium-Term Review
2013-2020
Medium-Term Review
2013-2020
Editors
John FitzGerald and Ide Kearney
Authors
Adele Bergin, Thomas Conefrey, David Duffy, John FitzGerald, Ide Kearney, Kevin Timoney, Nuša Žnuderl
Boxes
Tim Callan, Conor O’Toole and Nuša Žnuderl
July 2013
Number 12
Available to download from www.esri.ie
MTR Detailed Tables available to purchase for €300 at [email protected]
© The Economic and Social Research Institute Whitaker Square, Sir John Rogerson’s Quay, Dublin 2
Authors
Acknowledgements
Work on this year’s Medium-Term Review has been a lengthy process, which involved many experts both from within and outside of The Economic and Social Research Institute (ESRI). In preparing the Review for publication the authors have drawn heavily on the expertise of the Director and staff of the ESRI and the very useful advice of a number of referees.
The authors, and their research, have benefited hugely from the invaluable assistance of the Central Statistics Office (CSO).
Over the last six months, the authors have been in contact with leading institutions and experts from various fields of the economy. Such meetings, as always, proved to be more than useful. In particular we would like to thank the Central Bank of Ireland, the Department of Finance, Department of Jobs Enterprise and Innovation, Forfás, the Industrial Development Authority, Enterprise Ireland, FÁS, The National Treasury Management Agency, The Irish Fiscal Advisory Council, the IMF, the EU Commission, the Nevin Institute, Austin Hughes of KBC, Marian Finnegan of Sherry FitzGerald, and the many other individuals who offered us useful advice.
Once again the National Institute of Economic and Social Research, London, proved to be invaluable in offering advice and in allowing us access to their global
econometric model, NiGEM which enabled us to formulate the External
Environment of this year’s Review.
The last word of thanks goes to Regina Moore and Deirdre Whitaker all of the ESRI, because without their professionalism, expertise and attention to detail, publication would simply not have been possible.
Table of Contents
List of Figures ... ii
List of Tables ... iv
SUMMARY ... v
Scenarios ... v
Implications ... vi
Summary Table ... viii
CHAPTER 1 INTRODUCTION ... 1
CHAPTER 2 THE BACKGROUND ... 5
2.1 Introduction ... 5
2.2 A Housing and Credit Bubble ... 5
2.3 The Property and Credit Bubble... 7
2.4 Unemployment Crisis ... 10
Box A: Inequality During Ireland’s Great Recession ... 13
2.5 An Explosive Debt Crisis, the Banking Crisis and Fiscal Adjustment ... 14
2.6 Conclusions ... 19
CHAPTER 3 OVERVIEW OF MEDIUM-TERM SCENARIOS ... 21
3.1 Introduction ... 21
3.2 Three Scenarios ... 22
3.3 Methodology ... 25
Box B: The Risk Premium in HERMES ... 27
3.4 Summary of Implications of Scenarios ... 32
CHAPTER 4 ASSUMPTIONS ... 37
4.1 Introduction ... 37
4.2 World Economic Environment Assumptions ... 37
CHAPTER 5 MEDIUM-TERM SCENARIOS ... 51
5.1 Introduction ... 51
5.2 Recovery Scenario ... 51
5.3 Delayed Adjustment ... 71
Box C: Credit Capacity and Economic Recovery ... 73
5.4 Stagnation Scenario ... 82
5.5 Implications for Fiscal Policy ... 92
5.6 Conclusions ... 96
CHAPTER 6 EXPLORING THE RESPONSE OF THE ECONOMY TO SHOCKS AND SURPRISES ... 101
6.1 Methodology Adopted ... 101
6.2 Summary of Shocks ... 103
6.3 Results for Key Variables ... 104
6.4 Standardised €1 billion Fiscal Shocks ... 116
6.5 Conclusions ... 124
CHAPTER 7 CONCLUSIONS ... 125
7.1 Policy Implications – Public Finances ... 127
7.2 Policy Implications – The Banking Sector ... 128
7.3 Labour Market Policies ... 130
7.4 EU policy ... 131
7.5 Future growth strategy ... 132
REFERENCES ... 135
APPENDIX 1: FORECASTING RECORD OF THE MEDIUM-TERM REVIEW ... 140
List of Figures
FIGURE 2.1 Irish Economic Growth, GDP per cent ... 5
FIGURE 2.2 GDP and GNP Per Head Relative to the EU-15 Average ... 6
FIGURE 2.3 Balance of Payments Current Account Balance, as a % of GNP ... 7
FIGURE 2.4 House Completions ... 8
FIGURE 2.5 Household Debt Levels, and as a % of Personal Disposable Income ... 8
FIGURE 2.6 Cumulative Negative Equity ... 9
FIGURE 2.7 Residential Mortgage, Arrears > 90 Days ... 10
FIGURE 2.8 Total and Long-Term Unemployment Rate ... 11
FIGURE 2.9 The Unemployment Rate ... 12
FIGURE 2.10 Loss of Jobs During Recession ... 12
FIGURE 2.11 Educational Profile of Unemployed ... 14
FIGURE 2.12 General Government Gross Debt, per cent of GDP ... 15
FIGURE 2.13 General Government Deficit, per cent of GDP ... 16
FIGURE 3.1 Scenarios ... 22
FIGURE B1 Risk Premium for Irish 10 year Government Bonds Relative to German Bonds (%) ... 29
FIGURE B2 Government Risk Premium: Actual vs. Fitted Values ... 31
FIGURE 3.2 GNP, Constant Prices, Under Three Different Scenarios ... 33
FIGURE 3.3 Government Deficit/GDP Ratio, Under Three Different Scenarios ... 33
FIGURE 3.4 Debt/GNP Ratio, Under Three Different Scenarios ... 34
FIGURE 3.5 Unemployment Rate (ILO), Under Three Different Scenarios ... 35
FIGURE 4.1 Interest Rate on 10 Year Government Bonds, Recovery Scenario ... 43
FIGURE 4.2 Risk Premium on 10 Year Government Bonds ... 45
FIGURE 4.3 Recovery Scenario – Human Capital Index, Average Annual Growth, per cent ... 49
FIGURE 5.1 GNP, Average Annual Change, % ... 52
FIGURE 5.2 GNP, % Change ... 54
FIGURE 5.3 Path of GNP under Different Scenarios, € Million, Constant Prices ... 54
FIGURE 5.4 Savings Ratio, % ... 56
FIGURE 5.5 Real Consumption Per Head, € ... 57
FIGURE 5.6 Investment to GNP Ratio, % of GNP ... 60
FIGURE 5.7 Ratio of Capital Stock to Optimal Capital Stock, Manufacturing, 2000=1.0 ... 61
FIGURE 5.8 Current Account Balance, Adjusted, % of GNP ... 61
FIGURE 5.9 Unemployment Rate, ILO ... 64
FIGURE 5.10 Ratio of Actual to Long-Run Non-Agricultural Wage Rates ... 65
FIGURE 5.11 Labour Share of Value Added excluding agriculture ... 66
FIGURE 5.12 Government Expenditure and Revenue (excluding expenditure on banks), % of GNP... 67
FIGURE 5.13 General Government Debt, Net, Ratio to GNP and GDP ... 68
FIGURE 5.14 Government 10 year bond rates ... 69
FIGURE C1 Evolution of Credit to Real Economy in Ireland ... 73
FIGURE C2 Problems Facing Firms – Ireland – Eurozone - % of Respondents ... 74
FIGURE C3 Credit Constraints and Lending – Ireland ... 75
FIGURE 5.15 Savings Rate, Percentage of Disposable Income ... 77
FIGURE 5.16 Alternative Scenarios for Real GNP ... 79
FIGURE 5.17 Alternative Scenarios for Investment/GNP Ratio ... 80
FIGURE 5.19 GNP, Stagnation Scenario, Average Annual Change, % ... 84
FIGURE 5.20 Investment/GNP Ratio... 86
FIGURE 5.21 Current Account Balance, Adjusted, % of GNP ... 88
FIGURE 5.22 Unemployment Rate, ILO ... 88
FIGURE 5.23 Labour Share of Value Added (excluding agriculture) ... 89
FIGURE 5.24 General Government Balance, % of GDP ... 90
FIGURE 5.25 Government Expenditure and Revenue, % of GNP ... 91
FIGURE 5.26 Net Debt/GNP Ratio, %... 92
FIGURE 5.27 General Government Deficit, excluding banks, % of GDP ... 93
FIGURE 5.28 General Government Deficit as % of GDP ... 94
FIGURE 5.29 Interest Rate, 10 year government, per cent ... 94
FIGURE 5.30 General Government Debt (Gross) as percentage of GNP ... 95
FIGURE 5.31 GNP and Trend GNP ... 96
FIGURE 6.1 Value added, industry and services, % change compared to base ... 104
FIGURE 6.2 GDP and GNP compared to base, % change ... 108
FIGURE 6.3 Value Added, Industry and Services, Compared to Base, % Change ... 115
FIGURE A2.1 Alternative Scenarios for Unemployment Rate ... 144
FIGURE A2.2 Increase in Risk Premium in the “no austerity” Shock ... 145
FIGURE A2.3 Alternative Scenarios for Debt-GDP Ratio ... 146
List of Tables
TABLE 2.1 The Fiscal Adjustment, € billion ... 17
TABLE 4.1 Recovery and Delayed Adjustment Scenarios – Assumptions on World Economic Environment .. 38
TABLE 4.2 Stagnation Scenario – Assumptions on World Economic Environment ... 39
TABLE 4.3 Recovery Scenario and Delayed Adjustment Scenario – Fiscal Policy Assumptions ... 41
TABLE 4.4 Stagnation Scenario – Fiscal Policy Assumptions ... 43
TABLE 4.5 Key Demographic Assumptions ... 46
TABLE 4.6 Recovery Scenario – Labour Force Participation Rates, Per Cent of Population ... 48
TABLE 4.7 Stagnation Scenario – Labour Force Participation Rates, Per Cent of Population ... 48
TABLE 5.1 Recovery Scenario, Major Aggregates ... 53
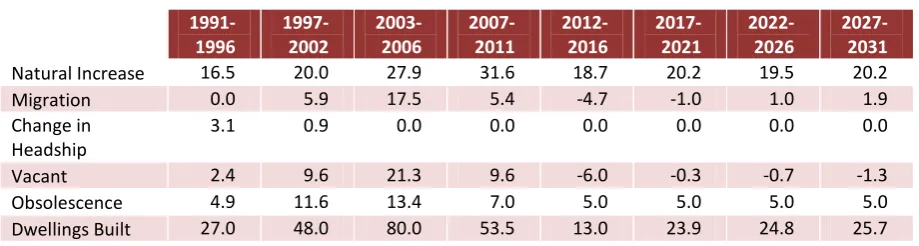
TABLE 5.2 Recovery Scenario – Decomposition of Housing Demand, average per year, (000) ... 58
TABLE 5.3 Delayed Adjustment Scenario, Major Aggregates ... 78
TABLE 5.4 Stagnation Scenario, Major Aggregates ... 83
TABLE 5.5 Stagnation Scenario – Decomposition of Housing Demand, Average Per Year, (000) ... 86
TABLE 6.1 Change in GDP, unemployment rate and deficit 6 years after initial shock. ... 103
TABLE 6.2 World growth shock, change from baseline ... 105
TABLE 6.3 International competitiveness, foreign prices shock, change from baseline ... 107
TABLE 6.4 International Competitiveness, Domestic Wage Shock, Change from Baseline ... 110
TABLE 6.5 Interest Rate Shock, Change from Baseline ... 112
TABLE 6.6 House price shock, change from baseline ... 114
TABLE 6.7 Estimates of Fiscal Multipliers ... 117
TABLE 6.8 Income Tax Shock, Change from Baseline ... 118
TABLE 6.9 Public service wage shock, change from baseline ... 119
TABLE 6.10 Public service employment shock, change from baseline ... 121
TABLE 6.11 Government Transfers Shock, Change from Baseline ... 122
TABLE 6.12 Public Sector Investment Shock, Change from Baseline ... 123
TABLE A1.1 Forecast Growth Rate of GNP, Annual Average, per cent ... 140
TABLE A1.2 Forecast of Unemployment Rate, Annual Average, Per Cent of Labour Force ... 141
Summary
The experience of the last five years has been truly exceptional, involving the worst economic crisis in Ireland since the Second World War. The legacy effects of this crisis include a dramatic increase in the indebtedness of the state as well as an exceptionally high level of unemployment.
The purpose of this Medium-Term Review is, first, to explore how the Irish economy works; second, to set out a range of possible future scenarios for the economy and third to use these scenarios to consider how domestic policy might improve the possible outcomes. Because of the uncertainty about the future, we consider three possible scenarios or paths for the economy over the rest of the decade. It will be some time before we know which of these scenarios is most likely to be correct and policy needs to take account of this uncertainty.
SCENARIOS
In the Recovery scenario, the EU economy is assumed to return to a reasonable rate of growth over the rest of the decade. It is also assumed that the continuing problems in the Irish financial sector are tackled effectively. Under these circumstances, the export sector of the economy would see its markets grow, resulting in increases in output and employment. In turn, growth in foreign demand would help produce a turnaround in domestic demand. As firms increase their sales and their profitability they would need to invest to continue growing. With rising real personal incomes and growth in employment, consumption would also begin growing again.
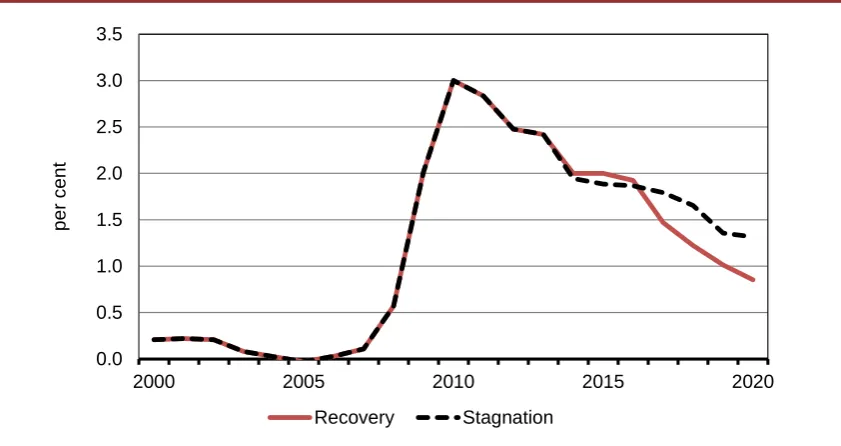
Demographic pressures would mean that more dwellings would need to be built later in the decade and a recovery in household circumstances would suggest that this investment could, in theory, be financed. Overall, this scenario would see growth in GNP of around 3.5 per cent a year in the second half of the decade (Table 1). While the economy would not be likely to reach full employment by 2020, the level of unemployment could be more than halved to around 6 per cent.
The Delayed Adjustment scenario considers what would happen if the EU economy recovered but domestic policy failed to resolve the ongoing problems in the Irish financial system, or if some other event or policy failure prevented the domestic economy from benefiting from a wider economic recovery. Such a scenario could see the economy seriously underperform its potential.
In this scenario, we focus on only one of the potential domestic risks – the problems with the financial sector. If these problems are not resolved rapidly, growth in the second half of the decade could be closer to 3 per cent a year. This, in turn, would mean that fiscal policy could not relax its stance until much later in the decade and the 2015 and 2016 Budgets would have to take more money out of the economy. This would contribute to the unemployment rate remaining in double digits for most of the decade.
In the Stagnation scenario we consider the circumstances where the EU economy does not return to growth in the near future. The result would be a “zombie” decade for the EU and this would have serious consequences for Ireland. With no growth in the EU, the Irish economy, even if managed effectively, would do well to grow at 1 per cent a year over the second half of the decade. The unemployment rate in 2020 would remain where it is today.
The failure of growth would have serious implications for the public finances. In order to keep borrowing under control, continuing tough Budgets would be needed until the end of the decade. In spite of this very tough fiscal stance, the burden of debt would remain very high, leaving the economy very vulnerable to new shocks. Any attempt to use fiscal policy to stimulate domestic demand would rapidly run into twin constraints: the need to keep the government debt sustainable and the need to maintain broad balance on the current account of the balance of payments.
I
MPLICATIONSBecause of the imperative of ensuring that the public finances are sustainable, the only option for fiscal policy over the last five years has been to adopt a strongly pro-cyclical stance. If the Recovery scenario proves to be closest to reality it should be possible to escape this bind fairly soon. However, if the Stagnation scenario were to prove most relevant, no such escape would be possible in the near future.
Budget. Then, if the Recovery scenario proved correct, that adjustment would be the last needed to restore order to the public finances. Growth in the economy would see the government accounts move into surplus by 2018 and the debt /GDP would continue on a downwards trajectory, consistent with fiscal rules. Failure to implement the planned 2014 Budget would still leave a need for some cuts at a later date and the short-term benefit to growth would be fully offset in the medium term. However, if the Stagnation scenario proved correct, the failure to make the adjustment in 2014 would leave a very big adjustment to be achieved in 2015 and 2016. Because of the continuing very high debt levels under the Stagnation scenario there would be no room for further delay in the fiscal adjustment after 2014.
The Delayed Adjustment scenario points to the need to resolve the continuing problems in the financial sector very rapidly. Failure to do so could both prejudice a potential recovery in the economy and it could also result in increasing the debts of the State. By contrast, a rapid resolution could see the State realising some gains on its financial assets by the end of the decade, further reducing sovereign indebtedness.
The contrast between the unemployment rates in the Recovery scenario and the Delayed Adjustment scenario suggests that there are potential problems in the labour market. There is a danger that the skills and experience of the long-term unemployed could be impaired by their time out of work so that they might not benefit from a return to employment growth. This highlights the need to develop a suite of labour market policies to ensure that, in the event of a recovery, the long-term unemployed find their way back into employment.
If the Stagnation scenario proves to be closest to reality, the government’s scope for action will be very limited. The failure of growth at an EU level could only be addressed by an EU policy response. The vulnerability of the economy, arising from the continuing high debt level, could only be addressed through a firm agreement that any future capital needs of the financial sector would be met from the EU ESM.
S
UMMARYT
ABLE12013 2014 2015 2016 2017 2018 15-20 Recovery Scenario
GDP, % 1.7 3.0 4.0 4.1 4.2 3.7 4.0
GNP, % 1.2 0.5 4.3 3.6 4.0 3.4 3.6
General Govt. Deficit, % of GDP 7.3 5.0 3.2 1.2 0.4 -0.3 -1.0 Unemployment Rate, % of Labour Force 14.0 13.4 11.8 10.6 9.5 8.2 5.6
Delayed Adjustment Scenario
GDP, % 1.8 1.9 2.7 1.9 2.7 3.0 3.3
GNP, % 1.3 -0.9 3.0 1.1 2.8 3.1 3.2
General Govt. Deficit, % of GDP 7.3 9.2 3.2 1.2 0.3 -0.4 -1.0 Unemployment Rate, % of Labour Force 13.9 13.8 12.9 13.5 13.1 11.9 8.4
Stagnation Scenario
GDP, % 1.7 3.5 1.3 1.1 2.0 0.8 1.4
GNP, % 1.2 0.0 1.9 0.6 2.1 0.4 1.1
General Govt. Deficit, % of GDP 7.3 4.5 2.7 2.5 2.0 0.6 0.7 Unemployment Rate, % of Labour Force 14.1 13.1 12.5 13.4 12.8 12.5 11.8
Chapter 1
Introduction
This Medium-Term Review is the twelfth to be produced by ESRI staff since the publication was first introduced in 1986. Since the last Medium-Term Review was published in 2008 two supplementary publications of a similar character were released in 2009 and 2010.2 Over the last quarter of a century the purpose in undertaking this exercise has been, first, to understand how the Irish economy works; second, to set out a range of possible future scenarios for the Irish economy and third to use these scenarios to explore how domestic policy can improve the possible outcomes. It is this latter purpose, to provide a basis for policy formation over the next few years, that is ultimately the most important reason for undertaking the analysis described here. However, to undertake this latter task of providing a basis for policy formation the first task, of developing a good understanding of how the economy works, is also an essential stepping stone.
The introductions to all previous Reviews have stressed the uncertainty that necessarily surrounds the scenarios for the future growth path of the economy contained in the Reviews. To reflect this uncertainty, previous Reviews have presented a range of different scenarios rather than a single forecast. However, the experience of the last five years has shown that even the diverse scenarios presented in previous Reviews did not properly capture the full severity of the recent crisis. This is a salutary lesson. In this Review we publish a number of scenarios that involve widely differing outcomes but, as in previous Reviews, we also acknowledge that other events, which may today appear very improbable, could produce outcomes well outside the range we consider. While we believe that such extreme possibilities are very unlikely, recent experience shows that such events can occur.
The forecasting record of past Reviews is analysed in Appendix 1. However, more important than the forecasts themselves were the implications for policy that the Reviews gave rise to. The policy implications drawn from past Reviews are reviewed in more detail in FitzGerald (2012a) and FitzGerald (2012b).
The current crisis has proved rather different in nature to the crises of the previous half century. Economists have characterised the possible outturns in the
current crisis in terms of “multiple equilibria” – there are widely different possible outcomes and, depending on the trajectory the economy takes in the near term, the final destination of the economy may be very different. Under these circumstances, the likely outturn in a decade’s time will not be some middle path.
Random or unexpected events can set the economy on a particular course to one of these “equilibrium” outcomes. Once set on that path it may be very difficult to move the economy onto an alternative path, which might initially have seemed a feasible destination. The task of policymakers is to try to ensure that the economy follows the more favourable of the alternative future trajectories. The intervention by our partners3 in 2010 in providing affordable funding for Ireland, and also the intervention by the ECB in the summer of 2012 committing to take whatever steps were necessary to maintain EMU, are examples of policy interventions that may have changed the trajectory of the Irish economy (and of other EU economies) towards a sustainable path. By contrast, the exact nature of the guarantees of the banking system given by the government in 2008 potentially moved the Irish economy onto a very unfavourable trajectory.
When developing future policy it is important that the measures implemented are framed on a “no regrets” basis, so that they will be likely to improve outcomes, no matter what the actual outturn. The reason for taking such a risk-averse stance is that, under current circumstances, the costs of underestimating the government deficit is likely to be much greater than the benefits from overestimating the deficit. As new information becomes available, policy can then be adjusted; it is easier to relax fiscal policy if things turn out better than expected rather than to tighten it if things turn out worse. The results of such a cautious analysis will not always produce the “optimal” policy for Ireland for a specific outturn but, rather, it should result in a set of policies that will produce favourable outcomes under a broad range of scenarios. This means that policymakers need to test their plans against a variety of different scenarios to see what the effects might be. One of the tasks of this Review is to provide such a test bed for policymaking.
We consider how policy failure at an EU level could result in stagnation in Europe over the rest of the decade, with a consequential very adverse impact on the Irish economy.4 It is only at an EU level that this policy problem can be addressed. Thus the scope for effective domestic policy action in Ireland is limited in that scenario. However, we also look at two scenarios where the EU economy recovers in the coming years. The difference between these two EU Recovery
3 The EU, the IMF and the governments of Demark, Sweden and the UK.
scenarios concerns the stance of domestic policy. In the first case domestic policy supports the recoverywhile in the second case domestic policy seriously delays domestic recovery. This highlights the importance of focusing domestic policy on the issues within the control of the Irish authorities to ensure that future economic development is maximised, conditional on whatever happens at the European level.
Since the ESRI began publishing Medium-Term Reviews an essential tool used in the analysis has been the ESRI’s HERMES macro-economic model of the Irish economy. The model incorporates the results of a wide range of research about the Irish economy that has been undertaken over the last twenty-five years, in the ESRI and elsewhere. The model itself has evolved in its understanding of how the economy behaves. However, the key insight of the original HERMES model remains valid today: the level of activity in the Irish economy is crucially dependent on the share of world output that is attracted to the Irish economy (Bradley and FitzGerald, 1988 and Bradley et al., 1993b). A description of the current version of the model is included in a separate Working Paper, Bergin et al. (2013).
Over time, new mechanisms have been added to the model. In the late 1980s, to deal with the last major economic crisis in Ireland, a model of government debt and a detailed model of the public finances was developed (Bradley, et al., 1993b). This particular module has proved very useful in understanding the current situation. In the last decade a model of the housing market was developed (Duffy, FitzGerald and Kearney, 2005). It was used in the 2005 Review to consider the implications for the economy of a collapse in housing prices. The version of the model used in the 2008 Review incorporated a refined model of labour supply to deal with a situation where there was considerable immigration, as well as emigration (FitzGerald et al., 2008). This 2013 Review uses the latest version of the HERMES model, which has a number of additional features. The risk premium on government borrowing is now incorporated as a function of indebtedness and borrowing. The saving behaviour of households is modelled in a more sophisticated fashion than in the past; it allows for the effects on consumption of deleveraging by households as a result of a collapse in house prices. This version of the model does not have a fully-fledged financial sector: that is work in progress. However, while not incorporated into the formal model, in Chapter 5 we use the latest available research on the financial sector of the economy to consider how the future course of the economy might be affected by a failure to resolve the current crisis in that sector.
the story of Icarus. At the time we were concerned that unduly expansionary fiscal policy, specifically the failure to control the housing market, meant that the Irish economy was flying too close to the sun. Like the advice of Daedalus, this warning was subsequently ignored! Reflecting on the growing dangers arising from the property boom the Introduction to the 2005 Review reflected on the story of the Lotus-eaters from the Odyssey. The crew of Ulysses’ ship were distracted by the Lotus-eaters, nearly derailing their voyage. However, with a huge effort Odysseus got them back to their ships and the painful nature of the effort was reflected in the following passage:
I forced them back to the ships and made them fast under the benches. ….. so they took their places and smote the grey sea with their oars. HOMER, Odyssey, Book IX, vss. 83-104
Since 2008, like the crew of Ulysses, Ireland has had a very difficult time setting a suitable course for the future.
It is too early to determine whether Ireland is set on a sustainable escape path from the recent economic crisis. As discussed later in this Review, there are many things that could still go wrong, or that may take a long time to put right, delaying a full recovery. Economists are notoriously bad at predicting turning points and it will only be after at least two years of sustained recovery that we will be certain that the recovery has really begun.
Chapter 2 of this Review briefly revisits the history of the economy over the last five years. Chapter 3 provides an overview of the scenarios described in this Review. Chapter 4 sets out the assumptions underlying the scenarios and the three rather different scenarios are described in Chapter 5. As discussed above they represent two possible “equilibrium” outcomes – a relatively benign Recovery scenario with a return to growth over the rest of the decade and a much less pleasant “European Stagnation” scenario, where policy failure in Europe sees the Irish economy continuing on an exceptionally vulnerable low-growth path to the end of the decade. A third scenario is also considered where the EU economy recovers but domestic policy failures seriously delay the domestic recovery. Chapter 6 discusses in more detail how the Irish economy is likely to respond to changes in key variables, using the HERMES model to throw light on how the economy reacts to different stimuli. Finally, in Chapter 7, some conclusions concerning the policy implications of this analysis are set out. As in previous Reviews, we set out in Appendix 1 an analysis of the forecasting record of previous publications. Bergin et al. (2013), describe some of the key features of the HERMES model used in this Review, including the fiscal policy
indexation rules. More detailed tables are available at
Chapter 2
The Background
2.1 Introduction
Before analysing alternative paths for the economy out of the current crisis, it is useful to review some of the key developments which have shaped the economy over the last decade. Many of the problems that have been faced in attempting to emerge from the current difficulties have their roots in imbalances which grew over the last decade, and these are discussed below. The crisis in the banking system and the related imbalance in the state’s finances are linked to problems which have demanded the most urgent and robust response from the authorities so far in the crisis. This section also examines the impact of the fiscal consolidation measures introduced since 2008 and considers how they have impacted on the economy.
2.2 A Housing and Credit Bubble
Over the past 20 years Ireland has experienced a strong economic expansion followed by a sharp economic contraction. The Irish economy enjoyed an exceptional period of growth from 1994 through to the mid-2000s (Figure 2.1). It resulted in the standard of living in Ireland, measured as GDP or GNP per head, rising above the average for the EU-15 in the late 1990s and the early years of the 2000s (Figure 2.2). However, the result of the crisis has been to reduce GNP per head to slightly below the average for the EU-15 (though GDP per head still remains above average).
FIGURE 2.1 Irish Economic Growth, GDP per cent
-10 -5 0 5 10 15
1989 1993 1997 2001 2005 2009
per
c
ent
Celtic Tiger period Domestic driven
FIGURE 2.2 GDP and GNP Per Head Relative to the EU-15 Average
Source: EU AMECO database. The GNP figures are obtained by adjusting the relative GDP figures by the ratio of GNP to GDP for Ireland.
Up to the early years of the last decade growth was largely driven by the expansion in world trade and a rapid increase in world market share for Irish exports. The dramatic rapid rise in employment and incomes, together with the increased availability of low cost finance as a consequence of EMU membership and the globalisation of the financial sector, resulted in a boom in the building and construction sector in the last decade; in particular there was a rapid expansion in house building (Conefrey and FitzGerald, 2010). This housing boom drove economic growth over the “bubble” years from 2003 onwards, so that the level of actual output rose well above the potential output of the economy.
The second strand of the emerging bubble can be seen in the rapid growth of private sector credit, which increased from 100 per cent of GDP in 2002-2003 to well over 230 per cent of GDP by 2009. The majority of this increase in bank lending was financed by a capital inflow from abroad through the banking system. While domestic savings were sufficient to fund the housing boom up to around 2003, thereafter they proved inadequate. Instead, the banking sector financed the boom by borrowing increasing sums abroad and relending these funds domestically to the property sector.
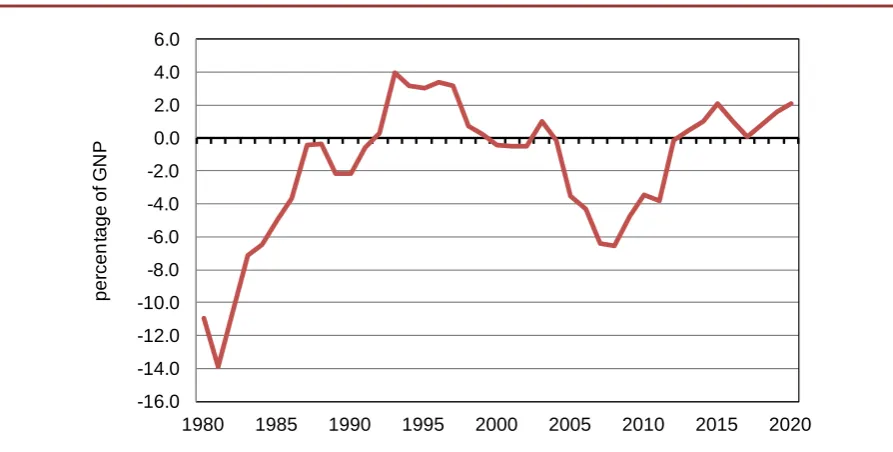
Membership of monetary union resulted in less attention being paid to a “conventional” early warning indicator of domestic imbalances – the current account of the balance of payments. The big increase in investment in housing was reflected in a growing deficit on the current account of the balance of payments, (Figure 2.3), matched by a growing surplus on the financial account, reflecting the foreign borrowing by the banking sector. The deficit on the current
50 75 100 125 150
1970 1975 1980 1985 1990 1995 2000 2005 2010
per
c
en
t
account began to deteriorate from 2003 onwards, a much earlier indicator of looming danger than output, employment or public finance indicators.
FIGURE 2.3 Balance of Payments Current Account Balance, as a % of GNP
Source: Central Statistics Office Balance of Payments adjusted for Redomiciled PLCs (FitzGerald, 2013).
2.3 The Property and Credit Bubble
The global financial crisis, that started in the US sub-prime mortgage market, triggered an end in the Irish economic boom. Contagion from the US spread to the European financial system through a number of channels. For example, it had a particularly negative impact on institutions that depended on the interbank market for much of their funds. The bursting of the bubble caused significant damage to the economy, both in terms of measured economic activity and in employment. Whether measured by GDP or GNP, the latest data suggest that output per head is at levels last seen in the early years of the last decade, while the unemployment rate has soared from below 5 per cent of the active labour force in 2007 to over 14 per cent by 2012. The housing market shrank dramatically in response to the crisis. House prices have fallen by over 50 per cent from their peak and house completions are less than 10 per cent of peak output levels (Figure 2.4).
-16.0 -14.0 -12.0 -10.0 -8.0 -6.0 -4.0 -2.0 0.0 2.0 4.0 6.0
1980 1985 1990 1995 2000 2005 2010
per
c
ent
age of
G
N
FIGURE 2.4 House Completions
Source: Department of the Environment, Heritage and Local Government.
Private sector credit grew rapidly over the course of the boom. Much of this was borrowing by households to finance house purchases. The increase in borrowing left households vulnerable to the impact of the financial crisis. At its peak household debt was over 220 per cent of disposable income (Figure 2.5). The ratio has now declined to just over 200 per cent, its lowest level since Q4 2006, reflecting deleveraging by households. However, for households on tracker mortgages the fall in interest rates has provided some relief.
FIGURE 2.5 Household Debt Levels, and as a % of Personal Disposable Income
Source: Based on data from the Central Statistics Office and Central Bank of Ireland.
The combination of a high debt burden, a housing market crash and a sharp economic contraction has had serious consequences for the household sector, which undertook high levels of borrowing during the boom years. The sharp
0 10,000 20,000 30,000 40,000 50,000 60,000 70,000 80,000 90,000 100,000
1970 1975 1980 1985 1990 1995 2000 2005 2010
Lev el 100.0 120.0 140.0 160.0 180.0 200.0 220.0 240.0 0 50 100 150 200
2003 Q1 2004 Q3 2006 Q1 2007 Q3 2009 Q1 2010 Q3 2012 Q1
per c ent ag e of di s pos abl e i nc om e € b illio n
house price decline has meant that negative equity is widespread, particularly amongst younger households (Figure 2.6). Duffy and O’Hanlon (forthcoming) estimate that approximately 214,000 households were in negative equity by the end of 2012 (37 per cent of mortgaged households and around 13 per cent of all households), and that of those who took out a mortgage between 2005 and 2012 and are in negative equity, over 75 per cent are households where the household head was aged 40 years or under in 2012.
FIGURE 2.6 Cumulative Negative Equity
Source: Duffy and O’Hanlon, forthcoming.
Rising unemployment levels and reductions in income are also reflected in statistics on mortgage arrears. These show a steady rise in mortgages in arrears of 90 days and over. By the end of 2012 this had reached 95,000 mortgages or 11.9 per cent of mortgages taken out to purchase a family home, see Figure 2.7. A large number of mortgages have also been restructured, 80,000 at end-December 2012, of which 42,000 were not in arrears.
0 10 20 30 40 50 60 70
2005M02 2006M03 2007M04 2008M05 2009M06 2010M07 2011M08
c
um
ul
at
iv
e per
c
FIGURE 2.7 Residential Mortgage, Arrears > 90 Days
Source: Central Bank, Residential Mortgage Arrears and Repossessions Statistics.
2.4 Unemployment Crisis
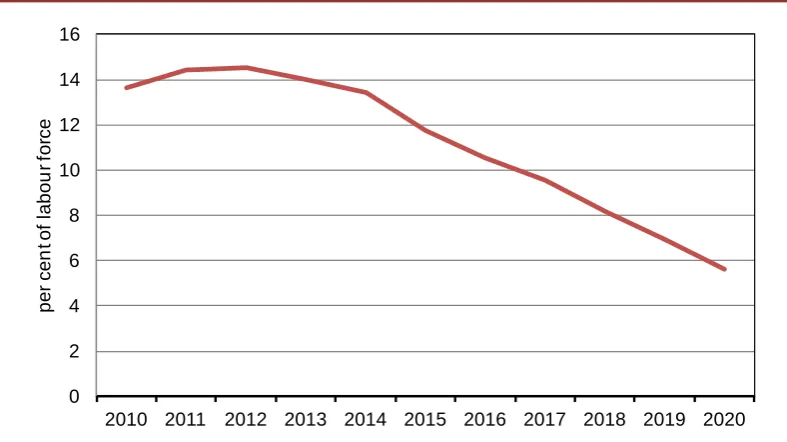
The unemployment rate grew with alarming speed between 2008 and 2012, peaking at just over 15 per cent of the labour force (Figure 2.8). The labour market, which began to show signs of stabilisation during 2012, has recently made progress in terms of falling unemployment and improving employment levels. According to the Quarterly National Household Survey (QNHS), in the first quarter of 2013, the level of unemployment fell below 300,000 and the unemployment rate was reduced to 13.7 per cent. Although small increases in employment have been recorded over recent quarters, these gains have made only small inroads into the high level of unemployment, which has a worryingly high long-term component. Meanwhile, net outward migration of roughly 30,000 per annum has continued since 2010. The largest group of net migrants are those aged 15-24 (both genders), followed by males aged 25-44.
3.3%3.6%
4.1%4.6%
5.1%5.7%
6.3% 7.2%
8.1% 9.0%
9.9%10.6%
11.5%11.9%
0% 2% 4% 6% 8% 10% 12%
0 10,000 20,000 30,000 40,000 50,000 60,000 70,000 80,000 90,000 100,000
2009Q3 2010Q3 2011Q3 2012Q3
per
c
ent
Lev
el
FIGURE 2.8 Total and Long-Term Unemployment Rate
Source: Central Statistics Office Quarterly National Household Survey.
The elevated level of long-term unemployment is particularly worrying as it could lead to the emergence of long-term structural unemployment that would be hard to reduce in a recovery. Figure 2.8 shows that the long-term unemployment rate, those out of work for more than one year, has risen considerably since 2009 and now accounts for roughly 60 per cent of total unemployment. Furthermore, it is much higher among men, particularly young men. The legacy effects of large falls in construction employment are evident in the sector-specific nature of the unemployed. This could also possibly give rise to “hysteresis” effect, making it difficult for the long-term unemployed to return to full employment.
In addition to the fall in employment, there has also been a big reduction in participation in the labour market. The participation rate peaked just above 64 per cent in 2007 and has declined since then, dipping below 60 per cent in 2012 – the lowest participation for nine years. The group most affected by this reduction in participation has been young men aged 15-24, for whom participation dropped from 59.6 per cent in 2007 to 41.3 per cent in 2012. Participation has also fallen considerably for young women, from 52.5 per cent in 2007 to 39.7 per cent in 2012. A very significant factor in this fall in labour force participation among the younger cohort has been an increase in participation in education. This rise in participation in education holds out the prospects of some longer-term benefits as it enhances the future earning power of those involved.
Figure 2.9 shows what the measured unemployment rate would be using wider definitions of labour force participation, to include those who are “discouraged workers”, underemployed part-time workers and those who are not in education but who want work. Using the widest definition, the measured unemployment
0 2 4 6 8 10 12 14 16
2003Q1 2005Q1 2007Q1 2009Q1 2011Q1 2013Q1
per
c
ent
ag
e of
l
abour
f
or
c
e
[image:25.595.108.526.91.300.2]rate in the first quarter of 2013 was 25 per cent. Figure 2.10 helps to clarify this issue. It shows total employment and the total labour force from peak to today. At its peak, in 2008 quarter 1 the total labour force included 2.277 million people. By the third quarter of 2012 this had fallen by 128,000 to a recent trough of 2.149 million. This very sharp fall in labour force participation means that headline unemployment numbers are lower. However, it is likely that these figures mask potential pent-up labour supply, which could well be expected to rise were labour market conditions to improve.
FIGURE 2.9 The Unemployment Rate
Source: Central Statistics Office Quarterly National Household Survey.
FIGURE 2.10 Loss of Jobs During Recession
Source: Central Statistics Office Quarterly National Household Survey. 0
5 10 15 20 25 30
1998 2000 2002 2004 2006 2008 2010 2012
per
c
ent
ag
e of
l
abour
f
or
c
e
UR incl. Potential Added Labour Force and Underemployed
UR incl. Potential Added Labour Force
UR incl. Discouraged Workers
UR
2277.1
2151.8
2,160.7
1855.7
1,700 1,800 1,900 2,000 2,100 2,200 2,300 2,400
2003Q1 2005Q1 2007Q1 2009Q1 2011Q1 2013Q1
T
hous
ands
The rise in unemployment has had significant implications for financial stability and the public finances. In addition, the problems in the labour market have combined to have a serious negative impact on the standard of living of the population as a whole. Box A discusses the distributional impact of what has happened in Ireland over the last five years.
BOX A: Inequality During Ireland’s Great Recession
Tim Callan
Recessions affect the distribution of income through many different channels. The direct effect which first springs to mind is the loss of income for those who become unemployed – and with unemployment rising from 4 to over 14 per cent, this is clearly of major importance in the Irish case. Differences in the risk of unemployment across occupations and levels of education also affect how the income losses are distributed. The collapse of the housing bubble led to major job losses in the building industry and in related trades and professions. But there also tend to be broader changes in income patterns over the business cycle: self-employed incomes tend to rise faster than average during an upswing, and fall more than average in a recession. During the current recession, the austerity package has also included very substantial changes in taxes and in many welfare payments (notably Child Benefit and payment rates on working-age schemes). The best way to take account of these multiple and complex influences on incomes is to use micro-level data on household incomes, such as that gathered by Central Statistics Office (CSO) in its Survey on Income and Living Conditions (SILC). The latest release by CSO incorporates new data for 2011 and revised data for 2010. The most commonly used summary measure of inequality is the Gini coefficient, which takes a value of zero for perfect equality, and 1 for complete inequality. The value for Ireland has been very stable: Nolan et al. (2012) show that it remains in the range 0.31 to 0.32 for most years. During the recession, the Gini coefficient has also remained within this range, with the exception of 2009, when it fell to just over 0.29 (indicating lower inequality in that year). Callan et al. (2013) suggest that increases in welfare payment rates in the October 2008 Budget were a potential explanatory factor.
Callan et al. (2013) undertake a more detailed analysis of income distribution over the years 2008 to 2011, based on analysis of SILC microdata.5 They find that, while the Gini coefficient is stable, there have been falls in the income share going to the bottom and top deciles. Real incomes fell across the income distribution, but the sharpest losses have been in the income positions at the bottom of the income scale (bottom decile) with above average losses also for income positions at the top of the income scale (top decile). As individual people move into and out of income deciles – and indeed some will have left the country
– these are not comparisons of the same group of people. Changes in the composition of the income deciles have to be further analysed to understand the full picture.
One thing which is clear from analysis using SWITCH, the ESRI tax-benefit model, is that the net effect of changes in direct taxes, welfare and public service pay policies has been to reduce incomes by a greater percentage at the top of the income distribution, and by less towards the bottom. This being so, the sharp reductions in the income of the bottom decile are not policy-induced, but reflect the direct impact of the recession.
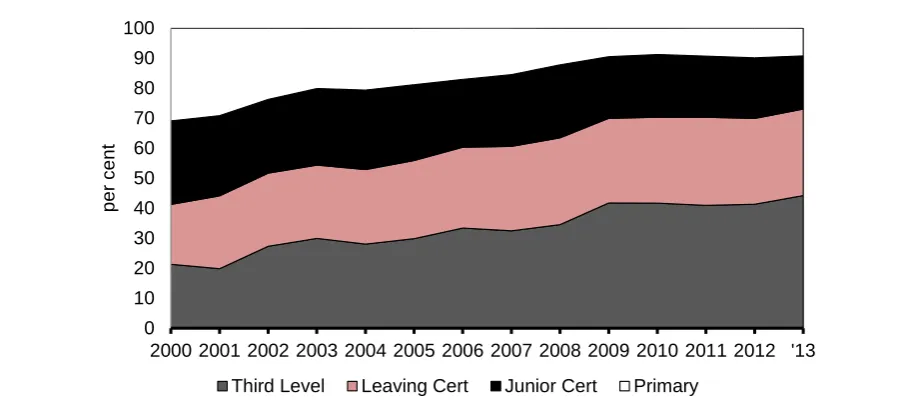
Figure 2.11 shows that the educational profile of the unemployed has changed radically from the 2000s. In 2000, 41 per cent of those unemployed had a Leaving Certificate or higher level of educational attainment, whereas now this is 70 per cent. This changes the sort of interventions and training programmes required to enhance the prospects of those who are unemployed today obtaining jobs in any recovery. It also paints a slightly more optimistic picture of what the future might hold if the economy recovers. Experience has shown that the higher the education level, the better the employment prospects are for the unemployed in a growing economy.
FIGURE 2.11 Educational Profile of Unemployed
Source: Central Statistics Office Quarterly National Household Survey.
2.5 An Explosive Debt Crisis, the Banking Crisis and Fiscal Adjustment
The collapse in the housing market, the resulting implosion of the domestic banking system and the related rise in unemployment, led to a dramatic deterioration in the public finances. Over the period 2000 to 2007 Irish government debt was low and falling. Having been one of the EU economies with
0 10 20 30 40 50 60 70 80 90 100
2000 2001 2002 2003 2004 2005 2006 2007 2008 2009 2010 2011 2012 '13
per
c
ent
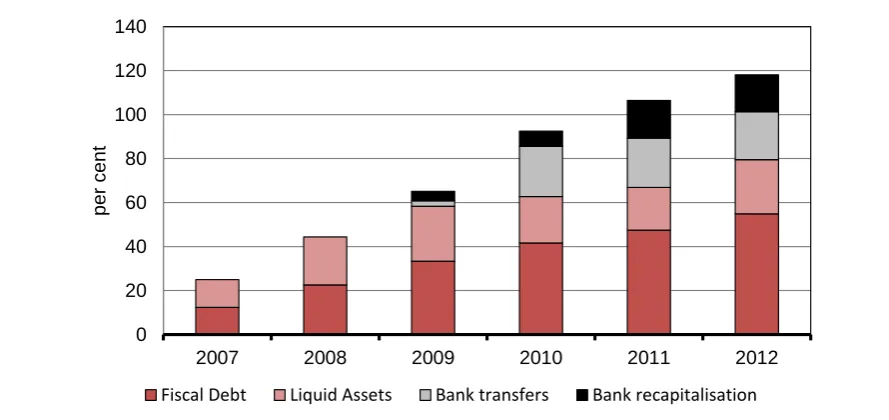
[image:28.595.76.531.447.655.2]the lowest government debt burden in 2007, Ireland has moved to being one of the more heavily indebted economies. The very rapid deterioration in the fiscal position from 2007 onwards, greatly aggravated by the large transfers of funds to the banking system and direct injections of capital into the banks, meant that gross government debt was estimated to be 118 per cent of GDP by the end of 2012 (Figure 2.12).
Figure 2.12 shows the dramatic impact that direct government intervention in the banking system has had on the government debt figures since the beginning of 2009. Just under 40 percentage points of GDP of the increase in the debt was directly attributable to the money transferred to the banking system under a number of mechanisms. However, over 50 percentage points (of GDP) of the debt at the end of 2012 was attributable to the borrowing undertaken since 2008 to finance the “fiscal debt”, that is the effect of the cumulative fiscal deficits on the original total stock of debt. Closing the huge gap in government funding has been the key target of fiscal policy over the last five years.
The fall-out from the crisis in the banking system has had even wider effects than the huge addition to the government debt. The banks themselves have major continuing problems and there are real concerns as to how ready the financial system will be to fund any recovery in the economy.
FIGURE 2.12 General Government Gross Debt, per cent of GDP
Source: Central Statistics Office, Government Financial Statistics, ESRI estimates.
In late summer 2010 the government still expected to be able to fund itself on financial markets. However, as the full magnitude of the potential losses in the banking system began to be apparent in the autumn of 2010, the government
0 20 40 60 80 100 120 140
2007 2008 2009 2010 2011 2012
per
c
ent
[image:29.595.81.526.475.685.2]had to seek aid from the IMF/EU towards the end of that year. One of the key factors driving nervousness in the markets at that time was the scale of the contingent liabilities related to the banking system that were not included in the official debt figures.
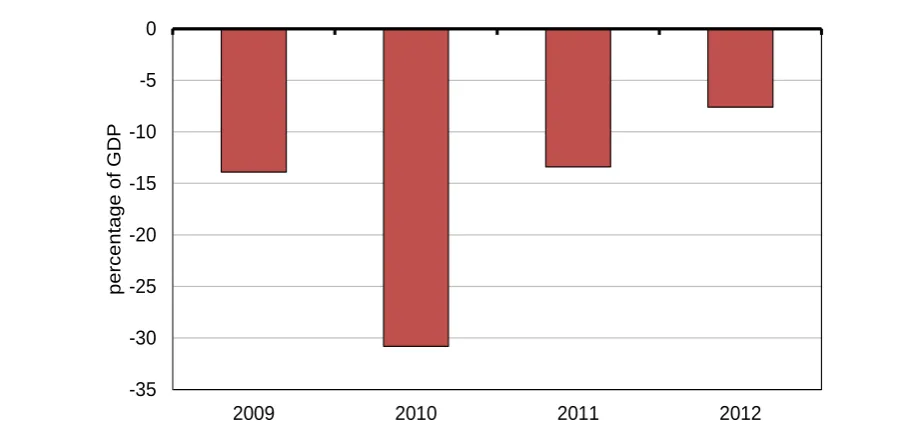
Figure 2.13 shows the General Government Deficit as a per cent of GDP. The deficit figures in 2009-2011 include the money needed to pay the losses of the banking system and to recapitalise the surviving banks. While it is necessary to exclude the effects of banking interventions to arrive at the “underlying” deficit, these banking interventions have had a significant effect on the measured deficit, particularly in 2010. As discussed later, they have also contributed to the very high risk premium on Irish government bonds.
FIGURE 2.13 General Government Deficit, per cent of GDP
Source: Central Statistics Office, Government Financial Statistics.
Since the summer of 2008 the Irish fiscal position has deteriorated very rapidly. Beginning in autumn 2008, the authorities responded to this deterioration with a series of very tough budgets designed to stabilise the deficit. The speed with which the deficit widened, even in the face of the fiscal tightening, warranted a supplementary budget in the spring of 2009 and it was not until 2010 that the measures undertaken were sufficient to see the deficit stabilise. Table 2.1 summarises the ex ante measures undertaken and planned. As discussed above, in November 2010 the Irish government agreed a package of loans from the EU/IMF designed to help fund Irish debt over the period 2011-2013. That agreement incorporated the government’s existing plan that mapped out a further package of medium-term measures designed to bring the deficit below 3 per cent of GDP by the middle of the decade.
-35 -30 -25 -20 -15 -10 -5 0
2009 2010 2011 2012
per
c
ent
ag
e of
G
D
[image:30.595.73.528.326.542.2]TABLE 2.1 The Fiscal Adjustment, € billion
2008 2009 2010 2011 2012 2013 2014 2015 TOTAL
Revenue 0.0 5.6 0.0 1.4 1.6 1.4 1.1 0.7 11.1
Expenditure 1.0 3.9 4.3 3.9 2.2 1.9 2.0 1.3 19.2
of which capital: 0.0 0.6 1.0 1.9 0.8 0.6 0.1 5.0
Total 1.0 9.4 4.3 5.3 3.8 3.4 3.1 2.0 32.3
Source: Department of Finance, various.6
Roughly two-thirds of the actual and planned fiscal package relates to cuts in expenditure, both current and capital. In 2009 and 2010 significant cuts in public service pay levels were introduced, equivalent to up to 15 per cent of gross salary. There have also been very large cuts in expenditure on capital projects. On the revenue side, taxes on income have risen substantially in these years (Callan, et al., 2013a).
The very tough fiscal packages that have been implemented have been strongly pro-cyclical, involving very large cuts in expenditure and increases in taxation, at a time when output was falling rapidly. The measures implemented over the period 2009-2013 amounted to an ex ante adjustment of €26 billion7, or 16% of GDP. In addition to these measures already undertaken, a further adjustment of €5 billion is due to be implemented in 2014-2015.8 In total this is equivalent to an adjustment of approximately one-fifth of GDP, an unprecedented programme of contractionary fiscal measures that has reduced output, employment and incomes in the economy.
In understanding the recent experience of the Irish economy it is important to assess how much of the weakness in economic growth was directly attributable to the necessary tightening of fiscal policy and how much to other factors, external and internal. In turn, this decomposition can help us understand how the economy may perform in the next few years, as the contractionary stance of fiscal policy is eased. Appendix 2 describes how this decomposition was undertaken using the HERMES model.
This analysis should not be taken to suggest that a neutral budgetary policy was a feasible policy option. On the contrary, it is absolutely clear that the fiscal
6 For 2008-2010 Report of the Review Group on State Assets and Liabilities. [Table 2.1: Budgetary Adjustments since mid-2008 – Planned Budgetary Impact.] For 2011 and 2012 Budget 2011, Budget 2012, Medium Term Fiscal Statement, November 2012 Table 2.1. The figures included show the full year effects, including carryover, and exclude once-off measures. For 2013-2015 figures from Medium-Term Fiscal Statement, November 2012 Table 2.1. 7 See Kearney (2012) for details.
adjustment undertaken was the minimum necessary to ensure that the government could raise funding to cover the continuing massive deficit. Without the intervention of the Troika and other EU partners who provided essential funding, a much more brutal adjustment would have proved essential. Unfortunately, because of the funding problems there was no choice but to implement this strongly pro-cyclical fiscal policy.
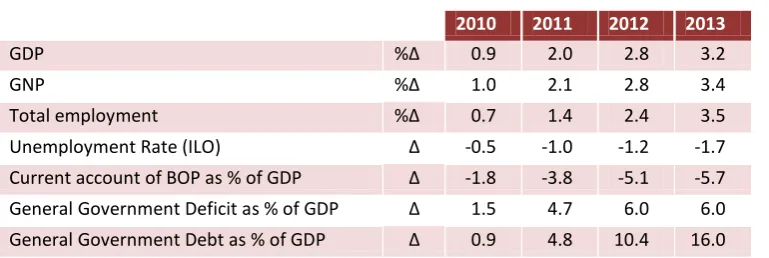
[image:32.595.110.495.438.567.2]Table 2.2 presents an overview of the impact of the necessary fiscal tightening over the last four years. The results suggest that the cumulative effect of contractionary fiscal policies since 2010 has been to reduce the growth rate over the period by between 0.75 per cent and 1 per cent a year so that, by 2013, the level of both real GDP and GNP were between 3 and 3½ percentage points lower than they would have been under a “neutral” fiscal policy. The estimated effect of fiscal tightening has been particularly severe on domestic economic activity, with a reduction in the level of consumption by 2013 of up to 7 percentage points relative to the base levels. By contrast, the results suggest that the fiscal adjustment has had a negligible effect on exports. The cumulative effect on the unemployment rate has been to raise it between 1.5 and 2 percentage points in 2013.
Table 2.2 Full Fiscal Indexation from 2010 Onwards: Effect on Main Aggregates
2010 2011 2012 2013
GDP %Δ 0.9 2.0 2.8 3.2
GNP %Δ 1.0 2.1 2.8 3.4
Total employment %Δ 0.7 1.4 2.4 3.5
Unemployment Rate (ILO) Δ -0.5 -1.0 -1.2 -1.7
Current account of BOP as % of GDP Δ -1.8 -3.8 -5.1 -5.7 General Government Deficit as % of GDP Δ 1.5 4.7 6.0 6.0 General Government Debt as % of GDP Δ 0.9 4.8 10.4 16.0
The aggregates in Table 2.2 highlight the significant costs to the economy of the fiscal tightening. However, the table also includes key public finance aggregates that provide a stark estimate of the possible costs that would have resulted from a failure to implement the austerity programme from 2010 to 2013. By 2013 the General Government Deficit would have been 6 percentage points higher than it actually is – something that would clearly have been completely unsustainable.
funding that might have been available. In practise, as we saw in the autumn of 2010, funding was not available at any realistic interest rate, so that a neutral fiscal policy was never feasible, even if the government had wished to exercise such an option.
This simulation does, however, show that the effect of the tough fiscal adjustment over the last five years has been to knock nearly one percentage point a year off the growth rate in 2010-2013. The effects were particularly severe on domestic demand. This suggests that in future years, when the contractionary fiscal policy ends and deleveraging is complete, a more robust response from domestic demand can be expected, adding to growth.
2.6 Conclusions
The key problems that the Irish economy faces today as a result of the crisis are a high level of indebtedness of both households and government, a very high unemployment rate and a fragile banking system. In turn, these problems have combined to have a serious negative impact on the standard of living of the population as a whole (Box A). Although our analysis shows that the large-scale fiscal consolidation implemented since 2008 has lowered economic growth and resulted in higher unemployment, it was essential in order to stabilise the escalating deficit and debt.
Chapter 3
Overview of Medium-Term Scenarios
3.1 Introduction
When considering the possible future path that the Irish economy may follow over the coming decade it is essential to consider the nature and extent of the uncertainty about this path. From the standpoint of 2013 there is a wide range of possible trajectories that the economy could follow. However, to provide a useful guide to policymakers it is important to put some structure on these future possibilities, a structure that suggests what may be the more probable range of outcomes and a structure which can identify how public policy can enhance the possibility of favourable outcomes.
When preparing past Medium-Term Reviews the approach to the uncertainty inherent in all forecasts was to first prepare a benchmark forecast and then to consider a wide range of possibilities around that benchmark. This assumed that the likely outturn would fall within such a range of outcomes, with the benchmark “centered” within that range. However, the current crisis has proved rather different in nature. Economists characterise the possible outturns in the current crisis in terms of “multiple equilibria” – there are possible widely different outcomes, which could lead to a number of alternative benchmarks. Moreover, depending on the trajectory the economy takes in the near term, the final destination may be very different. Under these circumstances the likely outturn in a decade’s time will be one of these alternatives, not some middle path. The task of policymakers is to try to ensure that the economy follows the more favourable of alternative future trajectories.
However, considerable uncertainty still remains about the future sustainability of the Irish economy. If the EU economy were not to return to growth in the foreseeable future, like the zombie economy of Japan in the 1990s, then the Irish economy would remain in a very vulnerable situation. Under these circumstances a small shock could push the economy into a downward spiral, where absence of growth would result in rising debt levels and rising debt levels, in turn, would render future growth even more unlikely. As discussed in this Review, such an outcome cannot be ruled out. Thus policymakers, both in Ireland and the wider EU, have further work to do to ensure that the Irish economy (and also the wider EU economy) is firmly set on a path to recovery.
In this Review we develop three scenarios in some detail and consider their implications for the Irish economy over the rest of the decade. Figure 3.1 summarises the difference in the assumptions underlying the three scenarios and it also gives the names we use to refer to them in the text. The two dimensions we explore in the scenarios are uncertainty about an EU recovery and uncertainty about the response of the Irish economy to the external environment.
FIGURE 3.1 Scenarios
Assumptions European Recovery European Stagnation Domestic Adjustment Recovery Stagnation
Delayed Domestic Adjustment Delayed Adjustment
In Section 3.2 we outline the key characteristics of these scenarios. In Section 3.3 we describe the methodology we have used to elaborate each of them and Section 3.4 provides an overview of the results of this analysis.
3.2 Three Scenarios
We first consider a scenario where the EU economy returns to growth in the next two years and, as a result, the Irish economy could begin to grow at a reasonable pace over the second half of the decade. Such a course of events would see the burden of the Irish debt falling over time, allowing for further progress in later years. This could lead to a “virtuous circle”, where the growth would help reduce indebtedness and unemployment and these improvements would, in turn, fuel further growth. We refer to this as the Recovery scenario.
the second half of the decade. This action would be taken to forestall an increase in the rate of inflation above its target level in the Eurozone. From an Irish point of view, the return to growth in the European economy would be particularly welcome as the economy is very highly “geared” relative to growth in the world economy, including the European economy (see Chapter 6). If accompanied by an appropriate domestic policy stance, this return to growth would produce a domestic recovery. While interest rates would eventually rise, the negative effects of higher interest rates on the economy would be more than offset by the positive effects of higher world growth.
The second scenario which we consider is also predicated on an EU recovery. However, a range of possible factors could result in such a recovery in the outside world failing to translate into reasonable growth in Ireland. For example, domestic policy mistakes could prevent or delay an Irish recovery. One of the most obvious dangers is a failure by Irish policymakers to tackle effectively the continuing problems in the Irish financial sector. This could result in a shortage of credit preventing a recovery, possibly combined with further losses in the financial system adding to the economy’s woes. Even if domestic policy is successful in tackling these dangers, the continuing problems in the financial sector might prove too difficult to overcome in the next few years. Another possibility is that the tradable sector could suffer a shock, either as a result of changes abroad adversely impacting on the corporation tax regime, or else because of technical change at a world level rendering some key sectors of the economy globally uncompetitive. Finally, hysteresis in the labour market would imply a much slower reduction in unemployment than in the Recovery scenario, with negative consequences for the growth in potential output. To explore the possible impact on the economy of one of these adverse events we examine what we characterise as a Delayed Adjustment scenario. In particular, we consider the effects of a possible failure, for whatever reason, to restore the financial sector to normal working within a reasonable period.
The third scenario which we consider is one where the EU economy, and hence Ireland, stagnates for the rest of the decade. While such an outturn for the EU may be less likely than a return to growth, it still remains a very real possibility. It is such an outturn that we consider in the Stagnation scenario.
(EUROFRAME, 2013). It could also happen due to major problems with the Eurozone financial system, resulting in major credit constraints across the Eurozone. It could also arise because the growth in potential output in the Euro-zone proved to be much lower in the future than was previously anticipated.
In the case of the first two possible reasons for a stagnant Europe, it would be likely that the lack of growth would also be accompanied by low interest rates. Because the Eurozone economy would be operating well below its level of potential output there would be little danger of inflation. For the purpose of this scenario we adopt the third assumption – that the growth in European potential output is close to zero. We implemented this scenario for Europe using the NiGEM world model. Under these circumstances, there would still be a danger of inflation, even with very limited growth and, hence, the ECB would tend to raise interest rates in the medium term. This scenario would also have negative implications for growth in Europe’s major economic partner, the United States. Such a scenario would be particularly unfavourable for Ireland. We use this particular set of external assumptions as a basis for developing a detailed scenario, illustrating what might go wrong in the EU over the rest of the decade, with serious consequences for Ireland.
A further possibility is that the Economic and Monetary Union could collapse. While that might have seemed a real possibility over the last few years, it now looks like an unlikely, though not impossible, outcome. The action of the President of the ECB in July 2012, announcing the ECB’s commitment to taking whatever action was needed to ensure EMU’s survival, has clearly had a very important impact in calming the markets. The reason that a collapse seems unlikely is also that exit for all members could prove very costly (Åslund, 2012; Buiter, 2011). For major creditor countries, such as Germany, their currency would increase in value on exit making them much less competitive. In addition, a significant portion of their financial foreign assets (e.g. credit position with the ECB) would still be denominated in euro whereas their liabilities would be denominated in their new stronger domestic currency. This would mean that exit would be likely to result in an immediate large capital loss denominated in their new domestic currency.
among many others, there is a strong incentive for all members to make EMU work.
A collapse in the euro would have huge knock-on effects on the economy, disrupting normal trading relations. Through its impact on the financial system, a collapse would affect all economic activity. The magnitude and nature of the resulting problems would be likely to be so great that existing models of the economy are not well designed to analyse possible outcomes. As such an event now seems very unlikely (though not impossible), we are not going to try and analyse the possible consequences of a collapse of EMU for Ireland or other countries in any detail in this Review. Suffice it to say that such an outcome would be much worse than even the worst scenario considered here. The obvious implication for policy is that all EU governments should take any necessary action to avoid such a destabilising outcome for all of Europe.
Thus, in this Review we confine ourselves to examining three scenarios for the Irish economy over the rest of the decade. As explained earlier, the likely outturn may be expected to lie in quite a wide range around one of these scenarios. These “ranges” of possible outturns may not overlap in the middle – hence it would not be appropriate to characterise the most likely outturn as some average of these three “equilibrium” scenarios.
3.3 Methodology
In preparing the scenarios in this chapter we have used data based on National Income and Expenditure, 2010 (NIE10). This has proved necessary as a full set of data based on NIE11 was not available when the HERMES model was being estimated in 2012. This means that the data for 2010-12 are not fully updated for recent data revisions. Instead an ad hoc approach has been used in calibrating to the latest national accounts data for 2010-12.
NACE Rev 1 definitions, a substantial proportion of the manufacturing sector’s output is exported as services rather than as merchandise exports.
In presenting the results of the scenarios we generally show detailed numbers to 2020 and discuss these results in the text. The exception is the Delayed Adjustment scenario where we concentrate on the period to 2018 – the period of delayed adjustment. As well as presenting the results to 2020 we provide some summary numbers for the period to 2030 in the Tables. However, while generated by the model, these numbers are clearly very tentative in nature and they are only included to indicate the possible direction of change after 2020.
In preparing these scenarios we have used the latest version of the HERMES macro-economic model for the Irish economy.9 This model is used as a tool to elaborate the basic scenarios. As the model encapsulates very valuable information on how the economy actually behaves, it ensures that the scenarios are generally consistent with economic theory and the latest research on the economy.
The model is first used to prepare preliminary scenarios and then these are modified to take account of a wide range of additional information that has become available since the model and the related national accounts base were finalised. There are aspects of the economy which are not fully incorporated into the HERMES model where the authors’ judgement remains a very important input. In particular, the financial sector is not adequately captured by the latest version of HERMES and additional modelling work has been needed to take account of its role in the development of the economy over time. These insights are then incorporated into a second set of simulations using the model to generate the final scenarios described in this chapter.
Using a formal macroeconomic model, that captures most of the key mechanisms driving the economy, is very important in elaborating medium-term scenarios. It ensures that the scenarios are consistent with economic theory. It also ensures that all the different sectors and variables are internally consistent. Without such a tool these “experiments” in how the economy would behave under different circumstances would have little validity. For example, without a suitable model it would not be possible to estimate the “structural” deficit for a particular year, as is done later in this Review. The new version of HERMES has a number of new or