Original Article
Development and application of a new equation for
estimating energy requirement in metabolic
syndrome in a Chinese population
Yangmei Lv1, Yanxia Miao1, Liangmei Qiao1, Yixin Liu1, Xiaoyan Zhang2, Jinhui Zhang3, Ruijuan Zhang4, Jing
Nan4, Fangfang Chi4, Luqian Zhang4, Ling Zhou4
1Department of Nutrition, Xi’an Central Hospital Affiliated to Xi’an Jiaotong University School of Medicine, Xi’an 710003, China; 2Health Examination Center, Xi’an Central Hospital Affiliated to Xi’an Jiaotong University School of Medicine, Xi’an 710003, China; 3Department of Endocrinology, Xi’an Central Hospital Affiliated to Xi’an Jiaotong University Health Science Center, Xi’an 710003, China; 4School of Public Health, Xi’an Jiaotong University Health Science Center, Xi’an 710061, China
Received November 10, 2016; Accepted February 12, 2017; Epub September 15, 2017; Published September 30, 2017
Abstract: Purpose: A negative energy balance (i.e., daily energy intake less than energy expenditure) is important for dietary interventions in metabolic syndrome (MetS). This study aimed to develop a new energy requirement equa-tion on the basis of negative energy balance to guide dietary intervenequa-tion with MetS. Methods: This study included two phases. First we developed a new equation for the energy requirement in MetS based on the daily total energy expenditure and daily energy reduction corresponding to a 5~10% annual weight loss in 1292 MetS patients.
Second, we randomly assigned 493 MetS patients from the first phase who had greater energy intake than energy
expenditure to three groups, including one experimental group and two control groups. For the experimental group
(group A, n=164), we estimated the energy requirement using the new estimating equation derived from the first
phase, whereas for the control groups, we used either a previously developed energy estimation model for MetS (group B, n=163) or the traditional food exchange method (group C, n=166). Results: After a 6-month intervention,
we observed a significant reduction in weight (73.69±7.25 vs.70.19±6.86 kg), waist circumference (92.42±7.13 vs. 88.58±6.75 cm), 2-h postprandial blood glucose (10.63±5.41 vs. 7.53±4.26 mmol/L), and triglyceride level (2.92±1.45 vs. 1.44±1.12 mmol/L) in patients of group A, in parallel with a reduction in energy intake (9.30±2.79 vs. 6.70±1.85 MJ/d). All these changes were significantly different from the measurements in groups B and C over
the same period (P<0.05). Conclusion: A new energy requirement equation based on a negative energy balance im-proves the effect of dietary intervention on weight, waist circumference, glucose, and triglycerides in MetS patients. Keywords: Metabolic syndrome, energy intake, energy expenditure, negative energy balance, equation, dietary intervention
Introduction
Metabolic syndrome (MetS) is a cluster of inter-related cardiometabolic risk factors that are closely related to increased cardiovascular morbidity and mortality [1-3]. Abdominal obesi-ty, dyslipidemia, high blood pressure, and dys-glycemia are generally regarded as the main components of MetS [4]. With the progress of urbanization, excessive energy intake, changes in lifestyle, and the increasing obesity preva-lence, MetS has emerged as a global epidemic, becoming a public health threat worldwide. In China, the current prevalence of MetS is
great-for MetS are actually aimed at controlling the main components of MetS, such as dyslipid-emia, high blood pressure, and hyperglycemia [6].
[12, 13]. The most commonly used energy cal-culation formula for MetS patients is the food exchange method for diabetics [14]. This meth-od, however, does not take into account gender and age, and thus, gives the same energy requirement for a 30-year-old man and an 80-year-old woman as long as they have the same standard weight, body shape, and physi-cal activity levels. The lack of an individualized calculation method results in poor clinical con-trol of lipid metabolism and glucose meta- bolism.
In a previous study, we explored a new energy calculation model for MetS [15], which improves the management of waist circumference, blood glucose, and insulin resistance index among MetS patients in clinical practice. However, we observed several limitations of the model in further clinical research. First, body mass index (BMI), calculated as body weight (kg) divided by squared height (m), was included in the model as a predictor of energy requirement. This reduced the influence of height, and thus, com-promised the sensitivity of the model to height. Second, ambient temperature was taken into account in the model. However, with the wide use of air conditioners, the impact of the ambi-ent temperature on MetS patiambi-ents’ energy requirement is reduced and may even be negligible.
The current study was carried out to improve the estimation of the energy requirement in patients with MetS, incorporating the concept of negative energy balance. Healthy body weight is maintained by a balance between daily energy intake and energy expenditure. Among MetS patients, energy intake is usually greater than energy expenditure, so the body is in positive energy balance. In this condition, excessive energy accumulates in the abdomen in the form of fat. Therefore, the International Diabetes Federation (IDF) recommends that a healthy lifestyle with moderate energy restric-tion to achieve 5-10% weight loss in the first year should be the primary intervention for MetS patients [16].
In this study, we aimed to develop a new equa-tion for estimating the energy requirement with MetS based on the principle of negative energy balance and to evaluate its utility in compari-son with our previous model and the widely used food exchange method for diabetics in a clinical study.
Methods
Part I. Development of a new energy require
-ment equation in MetS patients
Study population: A total of 1292 MetS patients
were recruited between January 2007 and June 2014 from the Health Examination Center, the Department of Endocrinology, and the Department of Nutrition of Xi’an Central Hospital affiliated with Xi’an Jiaotong University. All the MetS cases were diagnosed according to the diagnostic criteria described in a clinical guideline from the Chinese Diabetes Society [17]. A clinical diagnosis of MetS was made if three or more of the following five criteria were met: (1) abdominal obesity: waist circumfer-ence ≥90 cm in men or ≥85 cm in women; (2) hyperglycemia: fasting plasma glucose (FPG) ≥6.1 mmol/L or blood glucose level 2 h after glucose load ≥7.8 mmol/L, or previous diagno-sis and treatment of diabetes; (3) high blood pressure: blood pressure ≥130/85 mmHg (1 mmHg=0.133 kPa), or previous diagnosis and treatment of hypertension; (4) elevated level of triglycerides (TG): fasting TG ≥1.70 mmol/L; and (5) reduced level of high-density lipopro-tein cholesterol (HDL-C): fasting HDL-C <1.04 mmol/L. The Xi’an Central Hospital affiliated with Xi’an Jiaotong University’s Ethics Com- mittee approved the study protocol, and all par-ticipants provided written informed consent. Demographic and clinical data, including age, gender, education, occupation, duration of dis-ease, height, weight, waist circumference, physical labor, and medication history were col-lected. The types and amounts of individual foods consumed during two week days and one weekend day were also assessed using the food frequency questionnaire (FFQ) and the 24-h dietary recall method, and total energy intake was calculated.
Estimation of daily total energy expenditure
and energy requirement: We first estimated the
absorb food) was assumed to be 10% of the total energy expenditure in all adults consum-ing a mixed diet [19]. The daily total energy expenditure was calculated as: daily total ener-gy expenditure=basic enerener-gy expenditure ×1.1+ energy expenditure during physical activity.
Next, we estimated daily energy reduction. The IDF recommends a 5~10% weight loss in the first year for MetS patients [16]. Accordingly, we set the goal of weight loss as 10% of the initial body weight within 1 year for MetS patients who were obese (BMI >28.0 kg/m2), 7.5% for
MetS patients who were moderately overweight (BMI: 26.0~27.9 kg/m2), and 5% for MetS
patients who were mildly overweight (BMI: 24.0~25.9 kg/m2).
Given that a 1-kg body weight reduction equates to an energy expenditure of 29.29 MJ [20], we calculated the amount of daily energy reduction according to the weight loss goal for each participant.
As a result, the daily energy requirement of MetS patients for negative energy balance was estimated as: the daily energy requirement for negative energy balance=daily total energy expenditure-daily energy reduction.
Data analysis: We analyzed the determinants
of the daily energy requirement in MetS patients for negative energy balance using a multivari-able linear regression analysis. We included the daily energy requirement of MetS patients for negative energy balance as the dependent variable, and the potential factors, such as age (year), gender (female=0, male=1), height (cm), weight (kg), waist circumference (cm), and types of physical labor (low physical labor=0, moderate physical labor=1) as independent variables. Data analysis was performed using SPSS software version 15.0 (Chicago, IL, USA).
Part II. Application of the new energy require
-ment equation in MetS patients
Study population: To evaluate the clinical utility
of the new energy requirement equation taking negative energy balance into account, we con-ducted an intervention study between July 2014 and August 2015 among 493 MetS patients from participants in the first phase. Patients who had chronic complications of dia-betes (e.g., diabetic nephropathy, diabetic
reti-nopathy, and diabetic peripheral neuropathy) and other chronic diseases (e.g., chronic liver disease, kidney diseases, and endocrine dis-eases) were excluded.
This study was approved by the Ethics Com- mittee of the Xi’an Central Hospital affiliated with Xi’an Jiaotong University. Before participat-ing in the study, the subjects and their families were informed of the importance of diet in the prevention of MetS treatment and which exami-nations and tests would be conducted during the study. All the patients signed a written informed consent form. Throughout the study, the patients’ privacy and treatment information were protected.
Randomization and intervention: Using
All three groups were given the same instruc-tions regarding physical activity and pharma-ceutical treatments.
Follow-up and data collection: Telephone
fol-low-up was done in the first week after patients were discharged from the hospital, and then telephone follow-up was done every 2 weeks for the first 6 months. If patients had any ques-tions, they could contact the dietitian or the specialty nurse as needed. At the 6th month, patients returned to the hospital for a face-to-face interview and health examination.
The participants provided information on their age, gender, education level, and medical his-tory in a questionnaire. Anthropometric mea-sures, including height, weight, and waist cir-cumference, were conducted using standard-ized methods. Body mass index (BMI) was cal-culated as body weight (kg) divided by the square of height (m). Blood pressure was mea-sured using a desktop mercury sphygmoma-nometer, according to an international stan-dardized method. Basal energy expenditure was measured in the morning using a Cardio- pulmonary Exercise Testing System (COSMED, Italy), when the participant was awake, fasting, quiet, supine, and without mental stress, and the room temperature was between 20-25°C. The food frequency questionnaire (FFQ) and the 24-h dietary recall method were used to collect information on the types and amounts of foods consumed in 3 consecutive days (2 weekdays
ing plasma glucose (FPG) was measured using the glucose oxidase method, triglycerides (TG) using the glycerol phosphate oxidase (GPO)-peroxi- dase (POD) method, and high-density lipopro-tein cholesterol (HDL-C) using the dextran sul-fate-magnesium precipitation method, all on an Olympus AU 600 biochemistry analyzer (Hitachi, Japan). Glycated hemoglobin (HbA1C) was measured by high pressure liquid chroma-tography with the Bio-Rad D-10 automatic gly-cated hemoglobin analyzer (Bio-Rad, USA), with the accompanying reagents (Bio-Rad, USA). Data analysis: After double entry, all the data were checked and analyzed using SPSS soft-ware version 15.0 (Chicago, IL, USA). Variables were analyzed for inter-group differences. Fisher χ2 test was used to compare categorical
data between two or among three groups. When comparing data with normal distribution between different periods of the same group, the paired t-test was used, and analysis of vari-ance was used when comparing data with nor-mal distribution between the same periods of three groups. P<0.05 was considered statisti-cally significant.
Results
Development of the new energy requirement equation for MetS patients
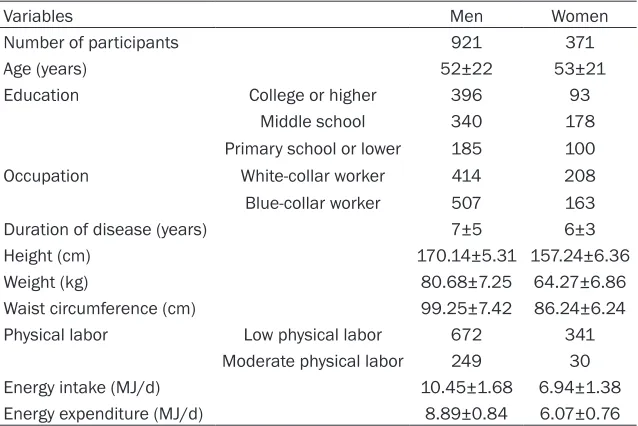
[image:4.612.91.410.96.309.2]We included 1292 patients with MetS (921 men, average age 52±22 years; 371 women, average age 53±21 years) in the phase of
Table 1. Characteristics of participants in Part I (development of new
en-ergy requirement equation)
Variables Men Women
Number of participants 921 371
Age (years) 52±22 53±21
Education College or higher 396 93
Middle school 340 178
Primary school or lower 185 100
Occupation White-collar worker 414 208
Blue-collar worker 507 163
Duration of disease (years) 7±5 6±3
Height (cm) 170.14±5.31 157.24±6.36
Weight (kg) 80.68±7.25 64.27±6.86
Waist circumference (cm) 99.25±7.42 86.24±6.24
Physical labor Low physical labor 672 341
Moderate physical labor 249 30
Energy intake (MJ/d) 10.45±1.68 6.94±1.38
Energy expenditure (MJ/d) 8.89±0.84 6.07±0.76
developing the new energy requirement equa-tion. The average height, weight, and waist cir-cumference were 170.14±5.31 cm, 80.68±7.25 kg, and 99.25±7.42 cm, respectively, among men and 157.24±6.36 cm, 64.27±6.86 kg, and 86.24±6.24 cm, respectively, among wo- men. The energy intake and energy expendi-ture (MJ/d) were 10.45±1.68 MJ and 8.89± 0.84 MJ, respectively, among men and 6.94± 1.38 MJ and 6.07±0.76 MJ, respectively, among women (Table 1).
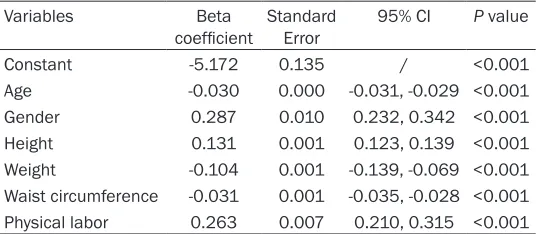
In the linear regression model, we found signifi-cant associations between the daily energy requirement and several variables: age (B=-0.030, 95% confidence interval [CI]: -0.031~-0.029), gender (B=0.287, 95% CI: 0.232~ 0.342), height (B=0.131, 95% CI: 0.123~0.139), weight (B=-0.104, 95% CI: -0.139~-0.069), waist circumference (B=-0.031, 95% CI: -0.035~-0.028), and physical labor (B=0.263, 95% CI: 0.210~0.315; Table 2). Accordingly, we derived the daily energy requirement equation for MetS patients for negative energy balance as follows: the daily energy requirement
tion [15] and the traditional estimation method [14]. There were no significant differences across the groups for other variables, such as blood pressure or HDL-C level (Table 4).
(1) Change in weight: Before the study, the aver-age weights of groups A, B, and C were 73.69±7.25, 73.26±5.57, and 73.23±5.86 kg/ m2, respectively, and there was no significant
difference among them (P>0.05). At 6 months after the study, the weight of group C had not changed significantly (72.98±5.67 kg, P>0.05), whereas the weights of groups A and B were decreased significantly (group A: 70.19±6.86 kg, P<0.05; group B: 71.27±6.31 kg, P<0.05). The weight of group A was significantly lower than those of groups B and C. (2) Change in BMI: Before the study, the average BMIs of groups A, B, and C were 27.40±2.34, 27.26± 2.42, and 27.75±2.63 kg/m2, respectively, and
there was no significant difference among them (P>0.05). At 6 months after the study, the BMI of group C had not changed significantly (27.66±2.53 kg/m2, P>0.05), whereas the
BMIs of groups A and B were decreased
signifi-Table 2. Variables and respective beta coefficients in the
de-rived new energy requirement equation
Variables Beta
coefficient Standard Error 95% CI P value
Constant -5.172 0.135 / <0.001
Age -0.030 0.000 -0.031, -0.029 <0.001 Gender 0.287 0.010 0.232, 0.342 <0.001 Height 0.131 0.001 0.123, 0.139 <0.001 Weight -0.104 0.001 -0.139, -0.069 <0.001 Waist circumference -0.031 0.001 -0.035, -0.028 <0.001 Physical labor 0.263 0.007 0.210, 0.315 <0.001
[image:5.612.91.359.96.213.2]Dependent variable: the daily energy requirement.
Table 3. Baseline characteristics of participants in Part II
(ap-plication of the new energy requirement equation)
Variables Group A
(n=164) Group B (n=163) (n=166)Group C
Age (years) 56±8 58±5 57±7
Gender (Male/Female) 105/59 111/52 104/62 Education (C/M/P)* 27/96/41 24/100/39 28/103/35
Duration of disease (years) 4.2±3.1 4.8±3.7 4.4±3.2
Occupation (W/B)# 116/48 113/50 122/44
There were no significant differences among groups in age, gender, educa -tion, and occupation (P>0.05). *For educational level: C, College or higher; M, Middle school; P, Primary school or lower. #For occupation: W, white-collar worker; B, blue-collar worker.
=-0.030× age +0.287× gender +0.131× height -0.104× weight -0.031× waist circumference +0.263× physical labor -5.172. The range of the daily energy requirement was set between 4.18 and 8.79 MJ [15].
Application of the new energy re
-quirement equation for diet inter
[image:5.612.90.358.274.363.2]-vention among MetS patients
Table 3 shows baseline
equa-cantly (group A: 25.31±2.12 kg/m2, P<0.05;
group B: 26.63±3.21 kg/m2, P<0.05). The BMI
of group A was significantly lower than those of groups B and C. (3) Change in waist circumfer-ence: Before the study, the waist circumference values for groups A, B, and C were 92.42±7.13, 93.21±6.45, and 92.68±6.21 cm, respectively, and there was no significant difference among them (P>0.05). At 6 months after the study, the waist circumference of group C had not changed significantly (91.78±5.90 cm, P>0.05), where-as the waist circumference mewhere-asurements of groups A and B had decreased significantly (group A: 88.58±6.75 cm, P<0.05; group B: 91.46±5.22 cm, P<0.05). The waist circumfer-ence values for groups A and B were significant-ly lower than that for group C (P<0.05), whereas the waist circumference of group A was signifi-cantly lower than that of group B (P<0.05). (4) Change in FPG: Before the study, the FPG val-ues of groups A, B, and C were 7.36±4.89, 7.11±2.87, and 7.83±3.26 mmol/L, respective-ly, and there was no significant difference among them (P>0.05). At 6 months after the intervention, the FPG value of group C had not changed significantly (7.21±2.36 mmol/L, P>0.05), whereas the FPG levels of groups A and B had decreased significantly (group A: 5.82±3.26 mmol/L, P<0.05; group B: 5.57± 3.73 mmol/L, P<0.05). The FPG values for groups A and B were significantly lower than that of group C (P<0.05). (5) Change in 2-h
[image:6.612.94.522.96.294.2]postprandial blood glucose: Before the study, the 2-h postprandial blood glucose levels of groups A, B, and C were 10.63±5.41, 10.46± 5.24, and 10.51±4.73 mmol/L, respectively, and there was no significant difference among them (P>0.05). At 6 months after the study, 2-h postprandial blood glucose levels for the three groups all had decreased significantly (group A: 7.53±4.26 mmol/L, P<0.05; group B: 8.76± 4.32 mmol/L, P<0.05; group C: 9.12±4.63 mmol/L, P<0.05). The 2-h postprandial blood glucose level of group A was significantly lower than those of groups B and C (P<0.05). (6) Change in HbA1c: Before the study, the HbA1c levels of groups A, B, and C were 6.78±1.63%, 6.67±1.76%, and 6.72±1.92%, respectively, and there was no significant difference among them (P>0.05). At 6 months after the study, the HbA1c level of group C had not changed signifi-cantly (6.42±2.84%, P>0.05), whereas the HbA1c levels of groups A and B had decreased significantly (group A: 5.12±1.54%, P< 0.05; group B: 5.49±1.87%, P<0.05). The HbA1c lev-els of groups A and B were significantly lower than that of group C (P<0.05). (7) Change in TG: Before the study, the TG levels of groups A, B, and C were 2.92±1.45, 2.89±1.53, and 2.86±1 .36 mmol/L, respectively, and there was no sig-nificant difference among them (P>0.05). At 6 months after the study, the TG of groups B and C had not changed significantly (group B: 2.42±1.12 mmol/L, P>0.05; group C: 2.67±
Table 4. Cardiometabolic markers and energy balance in MetS patients before and 6 months after
the intervention
Variables Group A Group B Group C
Before After Before After Before After
Weight (kg) 73.69±7.25 70.19±6.86#,*,Δ 73.26±5.57 71.27±6.31#,Δ 73.23±5.86 72.98±5.67
BMI (kg/m2) 27.40±2.34 25.31±2.12#,*,Δ 27.26±2.42 26.63±3.21#,Δ 27.75±2.63 27.66±2.53
Waist circumference (cm) 92.42±7.13 88.58±6.75#,*,Δ 93.21±6.45 91.46±5.22#,Δ 92.68±6.21 91.78±5.90
Neck circumference (cm) 37.34±3.57 37.32±2.75 38.33±3.89 37.12±3.67 37.09±2.35 37.56±1.78
FPG (mmol/L) 7.36±4.89 5.82±3.26#,Δ 7.11±2.87 5.57±3.73#,Δ 7.83±3.26 7.21±2.36
2-h postprandial glucose (mmol/L) 10.63±5.41 7.53±4.26#,*,Δ 10.46±5.24 8.76±4.32# 10.51±4.73 9.12±4.63#
HbA1c (%) 6.78±1.63 5.12±1.54#,Δ 6.67±1.76 5.49±1.87#,Δ 6.72±1.92 6.42±2.84
Systolic blood pressure (mmHg) 132±14 130±17 133±14 131±11 134±21 133±18
Diastolic blood pressure (mmHg) 83±14 78±13 81±17 80±14 81±18 82±10
CHO (mmol/L) 5.21±1.80 5.78±1.25 5.24±1.85 5.89±1.13 5.33±1.25 5.63±1.85
TG (mmol/L) 2.92±1.45 1.44±1.12#,*,Δ 2.89±1.53 2.42±1.12 2.86±1.36 2.67±1.25
HDL-C (mmol/L) 1.21±0.64 1.24±0.46 1.24±0.38 1.44±0.83 1.19±0.63 1.26±0.46
LDL-C (mmol/L) 3.58±1.53 3.13±0.89 3.72±1.24 3.41±1.46 3.70±1.31 3.46±1.73
1.25 mmol/L, P>0.05), whereas the TG of group A was decreased significantly (1.44±1.12 mmol/L, P<0.05). The TG levels of group A were significantly lower than those of groups B and C (P<0.05).
In terms of dietary changes, we observed sig-nificant reductions in energy intake, fat intake, and carbohydrate intake among MetS patients whose energy requirements were estimated using the new equation, in comparison with our previous equation [15] and the traditional esti-mation method [14]. There were no significant differences across the groups for other vari-ables, such as protein or energy expenditure (Table 5).
(1) Change in energy intake: Before the study, energy intakes for groups A, B, and C were 9.30±2.79, 9.54±2.24, and 9.36±2.53 MJ, respectively, and there was no significant differ-ence among them (P>0.05). At 6 months after the study, the energy intake of group C had not changed significantly (8.81±2.21 MJ, P>0.05), whereas the energy intake of groups A and B had decreased significantly (group A: 6.70±1.85 MJ, P<0.05; group B: 7.05±1.64 MJ, P<0.05). The energy intake values for groups A and B were significantly lower than that of group C (P<0.05), and the energy intake of group A was significantly lower than that of group B (P<0.05). (2) Change in fat: Before the study, the fat intake values for groups A, B, and C were 78.52±22.72, 79.52±23.79, and 76.78±20.75 g, respectively, and there was no significant dif-ference among them (P>0.05). At 6 months after the study, the fat intake values of groups A, B, and C had decreased significantly (group A: 50.68±17.67 g, P<0.05; group B: 60.21± 14.42 g, P<0.05; group C: 63.51±16.86 g,
P<0.05). The fat intake value for group A was significantly lower than those of groups B and C (P<0.05). (3) Change in energy proportion of carbohydrates: Before the study, the energy pro- portions of carbohydrates for groups A. B, and C were 57.60±8.64%, 57.85±10.37%, and 57.75±10.26%, respectively, and there was no significant difference among them (P>0.05). At 6 months after the study, the energy propor-tions of carbohydrates for groups A, B, and C had decreased significantly (group A: 53.78± 7.57%, P<0.05; group B: 53.97±6.69%, P<0.05; group C: 54.98±9.36%, P<0.05). The energy proportions of carbohydrates for groups A and B were significantly lower than that for group C (P<0.05). (4) Change in carbohydrate intake: Before the study, the carbohydrate intake val-ues for groups A, B, and C were 317.46±68.97, 325.90±66.46, and 328.75±66.35 g, respec-tively, and there was no significant difference among them (P>0.05). At 6 months after the study, the carbohydrate intake values of groups A, B, and C had decreased significantly (group A: 229.57±47.97 g, P<0.05; group B: 232.56± 41.86 g, P<0.05; group C: 255.68±64.64 g, P<0.05). The carbohydrate intake values for groups A and B were significantly lower than that for group C (P<0.05).
Discussion
[image:7.612.91.524.84.213.2]In this study, we developed a new method, on the basis of negative energy balance, to esti-mate energy requirement for MetS patients. We found that dietary intervention guided by the new energy requirement equation improved weight, BMI, waist circumference, FPG, 2-h postprandial blood glucose, HbA1c, and TG in MetS patients, compared to conventional approaches.
Table 5. Energy and nutrient intake and energy expenditure in patients with metabolic syndrome
Variables Group A Group B Group C
Before After Before After Before After
Energy intake (MJ/d) 9.30±2.79 6.70±1.85#,*,Δ 9.54±2.24 7.05±1.64#,Δ 9.36±2.53 8.81±2.21
Protein (%) 13.04±2.68 13.55±2.59 12.36±2.38 13.59±2.52 12.37±2.39 12.15±2.59
Protein (g) 63.40±13.42 67.56±11.86 62.78±14.29 66.79±10.64 65.79±15.63 65.58±12.85
Fat (%) 31.59±8.64 27.76±7.64 31.68±10.69 31.76±7.97 30.98±10.53 30.61±11.35
Fat (g) 78.52±22.72 50.68±17.67#,Δ 79.52±23.79 60.21±14.42#,Δ 76.78±20.75 63.51±16.86# Carbohydrate (%) 57.60±8.64 53.78±7.57#,Δ 57.85±10.37 53.97±6.69#,Δ 57.75±10.26 54.98±9.36# Carbohydrate (g) 317.46±68.97 229.57±47.97#,Δ 325.90±66.46 232.56±41.86#,Δ 328.75±66.35 255.68±64.64# Total energy expenditure (MJ/d) 7.90±1.85 7.67±2.53 7.86±2.54 7.78±1.95 7.94±2.57 7.85±2.24 Physical activity expenditure (MJ/d) 1.61±0.85 1.65±0.85 1.62±0.85 1.67±0.85 1.59±0.85 1.64±0.85 #indicates P<0.05 comparing the variable before and at 6 months after the intervention within each group; *indicates P<0.05 comparing the variable between groups A
Negative energy balance achieved through decreasing energy intake and/or increasing energy expenditure is critical in achieving and maintaining healthy weight [22, 23]. An accu-rate determination of energy requirement requires comprehensive consideration about variations in gender, age, height, weight, and physical activity among the population. For nor-mal-weight healthy adults, their energy intake should be equal to their energy expenditure, which means that they should be in a balanced energy state. Therefore, their energy require-ments can be estimated as equivalent to their total energy expenditure [24]. In the Dietary Reference Intakes (DRIs) for the United States and Canada, the recommended energy require-ment was determined on the basis of total energy expenditure measured by a double-labeled water method in normal-weight healthy adults [25]. In the DRIs from Japan [26] and Europe [27], the energy requirement was esti-mated using the factorial approach method, which multiplies basal metabolic rate (BMR) by physical activity level (PAL). However, there is no specific guidance for MetS patients, for whom energy control is critical. The most com-monly used energy calculation method for MetS is the diabetic food exchange method [14]. However, this method does not take into account gender or age, and thus, lacks individu-ality. We previously developed an individualized method to estimate the energy requirement in MetS patients [15]. However, there were also some problems in clinical practice. For exam-ple, BMI was included in the model as an inde-pendent factor, which reduced the sensitivity of the model to height. In this study, several improvements were made in the estimation equation: First, BMI was replaced by height and weight, increasing the sensitivity to height in the formula. Second, we removed the ambient temperature from the previous equation, because the ambient temperature in most con-temporary working and living environments is well-controlled by air conditioners, resulting in a minimal impact on energy expenditure by MetS patients.
To establish a new energy requirement equa-tion, this study considered the following points in the study design. First, waist circumference is negatively associated with energy require-ment, and obesity and insulin resistance are considered core features of Me tS [28]. Waist
circumference can reflect the extent of abdomi-nal fat deposition, and accumulation of trunk fat is an important risk factor for MetS [29]. Among a variety of diagnostic criteria for MetS, abdominal obesity is considered one of the main diagnostic criteria, because it is more rel-evant to the risk of metabolic disorders than general obesity. Abdominal obesity is more prominent in Asians, including the Chinese and Japanese populations, and abdominal obesity often exists even in people with normal weight. Therefore, MetS may develop among normal weight people with increased waist circumfer-ence [30]. For this reason, waist circumfercircumfer-ence was included in the new calculation method, and we found that abdominal fat was negatively associated with energy intake in our study pop-ulation. Second, age is negatively associated with energy requirement. Age is an indepen-dent factor in resting energy expenditure (REE), and REE is less in middle-aged and elderly peo-ple than in young peopeo-ple [31]. Also, a person’s appetite, amount of food intake, and digestive capacity decline with advancing age. Third, the energy requirement is greater in men than in women. Women usually have a lower REE than men [32, 33]. Fourth, when categorizing the types of physical labor in MetS patients, we included “light physical labor” and “moderate physical labor” but omitted “heavy physical labor”. This is because heavy physical labor, which was performed by some workers in the past, is hardly performed in the contemporary population, as modern tools and machines are increasingly used in industrial and agricultural production. The vast majority of MetS patients in our study population does not engage in heavy physical labor.
metabolic disorders, such as hyperglycemia, dyslipidemia, and hypertension, in individuals with MetS [37]. Meta-analyses of randomized controlled trials have demonstrated that life-style modification is effective for improving metabolic parameters for MetS [38, 39]. Based on compelling evidence from randomized con-trolled trials showing that lifestyle intervention prevents or delays the incidence of diabetes among high-risk individuals with impaired glu-cose tolerance [40-44], it is possible that life-style intervention is effective for reducing the risk of developing diabetes among patients with MetS.
A major strength of the current study lies in the fact that we have focused the intervention strategy on negative energy balance. It is clear that MetS develops at least partly because the energy intake is greater than the energy expen-diture. Only when negative energy balance is established can the various cardiometabolic disorders of MetS be ameliorated. Our results from the dietary intervention support this. In addition, we chose the control group (group C) as the intervention based on the traditional food exchange method. We are aware that many previous studies of dietary intervention in MetS had a non-dietary intervention as the control group. Such a comparative effective-ness assessment in our study will help facili-tate direct translation of our results into clinical practice. Furthermore, we also included a group (group B) based on our previous model for ener-gy requirement estimation, and we found that the new model developed in this study had even better performance compared with our previous model. This study has limitations because of the limited duration of follow-up and sample size, which may reduce the statisti-cal power for identifying significant findings. For instance, we observed suggestive evidence for an increase in HDL-C and a decrease in low-density lipoprotein-cholesterol (LDL-C) in the intervention groups, but the changes were not statistically significant. It is possible that a lon-ger duration of follow-up with a larlon-ger sample size are needed to observe significant changes in these indicators.
In conclusion, a new energy requirement equa-tion on the basis of negative energy balance improves the effectiveness of a dietary inter-vention for reducing body weight, glucose lev-els, and triglyceride levels for MetS patients.
Whether these effects translate into a long-term reduction in clinical outcomes among MetS patients warrants further investigation.
Acknowledgements
The present study was supported by the National Natural Science Foundation of China (No. 81273051).
Disclosure of conflict of interest
None.
Address correspondence to: Yangmei Lv, Depart-
ment of Nutrition, Xi’an Central Hospital Affiliated to Xi’an Jiaotong University School of Medicine, Xi’an
710003, China. E-mail: [email protected]
References
[1] Lakka HM, Laaksonen DE, Lakka TA, Niskanen LK, Kumpusalo E, Tuomilehto J and Salonen JT. The metabolic syndrome and total and cardio-vascular disease mortality in middle-aged
men. JAMA 2002; 288: 2709-2716.
[2] Wilson PW, D’Agostino RB, Parise H, Sullivan L and Meigs JB. Metabolic syndrome as a pre-cursor of cardiovascular disease and type 2 diabetes mellitus. Circulation 2005; 112: 3066-3072.
[3] Kang GD, Guo L, Guo ZR, Hu XS, Wu M and Yang HT. Continuous metabolic syndrome risk score for predicting cardiovascular disease in the Chinese population. Asia Pac J Clin Nutr
2012; 21: 88-96.
[4] Kassi E, Pervanidou P, Kaltsas G and Chrousos
G. Metabolic syndrome: definitions and contro
-versies. BMC Med 2011; 9: 48.
[5] Gu D, Reynolds K, Wu X, Chen J, Duan X, Reynolds RF, Whelton PK, He J; InterASIA Collaborative Group. Prevalence of the meta-bolic syndrome and overweight among adults
in China. Lancet 2005; 365: 1398-1405.
[6] Aydin S, Aksoy A, Aydin S, Kalayci M, Yilmaz M, Kuloglu T, Citil C and Catak Z. Today’s and yes-terday’s of pathophysiology: biochemistry of metabolic syndrome and animal models. Nutrition 2014; 30: 1-9.
[7] Jimenez-Gomez Y, Marin C, Peerez-Martinez P, Hartwich J, Malczewska-Malec M, Golabek I, Kiec-Wilk B, Cruz-Teno C, Rodriguez F, Gomez P, Gomez-Luna MJ, Defoort C, Gibney MJ, Perez-Jimenez F, Roche HM and Lopez-Miranda J. A low-fat, high-complex carbohy-drate diet supplemented with long-chain (n-3) fatty acids alters the postprandial lipoprotein
profile in patients with metabolic syndrome. J
[8] Amini M, Esmaillzadeh A, Shafaeizadeh S, Behrooz J and Zare M. Relationship between major dietary patterns and metabolic syn-drome among individuals with impaired
glu-cose tolerance. Nutrition 2010; 26: 986-992.
[9] Aadahl M, von Huth Smith L, Pisinger C, Toft
UN, Glumer C, Borch-Johnsen K and Jorgensen
T. Five-year change in physical activity is asso-ciated with changes in cardiovascular disease risk factors: the Inter99 study. Prev Med 2009;
48: 326-331.
[10] National Cholesterol Education Program Expert Panel on Detection, Evaluation, and Treatment of High Blood Cholesterol in Adults (Adult Treatment Panel III). Third Report of the National Cholesterol Education Program (NCEP) Expert Panel on Detection, Evaluation, and Treatment of High Blood Cholesterol in
Adults (Adult Treatment Panel III) final report.
Circulation 2002; 106: 3143-3421.
[11] Mendoza JA, Drewnowski A and Christakis DA. Dietary energy density is associated with
obe-sity and the metabolic syndrome in U.S. adults.
Diabetes Care 2007; 30: 974-979.
[12] Epstein CD, Peerless JR, Martin JE and Malangoni MA. Comparison of methods of measurements of oxygen consumption in me-chanically ventilated patients with multiple
trauma: the fick method versus indirect calo
-rimetry. Crit Care Med 2000; 28: 1363-1369.
[13] Gibney ER. Energy expenditure in disease: time to revisit? Proc Nutr Soc 2000; 59: 199-207.
[14] Zhu LZ, Wu KM, Feng ZY and Lu MM. Effects of dietary intervention on dietary behaviors in community patients with metabolic syndrome. Shanghai Journal of Preventive Medicine
2005; 17: 8-10.
[15] Yangmei L, Yanxia M, Liangmei Q, Jinhui Z, Yu H and Minwen Z. Controlling energetic intake based on a novel logistic regression model for the metabolic syndrome in a Chinese popula-tion. Br J Nutr 2011; 105: 256-262.
[16] Alberti KG, Zimmet P and Shaw J. The
meta-bolic syndrome--a new worldwide definition.
Lancet 2005; 366: 1059-1062.
[17] Chinese Diabetes Society. Clinical guidelines for type 2 diabetes in China (2013). Chinese Journal of Diabetes 2014; 7: 476-477.
[18] Craig CL, Marshall AL, Sjostrom M, Bauman AE, Booth ML, Ainsworth BE, Pratt M, Ekelund
U, Yngve A, Sallis JF and Oja P. International
physical activity questionnaire: 12-country reli-ability and validity. Med Sci Sports Exerc 2003;
35: 1381-1395.
[19] Nutrition CSo (2014) chinese dietary reference intakes 2013. Science Press.
[20] K G. Chinese encyclopedia of nutritional sci-ence. Beijing: People’s Medical Publishing House; 2004.
[21] Lv YM. Healthful lifestyle and standardized nu-trition therapy for metabolic syndrome. Shaanxi: Shaanxi Science and Technology Press; 2010.
[22] Wing RR and Hill JO. Successful weight loss maintenance. Annu Rev Nutr 2001; 21: 323-341.
[23] Martinez JA, Navas-Carretero S, Saris WH and Astrup A. Personalized weight loss strategies-the role of macronutrient distribution. Nat Rev Endocrinol 2014; 10: 749-760.
[24] Chinese Nutrition Society. Chinese dietary ref-erence intakes (2013). Beijing: Science Press; 2014.
[25] Schoeller DA. Measurement of energy expendi-ture in free-living humans by using doubly
la-beled water. J Nutr 1988; 118: 1278-1289.
[26] Sasaki S. Dietary Reference Intakes (DRIs) in
Japan. Asia Pac J Clin Nutr 2008; 17 Suppl 2:
420-444.
[27] European Food Safety Authority (EFSA) Panel
on Dietetic Products NaAN. Scientific opinion
on principles for deriving and applying dietary
reference values. EFSA Journal 2010; 8: 1458. [28] Andersen CJ and Fernandez ML. Dietary strate-gies to reduce metabolic syndrome. Rev Endocr Metab Disord 2013; 14: 241-254. [29] Chuang HH, Li WC, Sheu BF, Liao SC, Chen JY,
Chang KC and Tsai YW. Correlation between body composition and risk factors for cardio-vascular disease and metabolic syndrome.
Biofactors 2012; 38: 284-291.
[30] Cheng Y, Zhang H, Chen R, Yang F, Li W, Chen L, Lin S, Liang G, Cai D and Chen H. Cardio-
metabolic risk profiles associated with chronic
complications in overweight and obese type 2 diabetes patients in South China. PLoS One
2014; 9: e101289.
[31] Ferreira I, Beijers HJ, Schouten F, Smulders YM, Twisk JW and Stehouwer CD. Clustering of metabolic syndrome traits is associated with maladaptive carotid remodeling and stiffening: a 6-year longitudinal study. Hypertension 2012; 60: 542-549.
[32] Ferraro R, Lillioja S, Fontvieille AM, Rising R, Bogardus C and Ravussin E. Lower sedentary metabolic rate in women compared with men.
J Clin Invest 1992; 90: 780-784.
[33] Arciero PJ, Goran MI and Poehlman ET. Resting metabolic rate is lower in women than in men.
J Appl Physiol (1985) 1993; 75: 2514-2520.
[34] Grundy SM. Hypertriglyceridemia, insulin resis-tance, and the metabolic syndrome. Am J
Cardiol 1999; 83: 25F-29F.
[35] Rader DJ. Effect of insulin resistance, dyslipid-emia, and intra-abdominal adiposity on the development of cardiovascular disease and diabetes mellitus. Am J Med 2007; 120:
[36] Assali AR, Ganor A, Beigel Y, Shafer Z, Hershcovici T and Fainaru M. Insulin resis-tance in obesity: body-weight or energy
bal-ance? J Endocrinol 2001; 171: 293-298.
[37] Shenoy SF, Poston WS, Reeves RS, Kazaks AG, Holt RR, Keen CL, Chen HJ, Haddock CK, Winters BL, Khoo CS and Foreyt JP. Weight loss in individuals with metabolic syndrome given DASH diet counseling when provided a low so-dium vegetable juice: a randomized controlled
trial. Nutr J 2010; 9: 8.
[38] Yamaoka K and Tango T. Effects of lifestyle
modification on metabolic syndrome: a sys -tematic review and meta-analysis. BMC Med
2012; 10: 138.
[39] Bassi N, Karagodin I, Wang S, Vassallo P,
Priyanath A, Massaro E and Stone NJ. Lifestyle
modification for metabolic syndrome: a sys -tematic review. Am J Med 2014; 127: 1242 e1241-1210.
[40] Pan XR, Li GW, Hu YH, Wang JX, Yang WY, An ZX, Hu ZX, Lin J, Xiao JZ, Cao HB, Liu PA, Jiang XG, Jiang YY, Wang JP, Zheng H, Zhang H,
Bennett PH and Howard BV. Effects of diet and
exercise in preventing NIDDM in people with impaired glucose tolerance. The Da Qing IGT and Diabetes Study. Diabetes Care 1997; 20: 537-544.
[41] Tuomilehto J, Lindstrom J, Eriksson JG, Valle
TT, Hamalainen H, Ilanne-Parikka P, Keinanen-Kiukaanniemi S, Laakso M, Louheranta A,
Rastas M, Salminen V, Uusitupa M; Finnish
Diabetes Prevention Study Group. Prevention of type 2 diabetes mellitus by changes in life-style among subjects with impaired glucose tolerance. N Engl J Med 2001; 344: 1343-1350.
[42] Knowler WC, Barrett-Connor E, Fowler SE, Hamman RF, Lachin JM, Walker EA, Nathan DM; Diabetes Prevention Program Research Group. Reduction in the incidence of type 2 diabetes with lifestyle intervention or metfor-min. N Engl J Med 2002; 346: 393-403. [43] Ramachandran A, Snehalatha C, Mary S,
Mukesh B, Bhaskar AD, Vijay V; Indian Diabetes
Prevention Programme (IDPP). The Indian dia-betes prevention programme shows that
life-style modification and metformin prevent type
2 diabetes in Asian Indian subjects with im-paired glucose tolerance (IDPP-1). Diabeto-
logia 2006; 49: 289-297.