218
Journal of the Statistical and Social Inquiry Society of Ireland Vol. XXXV
MORTALITY STATISTICS IN NORTHERN IRELAND: PAST USES AND FUTURE POSSIBILITIES
D. O’Reilly
Department of Epidemiology and Public Health, Queens University Belfast
(read before the Society, 27 April 2006)
__________________________________________________________
Abstract: The compulsory registration of births and deaths was established throughout most
European countries during the 19th century. Enabling legislation was introduced for Ireland in 1863 with the first registration report produced in 1864. Mortality data are derived from the medical certification of cause of death issued by the medical practitioner together with information given to the registrar by the informant. These data fulfil the primary role of legal documentation and secondly provide a source of vital statistics on the population. For the last century such data have formed the cornerstone of our understanding of the health status of the population and of the health needs of society, but now at the start of the 21st century it is perhaps opportune to look at their current utility and possible value in future years. The legal requirement for registration remains unchanged but the question that this paper addresses is ‘in an aging society, where the exact cause of death is more difficult to discern - what is the future for mortality statistics?’
Keywords: demographic statistics, mortality
JEL Classifications: J11, J19
1. BACKGROUND
The compulsory registration of births and deaths was established throughout most European countries during the 19th century. Enabling legislation was introduced for Ireland in 1863 with the first registration report produced in 18641. Mortality data are derived from the medical certification of cause of death issued by the medical practitioner together with information given to the registrar by the qualified informant (often the deceased’s next-of-kin). These data fulfil the primary role of legal documentation and secondly provide a source of vital statistics on the population. For the last century such data have formed the cornerstone of our understanding of the health status and of the health needs of the population, but now at the start of the 21st century it is perhaps opportune to look at their current utility and possible value in future years. The legal requirement for registration remains unchanged but the question that this paper addresses is ‘are mortality statistics become increasingly obsolete in an aging society for whom the exact cause of death is more difficult to discern and where there are arguably more relevant and accurate measures of health available?’
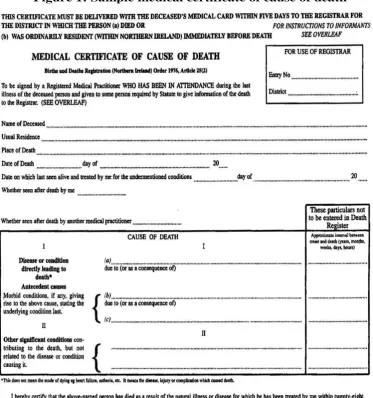
Figure 1: Sample medical certificate of cause of death
Even at the most fundamental level, data relating to the numbers of deaths as well as their age and sex can provide an extremely rich and unique source of information about the health and changing health of the population, especially when combined with accurate estimates of the population. The data show that Northern Ireland, as with the rest of the developed world, saw a sustained reduction in mortality rates during the 20th century. Between 1912 and 2003 the population grew from approximately 1.25 million to 1.70 million people (an increase of 36%), whereas the number of deaths dropped from 21,698 in 1912 to 14,463 in 2003 (a decrease of 33%).
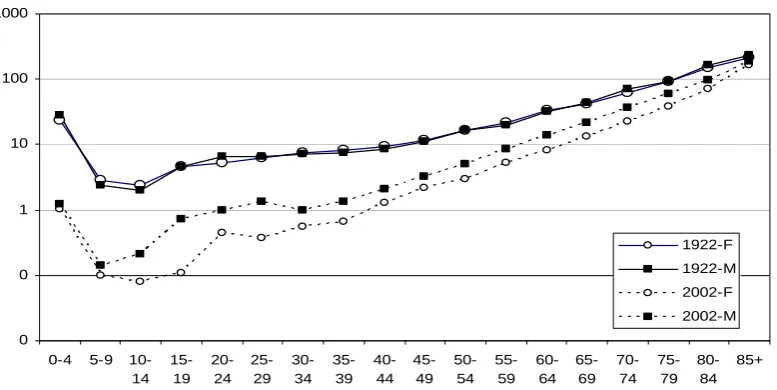
Figure 2: Age-specific mortality rates 1922 and 2002
0 0 1 10 100 1000
0-4 5-9 10-14
15-19
20-24
25-29
30-34
35-39
40-44
45-49
50-54
55-59
60-64
65-69
70-74
75-79
80-84
85+ 1922-F
1922-M
2002-F
2002-M
At the start of the century males and females had very similar age-specific death rates (Figure 2), though female mortality improved at a faster rate during the 1930s and 1940s and particularly so from 1950 to 1970, a period during which the mortality rate for men plateaued. Since the 1980s there has been a marked and sustained improvement in male mortality rates, with a gradual narrowing of the gender gap. Today male mortality rates remain higher than those for women with the most marked differences being observed between the ages of 15 and 30, where male mortality rates are approximately four times higher.
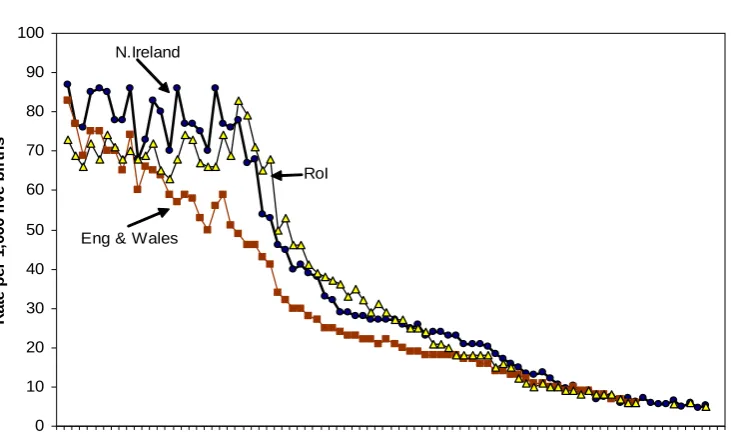
Figure 3: Trends in Infant mortality for Northern Ireland, England and Wales, and the Republic of Ireland: 1921-2003
0 10 20 30 40 50 60 70 80 90 100
1920 1925 1930 1935 1940 1945 1950 1955 1960 1965 1970 1975 1980 1985 1990 1995 2000 2005
R
at
e p
er
1,
00
0 l
iv
e b
ir
th
s
N.Ireland
RoI
Eng & Wales
Figure 3 shows the dramatic reductions in infant mortality (which is defined as is defined as the number of deaths within the first year of life per 1,000 live births) in Northern Ireland, England and Wales and the Republic of Ireland for the years 1921 – 2023. Infant mortality in England and Wales started to fall at a steady rate from the onset of the 20th century 2 opening up an increasing difference between them and the rest of the UK. Between 1921 and 1943 Northern Ireland had an average of 79 infant deaths per 1000 live births: 13% higher than in the Republic of Ireland and 24% higher than in England and Wales. Improvement in the infant mortality rates in Northern Ireland and the Republic of Ireland did not become apparent until the mid-1940s but declined at a faster rate than England and Wales after this time.
Much of the infant mortality decline during the twentieth century occurred before the development of modern medicine and, as most of the improvement occurred in the post neonatal period, it is attributed to improvements in the biologic environment, particularly less crowded housing; the quality and quantity of water available to households for drinking, personal hygiene and sewage disposal 3; proper nutrition made possible by better agricultural techniques; literacy (especially of the mother); and improved access to housing 4,5.
In the second half of the twentieth century, medical advances were responsible for some of the continued decline in infant mortality. The development of vaccines and the ensuing programs of mass vaccination, the effective use of antibiotics, and continuing improvements in living standards all contributed to the decline in infant mortality throughout the 1940s. From the 1960s onwards, the continued improvement in infant mortality was dominated by a decline in neonatal mortality which steadily declined from 13.3 to 3.2 deaths per 1,000 live births, from 1976 to 2003. Post neonatal mortality fluctuated around a constant level in the 1980s, then fell markedly between 1989 to 1992 (probably reflecting the decrease in Sudden Infant Death Syndrome (SIDS)), after which it declined more slowly to a rate of 1.3 in 2003. The rapid decline in infant mortality rates in the 1970s was fuelled in large part by a reduction in birth-weight-specific mortality due to
improvements in neonatal intensive care 6. In 2003, Northern Ireland had an infant mortality rate of 5.2 which, while comparing favourably with the rest of the UK, is higher than some other developed countries and shows how much improvement is still possible.
[image:6.595.118.485.494.652.2]Although the most remarkable improvement in mortality during the 20th century was for children aged 0-14, declines were seen in both sexes and at all ages. Mortality for both males and females aged 15-44 increased in the early 1940s and this was probably related to the Second World War. A second ‘peak’ in mortality rates was evident for males aged 15-29 and to a lesser extent in males aged 30-44 commencing in 1971/72 and continuing into the 1980s and probably represents some of the mortality associated with the Troubles. Reductions in maternal mortality rates also contributed to the improvement in mortality rates of females in this age group. In sharp contrast to the mortality rates for younger ages, those for men aged 45-64 rose sharply in the mid-1950s, a trend that continued until the late 1970s, after which it continued to decline quite sharply again. A similar though less marked pattern was seen for women. This mirrored the increase in deaths due to ischaemic heart disease (IHD), which in turn was strongly related to smoking habits. The 20th century also saw a sustained decline in mortality rates for women aged 65-plus though the improvement in the equivalent mortality rates for men did not start to occur until the 1980s. Life expectancy is derived directly from the age-specific mortality rates and shows equivalent information, but from a different perspective. Life expectancy at birth rose steadily throughout the early twentieth century in Northern Ireland with both sexes gaining approximately 20 years. Most of the early improvement was a result of improvements in child health, with only approximately ten percent of the gain coming from increase in life expectancy of people aged 65 and over (Table 1). However, in the second half of the century increases in life expectancy in those aged 65 years or more accounted for a much greater proportion of the increased longevity amounting to approximately 40% of the improvement. This is due to reduction in mortality due to non-communicable disease which tends to occur at older ages. As a result, changes in death rates at older ages have come to play an increasingly important role in both population aging and in overall mortality change.
Table 1: Changes in trends in life expectancy at birth and at age 65 in Northern Ireland 1890-91; 1950-52; 2000-02
At birth Gain At age 65 Gain
Male Female Male Female Male Female Male Female
1890-91 46.3 45.7 10.6 10.6
1950-52 65.5 68.8 19.2 23.1 12.1 13.5 1.5 2.9
2000-02 75.2 80.1 9.7 11.3 15.7 18.7 3.6 5.2
movement. By demonstrating that the mortality decline in England and Wales was mainly due to a reduction in deaths due to infectious disease, which predated the introduction of effective medical interventions such as antibiotics and vaccination, he concluded that better housing, safer drinking water and better sewage disposal and, most importantly, rising standards of living and improvements in nutritional status were the driving forces of mortality decline, rather than any substantial input from medical care.
The provision of cause of death on death certificates provides further levels data richness that serves to inform and evaluate public health policy, though it is here that some of the limitations associated with mortality data start to become apparent.
Figure 4(a): Mortality from tuberculosis 1912-2003
0 50 100 150 200 250 300
1912 1917 1922 1927 1932 193 7
1942 1947 1952 1957 1962 1967 1972 1977 1982 1987 199 2
1997 2002
p
er
100,000 p
o
p
u
lat
io
n
224
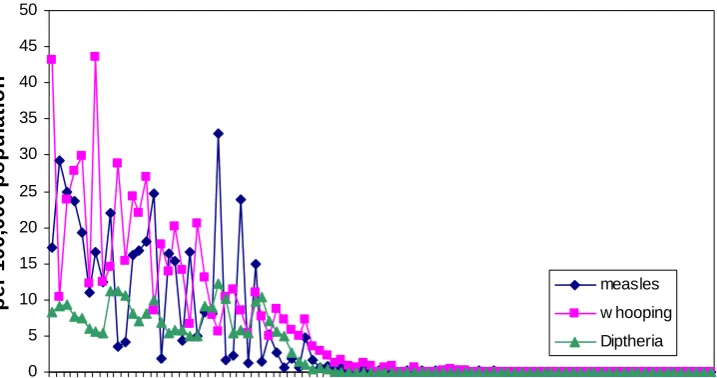
Figure 4 (b): Mortality from whooping cough, diphtheria and measles 1912-2003
0 5 10 15 20 25 30 35 40 45 50
1912 1918 1924 1930 1936 1942 1948 1954 1960 1966 1972 1978 1984 1990 1996 2002
p
er
100,
000 p
o
p
u
lat
io
n
measles
w hooping
[image:7.595.105.494.249.701.2] [image:7.595.134.493.509.698.2]One of the most remarkable declines in mortality rates throughout the 20th century has been within the broad chapter of infectious diseases. Between the years 1912 and 1921 there were an average of 24,365 deaths per year in Northern Ireland of which 4,549 (18.7%) were due to infectious diseases. Tuberculosis (TB), influenza, whooping cough, diphtheria and measles accounted for 95% of these deaths (Figure 3). Between 1912 and 1922 TB was responsible for an average of 2,782 deaths per year, representing 11.4% of all deaths. This is approximately the same as the number of deaths from ischaemic heart disease today. Pulmonary TB was responsible for 75% of all TB deaths and was highest in young adults with about half of the deaths to people aged less than 30 years old. This is in stark contrast to the present day where most of those affected are aged 70 and over. Most of this decline in TB mortality occurred prior to the introduction of BCG vaccination and the availability of effective antibiotic therapy, and has been attributed to improvement in living standards, including better housing and improved nutrition.
[image:8.595.114.502.394.627.2]Whooping cough, diphtheria and measles were responsible for an average of 630 deaths per year between the years 1912 and 1921. Most of the burden fell on young children, with respectively 96%, 92% and 55% of deaths from whooping cough and measles and diphtheria occurring in the under-five year olds. The introduction of an effective vaccination in the late 1940s eliminated the cyclical trends and brought about a dramatic reduction in the mortality rates. The last deaths from diphtheria and whooping cough were in 1955 and 1978 respectively. Tragically, deaths from measles still occasionally occur, the last one in Northern Ireland being in 1994.
Figure 5: Standardised mortality rates from ischaemic heart disease and stroke in Northern Ireland between 1950 and 2003
0 50 100 150 200 250 300 350
1950 1955 1960 1965 1970 1975 1980 1985 1990 1995 2000 2005
R
ate p
er
100,
000 p
o
p
u
lat
io
n
Male IHD
Female IHD
Male stroke
Female stroke
226
guided by cardiac troponin levels, a very sensitive and specific indicator of myocardial damage 8. These more sensitive diagnostic tests, because they can detect smaller amounts of damage to the cardiac muscle, will result in an overall increase in the recorded incidence of myocardial infarction (though this is partially offset by a reduction in the number of false positive diagnoses) and an apparent improvement in the case fatality rates. Approximately 30% of cardiac deaths occur outside a hospital setting 9 and the diagnosis of myocardial infarction will be made on the basis of a high index of clinical suspicion. It has also been suggested that there are difficulties in the interpretation of trends in ischaemic heart disease prior to the adoption, in 1968, of ICD-8 for classifying deaths 10. Before this change many deaths due to ischaemic heart disease may have been coded as ‘Other myocardial degeneration’ (ICD-7, 422), rather than the more usual ‘Atherosclerotic heart disease’ (ICD-7, 420), but since this category also includes other causes of death and it is not possible to separate them out.
The trends shown in Figure 5, which includes both categories, therefore represent something of an overestimation of the mortality rates from ischaemic heart disease prior to 1968. The number of deaths from malignant cancers tripled over the course of the 20th century. There was an average of 1,861 male and 1,779 female cancer-related deaths each year in Northern Ireland between 1999-2003; this represents 26% of all male and 23% of all female deaths. It has been estimated that about 40% of this increase has been due solely to both an expansion and aging of the population, 25% to a change in risk factor profile and the rest to a combination of these factors 12. For males, the five top specific causes of death by cancer are lung (average 484 deaths per year), prostate (206 deaths), colon (149 deaths), stomach (102 deaths) and oesophagus (99 deaths per year), which collectively accounts for 56% of all male cancer deaths. For females the top five are lung (309 deaths per year), breast (291 deaths), colon (143 deaths), ovary (115 deaths) and pancreas (86 deaths per year) accounting for 53% of all female deaths.
Figure 6: Mortality from lung cancer in Northern Ireland showing cohort trends in age-specific rates.
0.1 1 10 100 1000
1854 1869 1884 1899 1914 1929 1944 1959 1974 1989 1864 1879 1894 1909 1924 1939 1954 1969 1984 1999
Year of birth
R
at
e
p
er
100,
000 po
p
.
Males Females
35-39
35-39
45-49 45-49
55-59
55-59 65-69
65-69 75-79
75-79 85+
85+
Figure 7: Standardised mortality rates in Northern Ireland from suicide (unbroken line) and including deaths of undetermined intent (dotted line) 1968-2003 for persons aged less than 75.
0 2 4 6 8 10 12 14 16 18 20
1965 1970 1975 1980 1985 1990 1995 2000 2005
R
at
e
p
e
r 10
0,
000
p
o
p
.
Male
Female
Figure 7 shows the changes in age-standardized rates of suicide in Northern Ireland from 1968. Mortality rates from suicide in women have fallen steadily in Northern Ireland from the 1980s, with current rates now about half the levels of 1982 rates. Suicide rates for men were fairly steady up to the end of the 1970s but over the last twenty years the rate has doubled. In the last 5 years (1999-2003) suicide has claimed an average of 167 lives per year, 79% to men and 76% to people aged between 15 and 49. Most of this increase has occurred in males between the ages of 15 and 35. These suicide statistics highlight some of the problems associated with mortality data. Suicide by definition implies intent, but sometimes there is insufficient evidence to determine that the deceased deliberately intended to kill themselves, in which case the coroner may return an ‘open verdict’. It is therefore necessary to examine trends in suicide using data that both includes and excludes these ‘events of undetermined intent’. In addition, the coroner’s court can result in a delay of between one and five years before the death is registered putting the ‘official’ statistics out of kilter with the local experience.
1. PROBLEMS WITH MORTALITY STATISTICS
While mortality data are very accurate in terms of the number and (generally) relatively good regarding the timing of events they are somewhat less robust when specifying cause of death. These are subject to changes in investigation, diagnostic and coding practices which can render comparisons between areas and across time problematic. Perhaps surprisingly, finding the exact cause of death can be difficult, even in modern medical environments, and this uncertainty increases with age as older patients often suffer from multiple pathologies and there may be a reluctance to subject them to invasive diagnostic procedures. In 1922 only 8.9% of men and 12.0% of women survived beyond the age of 75; in 2002 this had changed to 50.0% of men and 69.7% of women. Many death certificates are completed in hospital by relatively junior staff, who make their best assessment of the underlying pathological processes based on the available clinical
information. The most accurate way to determine the cause of death, and check the accuracy of death certificates, is to perform post-mortem examinations, but this has largely fallen out of fashion and is undertaken in about 9% of deaths in Ireland and Northern Ireland. One reason may be the belief that current medical technology can detect most of the important medical information about a person, including the cause of death. However, studies throughout the world have repeatedly demonstrated a worrying discrepancy between the diagnoses stated on the death certificate when compared with that at hospital post-mortem13-16. Autopsies, or post-mortems, are undertaken where there is uncertainty as to the cause of death and can be divided into those undertaken at the request of the coroner, and medical autopsies, which are requested by medical staff in order to further their medical knowledge. A recent review of autopsies at the Royal Victoria Hospital at Belfast, where the majority of medical autopsies would occur, indicates the selectivity involved with higher rates in hospitals around Belfast and amongst younger patients. Most worryingly was a 78% decline in the numbers of medical autopsies in the last 6 years, which has been attributed to an increased fear of litigation and change in legislation regarding retention of tissues and organs following the Alder Hey inquiry 17.
The importance and the value of maintaining high autopsy rates was highlighted in a recent meta-analysis and review of the discrepancies between clinical and autopsy diagnosis 18. The reviews showed that about one-third of death certificates are likely to be incorrect and that about 50% of autopsies produce unexpected findings, of which 20% could only be detected by histology. Interestingly they found that discrepant cases could not be predicted and were not correlated with the doctor’s assurance of the diagnosis before the autopsy had been performed. It showed that the discrepancy rates had not changed since the 1960’s, which suggests limitations to the utility of modern investigative techniques. A fundamental review of death certification and investigation throughout the UK has been proposed 19, though the motivation seems to be driven by the fallout of the Shipman and Beverly Allitt cases 20, 21 and the Alder Hey inquiry. Although the report recommended ‘…an increased recognition of the importance of death certification in the initial training and continuing professional education of medical student and doctors’, it is unlikely that the changes proposed will lead to a substantial increase in the accuracy of death certification without an increase in rates of autopsies needed to audit these.
Figure 8: Cause of death by age group in Northern Ireland in 1922
0 10 20 30 40 50 60 70 80 90 1000-4 5-9 10-14 15-19 20-24 25-29 30-34 35-39 40-44 45-49 50-54 55-59 60-64 65-69 70-74 75-79 80-84 85-89 90-94 95+ P e rc e nt a ge of a ll d e a th s Other Old age External Cancer Respiratory Circulation Infection
2. ALTERNATIVE SOURCES OF INFORMATION
Perhaps the most important limitation associated with mortality data, and one that is likely to gain increasing importance in future years, is related to the quality of information required to support public health functions such as assessing need, measuring the burden of disease in society, and informing the allocation of resources. From a public health and health services planning perspective it would be preferable to have data relating to the number of new cases of a condition presenting in a population over a year (incidence) or of the number of people currently affected by the condition (prevalence) along with appropriate measures of severity. Unfortunately in most instances such morbidity data are not routinely available and often require the setting up of dedicated registries (examples of these include the cancer 24, cerebral palsy 25, diabetes 26, and congenital malformations 27 registries), though these are expensive to establish and maintain. Mortality may present a very different picture from incidence or prevalence data when there is either an effective cure or differences in survival. For example a recent overview of cancer in Northern Ireland has shown an increasing incidence of breast cancer in women but a falling mortality rate 24. Thus differences in mortality rates between areas or changes over time could be due to differences in survival rates rather than to the occurrence of disease.
In addition, many diseases are not associated with a significantly elevated risk of death and therefore will be poorly reflected in the mortality data 28. Examples of these include mental health
problems and diseases of the musculo-skeletal system. It is likely that this will become more important throughout the present century as the population ages and chronic conditions account for a greater proportion of the burden of disease29. There has been increasing interest in levels of self-reported health status in public health circles. Such data have been consistently shown to be strong, independent predictors of mortality and they are also arguably a more important determinant of health service need. They have the added advantage that they are inherently democratic, being a direct response from the public. Such measures are often routinely included in health surveys throughout the Island and have been included in the most recent censuses in both Ireland and Northern Ireland. However, their subjectivity presents both a potential strength and weakness and there are concerns that the responses to such questions are influenced by factors other than health status30-32. Another possible alternative would be to capitalize on the increased availability of routinely collected administrative data, especially health-related social security benefits datasets. However, such data are confounded by variations in uptake rates as they reflect not only the need for benefits but the variations in the knowledge of and propensity to apply for these benefits.
1. W(H)ITHER MORTALITY STATISTICS IN THE FUTURE?
232
ReferencesCaven, N. (1995) “Registering the People: 150 Years of Civil Registration”, General Register Office for Northern Ireland: Belfast.
Williams N, and C. Galey (1995) “Urban-rural differences in infant mortality in Victorian England”, Population Studies; 49: 401-420.
Wegman, M. E. (2001) “Infant Mortality in the 20th Century, Dramatic but Uneven Progress”.
Journal of Nutrition; 131: 401S – 408S.
Holland, W. M., Detels R., and G. Knox, (eds). (1991) Oxford Textbook of Public Health.
Second Edition. Oxford medical Publications.
Australian Bureau of Statistics. Australian social Trends: Health – Mortality and Morbidity: Infant Mortality. 2003 Available at
http://www.abs.gov.au/Ausstats/abs@.nsf/0/023ff0e7969abcf4ca256bcd008272f7?OpenDocumen t.
Maher, J. and A. MacFarlane (2004) “Inequalities in infant mortality: trends by social class, registration status, mother’s age and birthweight, England and Wales, 1976 – 2000”, Health Statistics Quarterly No. 24. London: TSO.
McKeown, T. (1976) “The role of medicine – dreams, mirage or nemesis?” London: Nuffield Provincial Hospitals Trust.
J Am Coll Cardiol (2000), The Joint European Society of Cardiology/American College of Cardiology Committee, Myocardial infarction redefined—a consensus document of the Joint European Society of Cardiology/American College of Cardiology Committee for the Redefinition for Myocardial Infarctionpp, 36, 959–969.
Moore, W. Kee, F. Evans, A. McCrum-Gardner, E. Morrison, C. and H. Tunstall-Pedoe (2005) “Pre-hospital coronary care and coronary fatality in Belfast and Glasgow MONICA populations”. Int J Epidemiol; 34: 422-30.
Brock, A, and C. Griffiths (2003) “Trends in the mortality of young adults aged 15-44 in England and Wales, 1961 to 2001”, Health Statistics Quarterly, 19: 22-31.
O’Reilly, D. and A. Gavin (1995) “Cancer deaths in N. Ireland: An analysis of patterns and trends”, N. Ireland Cancer Registry: Belfast.
Lee, F., Fry, J and B. Forey (1990) “Trends in lung cancer, chronic obstructive lung disease and emphysema deaths for England and Wales 1941-85 and their relation to trends in cigarette smoking Thorax”, 45: 657-665.
Sidenius, K., Munch, E., Madsen, F., Lange, P., Viskum, K. and U. Soes-Petersen (2000) Accuracy of recorded asthma deaths in Denmark in a 12-month period in 1994/95. Respir Med, 94: 373-7.
Nashelsky, M. and C. Lawrence 2003 “Accuracy of cause of death determination without forensic autopsy examination”, American Journal of Forensic Medical Pathology, 24: 313-9. Alder Hey Inquiry: http://www.rlcinquiry.org.uk/download/index.htm.
Roulson, J, Benbow, E. and P. Hasleton 2005 “Discrepancies between clinical and autopsy diagnosis and the value of post mortem histology; a meta-analysis and review”, Histopathology, 47: 551-559.
Death certification and investigation in England, Wales and Northern Ireland: The report of a fundamental review. Cm 5831. London: HMSO 2003.
The Shipman Inquiry: Available
http://www.the-shipman
inquiry.org.uk/images/sixthreport/SHIP06_COMPLETE_NO_APPS.pdf.
Independent Inquiry relating to deaths and injuries on the children's ward at Grantham and Kesteven General Hospital. London: HMSO, 1994.
“National Statistics Report: Results of the ICD-10 bridge coding study, England and Wales”, 1999. Health Statistics Quarterly 14, 2002.
Registrar General Northern Ireland Annual Report 2001. Northern Ireland Statistics and Research Agency. Belfast 2002.
Cancer in Northern Ireland 1993-2001: A Comprehensive Report. Queen’s University Belfast: 2004.
Parkes, J., Dolk, H. and N. Hill (2005) “Children and young people with cerebral palsy in Northern Ireland – Birth years 1977-1997. A comprehensive report from the Northern Ireland Cerebral Palsy Register”, Queen’s University Belfast.
Patterson, C., Carson, D. and D. Hadden (1996) “Epidemiology of childhood IDDM in Northern Ireland 1989-1994: Low incidence in areas with the highest population density and most household crowding”, Diabetologia, 39: 1063-1069.
EUROCAT (2002) Surveillance of Congenital Anomalies in Europe 1980-1999. University of Ulster.
Mays, N. and G. F. Bevan (1987) Resource allocation in the Health Service, Occasional Paper in
Social Administration 81, Bedford Square Press, London .
Murray, C.JL. & A. D. Lopez (1996) “The Global Burden of Disease. In: A Comprehensive Assessment of Mortality and Disability from Diseases, Injuries, and Risk Factors in 1990 and Projected to 2020”, Harvard University Press: Cambridge.
Boyle, PJ., Gatrell, A. C. and O. Duke-Williams (2001) “Do area-level population change, deprivation and variations in deprivation affect self-reported limiting long-term illness? An individual analysis” Soc Sci Med ; 53: 795-99.
234
Vote of thanks proposed by Mr Chris Shaw
Thanks to the SSISI for the invitation to address this meeting. Not least, because it has prompted me to read Dermot’s chapter in the Registrar General’s Annual Report! Both this chapter, and the excellent presentation we have heard today, provide a clear, concise yet comprehensive account of 20th century mortality trends. It therefore gives me great pleasure to propose the vote of thanks to Dermot.
Before adding one or two additional thoughts, I want to digress by explaining my title slide. This says that I am representing the National Statistics Centre for Demography (NSCD), a body that may be unfamiliar to most of you! The NSCD was formed in the Office for National Statistics (ONS) earlier in 2006 at the same time as work on national population projections and national life tables transferred from the Government Actuary’s Department (GAD) to ONS. The NSCD will see ONS staff working in partnership with the Registrars General of Scotland and Northern Ireland. A central aim of the NSCD will be to provide more consistent and coherent demographic statistics and analysis for the UK as a whole.
Today I will try to complement Dermot’s presentation with some further analysis of relative trends in Northern Ireland and UK mortality; some discussion of UK mortality trends from a cohort perspective; and a summary of our latest assumptions about future mortality. Some of the analyses will relate to England & Wales rather than the UK as we have longer historical time-series for the former. Full details of our work on both national population projections and national life tables continue to be available on the GAD website at www.gad.gov.uk.
Over the past 150 years, we have seen a fairly steady increase in expectation of life at birth in England & Wales. However, as in Northern Ireland, these improvements have not been uniform across all ages. In particular, there was relatively little improvement in expectation of life at 65 until the second half of the 20th century. This is illustrated by the gradual rectangularisation of the life table curve, with considerable increases in the proportion of people surviving to elderly ages but, thus far, comparatively modest increases in maximum lifespans.
Looking just at the last quarter century, the picture is generally one of fairly constant differentials in life expectancy between the four countries of the UK. However, Northern Ireland’s position improved relatively during the 1980s from being virtually the back marker to now being just a little behind England and some way ahead of Scotland. This is true whether we look at males or females, or whether we consider life expectancy at birth or at age 60. Examination of trends by age, shows that most of the relative improvement was focussed on ages 20 to 60 for males and for 20 to 80 males. Interestingly, there is no evidence of poorer mortality in Northern Ireland at the oldest ages (80 and above) relative to the rest of the UK.
the projected future improvements in mortality as assumed in the latest national population projections, our best guess at remaining life expectancy is now actually 19.0 years. A similar difference exists for 65 year old women in Northern Ireland; period life expectancy is now 19.4 years but cohort life expectancy is 21.7 years.
Examining historical mortality trends reveals clear evidence of strong cohort trends in UK mortality. In particular, people born approximately between 1925 and 1945 and centred on 1931 (sometimes now referred to as the “golden cohorts”) have consistently experienced high levels of improvements in age-specific mortality rates. The experience of these cohorts is driving the current unusually fast improvements, especially for men, in life expectancy at 65. There is probably no single explanation for this effect. Rather, these cohorts have probably benefited from a combination of factors e.g. improved wartime diet, the introduction of the NHS and, for men, changes in smoking behaviour.
The golden cohorts will, of course, start to die out over the next quarter century and their influence on overall mortality trends will diminish. There is now increasing evidence of cohort trends in mortality for younger people including, worryingly, some cohorts of men for whom age-specific mortality rates have actually worsened at young ages.
A full account of the methodology used for projecting mortality in the official national population projections is given in a National Statistics Quality Review (no. 8) available on the ONS and GAD websites. One point of note is that we do not project mortality separately by cause. While this approach does have some theoretical attractions, it has a number of practical disadvantages. These are largely related to the problems Dermot has identified so clearly about establishing reliable historical trend data by cause given changes in diagnostic practice, coding etc and identifying the principal cause of death especially for the very elderly.
In our projections, we assume that annual rates of mortality improvement, which currently vary considerably by age and sex, will converge to a common rate at a fixed point in time. In our latest (2004-based) projections, we assume convergence to a common rate of improvement of 1% a year in twenty-five years’ time i.e. by 2029. In an important change in our latest set of projections, we now assume that this ‘target’ rate of improvement of 1% per annum will then continue unchanged. In previous projections, the rate of mortality improvement was assumed to diminish gradually in the long-term.
The assumed long-term improvement of 1% a year is similar to the average rate of improvement experienced over the 20th century. However, higher levels of improvement have been experienced in more recent years, especially for men. We believe that these current higher levels largely reflect the influence of the golden cohorts and, for men, of past changes in smoking behaviour and are unlikely to be sustained.
Projection makers throughout the world have been criticised for underestimating the level of future mortality improvement. It is therefore interesting to note that, with the latest change in our long-term assumptions, we are now assuming similar, or even higher, levels of mortality improvement for the future than have been experienced in corresponding periods in the past. With that I will finish and my thanks again to the Society for inviting me to this meeting.
Chris Shaw
236
SECOND VOTE OF THANKS PROPOSED BY DR. SHANE WHELAN
It gives me pleasure to second Chris Shaw’s Vote of thank to Dr Dermot O’Reilly for such an excellent paper.
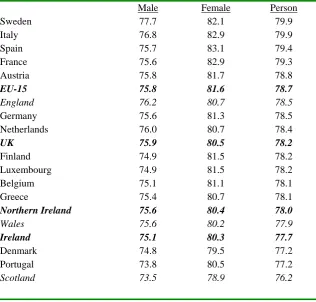
[image:19.595.141.458.370.672.2]Mortality is obviously an important topic – important to the individual, the family, and the community. A measure of its relative significance is estimated in the construction of the Economist Intelligence Unit’s Quality of Life Index, which gives life expectancy at birth a weighting of 19.0%, marginally higher than GDP per person (Economist (2005)). The United Nation’s Human Development Index gives it an equal weight (at 33%) with material well-being (United Nations Development Programme (2004)). Ireland and the UK currently rank 1st and 29th respectively in the Quality of Life Index (out of 111 nations) and 8th and 15th respectively in the Human Development Index (out of 159 nations). Despite the high ranking of our nations, the performance in these indices would have been improved further if life expectancy in the UK or Ireland was in line with the EU-15 average. Below I set out in tabular form the expectation of life at birth in 2002 in the EU-15 nations, subdividing the UK into England, Northern Ireland, Scotland and Wales.
Table 1: Expectation of Life at Birth, 2002, in EU-15 Countries plus Northern Ireland, England, Wales, and Scotland (Ranked by Person)
Male Female Person
Sweden 77.7 82.1 79.9
Italy 76.8 82.9 79.9
Spain 75.7 83.1 79.4
France 75.6 82.9 79.3
Austria 75.8 81.7 78.8
EU-15 75.8 81.6 78.7
England 76.2 80.7 78.5
Germany 75.6 81.3 78.5
Netherlands 76.0 80.7 78.4
UK 75.9 80.5 78.2
Finland 74.9 81.5 78.2
Luxembourg 74.9 81.5 78.2
Belgium 75.1 81.1 78.1
Greece 75.4 80.7 78.1
Northern Ireland 75.6 80.4 78.0
Wales 75.6 80.2 77.9
Ireland 75.1 80.3 77.7
Denmark 74.8 79.5 77.2
Portugal 73.8 80.5 77.2
Scotland 73.5 78.9 76.2
Sources: CSO (2004), Table 5; Interim Life Tables 2001-03 from Government Actuary’s Department
Given its importance and the evident scope for improvement, population mortality should be researched and managed as much as the economy. However this is manifestly not the case and so Dr O’Reilly’s paper is particularly welcome.
Population mortality data on this island has been only lightly studied since it was continuously collected from 1864. For instance, Northern Ireland’s mortality data was only graduated to produce life tables for Life Tables 1926 (using the mortality experience in the years 1925-27), and Life Tables 1950-52. While Ireland has produced a graduated life table coincident with each census (so there are now 14 life tables in all), the method of graduation used is still King’s Method – a method devised early in the twentieth century to overcome the then significant problem of age rounding (King (1909)).
Dr O’Reilly’s paper must be put in this context. He gives a remarkably comprehensive and accessible overview of the trends in mortality in Northern Ireland by underlying cause of death, making us aware of the limitations of this sub-division. He provides examples of how the statistics have informed policy decisions to target adverse trends by way of information campaigns (e.g., dangers of smoking, the ‘back-to-sleep’ campaign that dramatically reduced Sudden Infant Death Syndrome) or legislation (e.g., the compulsory wearing of safety-belts in 1983, limits on alcohol consumption before driving). Any one of these informed policy actions surely justifies the cost of producing the statistics.
The paper raises a concern regarding the accuracy of cause-of-death classifications. Dr O’Reilly shows that some cause-of-death classifications in the past such as ‘old age’ contain little information. More alarmingly, he highlights that cause-of-death descriptions might be inaccurate in one-third of cases. Accordingly, a decomposition by cause-of-death might be too fine a division to produce reliable results when comparing mortality rates over time or between one region and another.
Comparative View of Northern Ireland Mortality Statistics
In this section, I outline a complementary method to compare mortality statistics in Northern Ireland over time and with other regions. The method is applied to the overall mortality experience of males in Northern Ireland since 1926 to highlight overall trends and compare the trends with those in England & Wales and Ireland. The method involves modelling the level and shape of the mortality curve by an eight parameter formula.
Figure 1: Expectation of Life at Birth, Males & Females, Ireland & Northern Ireland, 1870-2002.
40 45 50 55 60 65 70 75 80 85
1860 1870 1880 1890 1900 1910 1920 1930 1940 1950 1960 1970 1980 1990 2000 2010
Ire Males NI Males Ire Females NI Females
Sources: Data for Northern Ireland (NI) from Table K of the Annual Report 1995 of the Registrar General for
Northern Ireland; Data for Ireland (Ire) from Table 3 in CS0 (2004).
[image:21.595.102.481.109.341.2]Mortality curves – that is, how mortality rates vary with age – have a similar shape in most developed economies. Graph 2 shows the shape of the curve for males in Northern Ireland in 1926, 1951, 1981 and 2002.
Figure 2: Shape of Mortality Curve, Northern Ireland, Males, 1926, 1951, 1981, 2002.
0.00001 0.0001 0.001 0.01 0.1 1
0 10 20 30 40 50 60 70 80 9
Age (years)
M
o
rta
li
ty
R
a
te
(q
x
)
0
1926 1951 1981 2002
Sources: The Registrar-General’s Review of Vital Statistics of Northern Ireland and Life Tables (1926);
ditto 1950-52; Interim Life Tables for Northern Ireland 1980-82 and 2001-03 from UK Government Actuary’s Department (www.gad.gov.uk).
A law of mortality akin to a law of physics – that is mathematically modelling the aging process – is elusive, despite notable attempts by, inter alia, Gompertz (1825), and Makeham (1860) (see, for instance, Olshansky & Carnes (1997) for a review). However, more purely descriptive formulae have been proposed with that of Heligman & Pollard (1980) being one of the more promising. Heligman & Pollard (1980) propose the following formula to model mortality rates from age (x) from 0 to age 100 and over1:
x F x E B x x x
GH
De
A
p
q
C+
+
=
( + ) − [ln −ln ]2 [image:22.595.111.503.329.552.2]There are three distinct elements of the formula, each modelling mortality rates at a particular stage in life. Graph 3 shows the part of the mortality curve that each element models.
Figure 3: Shape of Mortality Curve, Decomposed into Mortality Rates in Three Stages of Life as Modelled by Heligman & Pollard (1980)
0.00001 0.0001 0.001 0.01 0.1 1
0 4 8 12 16 20 24 28 32 36 40 44 48 52 56 60 64 68 72 76 80 84 88 92 96 100
Infant Mortality
Accident Hump
Gompertz Curve
Total Mortality
Many parameters of the curve admit of an intuitive interpretation, as described below:
1 They also propose two nine parameter variations:
) 1 ( 2 ] ln [ln ) ( x x F x E B x
x A De GH KGH
q C + + + = + − − and ) 1 ( 2 ] ln [ln ) ( κ κ x x F x E B x x GH GH De A q C + + +
= + − − . We employ only the eight parameter version. See Heligman
Infant mortality described by the term:
C
B x
x x
x
A
p
q
q
≈
=
( + ), significant when x small where
A: Almost identical to q1 (mortality rate at age 1) B: Location of q0 in range q1 to 0.5 (high value good) C: Rate of decline of infant mortality
Young adult accident mortality ‘hump’ described by the term:
2
] ln
[lnx F
E
x x
x
De
p
q
q
≈
=
− −, for x corresponding to young adult ages where
D: Magnitude/Severity of mortality hump E: Spread of hump
F: Location of hump (when maximum)
Near geometric progression of rates at later ages modelled by Gompertz-like curve
)
1
(
xx x
GH
GH
q
+
≈
, for x large where
G: Level of mortality
H: Rate of increase of mortality
The above formula has been used to describe concisely the life tables of many countries (e.g., Heligman & Pollard (1980) for Australia; Forfar & Smith (1987) for first 14 English Life Tables covering the period 1841 to 1981; McNown & Rogers (1989) for US Male mortality each year from 1900 to 1985).
We fit the Heligman & Pollard curve to the life tables for Northern Ireland males for the years 1926, 1951, 1981, 1986, 1991, 1996, and 2002 (sources as per Graph 2, augmented by Interim Life Tables for Northern Ireland 1985-87, 1990-92 and 1995-97 from UK Government Actuary’s Department (www.gad.gov.uk)). The eight parameters (A to H) were selected as those parameters that minimise the sum of squares of the relative errors at each age in the range 0 to 85 years inclusive, i.e.,
choosing parameters A to H such that
2 85
0 2
1
∑
==
⎟⎟
⎠
⎞
⎜⎜
⎝
⎛
−
=
xx
MR x
HP x
q
q
S
is minimised
where is the mortality rate for that age in the life table and is the mortality rate from the Heligman-Pollard formula with parameters specified. In line with other modellers, ages above 85 years have been excluded due to potential problems of reliability at these later ages. The parameters that describe the mortality experience of males in Northern Ireland are given in Table 2.
MR x
[image:24.595.87.495.271.407.2]q
q
xHPTable 2: Best Fit Heligman & Pollard Parameters to Mortality Rates for Males in Northern Ireland
A*103 B*103 C*102 D*104 G*105 S2
Year E F H
2002 0.401 19.391 10.906 7.831 8.296 21.942 2.641 1.106 1.823 1996 0.342 9.814 10.022 8.485 8.307 21.641 2.554 1.110 2.364 1991 0.509 10.635 9.702 8.204 8.743 21.095 2.921 1.109 2.088 1986 0.466 0.968 7.501 9.378 11.635 20.746 3.489 1.108 2.226 1981 1.040 12.916 11.333 10.469 9.713 21.001 4.022 1.108 1.881 1951 2.859 5.351 12.370 6.959 7.957 24.256 8.333 1.098 0.079 1926 27.540 212.61 28.627 34.074 1.463 29.944 10.741 1.094 0.263
The fit is reasonable (indicated by a low S2) when allowance is made for the inevitably increase in S2 when fit to the ungraduated rates from 1981 onwards. Graphs 4 and 5 illustrate the close adherence of the best fit Heligman & Pollard (H-P) curve to the recorded mortality rates in 1926 and in 2002.
Figure 4: Mortality Rates by Age, Northern Ireland Males, 1926, Graduated
Rates and H-P Fit
0.001 0.01 0.1 1
0 4 8 12 16 20 24 28 32 36 40 44 48 52 56 60 64 68 72 76 80 84 88 92 96100
qx - NI qx - Fit
Figure 5: Mortality Rates by Age, Northern Ireland Males, 2002, Ungraduated Rates and H-P Fit
0.00001 0.0001 0.001 0.01 0.1 1
0 4 8 12 16 20 24 28 32 36 40 44 48 52 56 60 64 68 72 76 80 84 88 92 96100
The H-P formula effectively summaries the complete life table with eight parameters, facilitating international and inter-temporal comparisons. We can now compare the mortality trend in Northern Ireland males with males in England & Wales and Ireland over the last eighty years. Graph 6 shows how parameter A for males in Northern Ireland (corresponding approximately to the mortality rate at age 1 year) has evolved and compares the trend with its trend in England & Wales and Ireland. The graph reinforces the conclusion in Dr O’Reilly paper that infant mortality in all three regions has now essentially converged, with rates in Northern Ireland and Ireland catching up with the lead of England & Wales.
Figure 6: H-P Fit, Evolution of Parameter A: 1921-2002, Northern Ireland, England & Wales, Ireland
0 . 1 1 1 0 1 0 0
1 9 1 0 1 9 2 0 1 9 3 0 1 9 4 0 1 9 5 0 1 9 6 0 1 9 7 0 1 9 8 0 1 9 9 0 2 0 0 0 2 0 1 0 N I r e I r e E & W
Sources: Forfar & Smith (1987) for England & Wales, 1921-1981, otherwise parameter estimates calculated
from interim life tables for England & Wales and from Irish Life Tables 1-14.
The graphs of parameters B and C add little further insight. The evolution of parameters D to H are shown in Graphs 7 to 11. The broad conclusion is that trends in male mortality in Northern Ireland are very similar to the trends in Ireland and England & Wales over the same period. The relatively small differences in recent years are:
• the accident hump peaks at an earlier age, and is more spread out in Northern Ireland than the other two regions (although the overall intensity of the hump is similar).
That mortality rates from middle age upwards in Northern Ireland more closely follows that of England & Wales than Ireland.
Figure 7: Parameter D: 1921-2002 Northern Ireland, England & Wales, Ireland
Figure 8: Parameter E: 1921-2002 Northern Ireland, England & Wales, Ireland
Figure 9: Parameter F: 1921-2002 Northern Ireland, England & Wales, Ireland
Figure 10: Parameter G: 1921-2002 Northern Ireland, England & Wales, Ireland
1 3 5 7 9 11 13 15 17 19
1910 1920 1930 1940 1950 1960 1970 1980 1990 2000 2010 NIre Ire E&W
1 6 11 16 21 26 31 36 41
1910 1920 1930 1940 1950 1960 1970 1980 1990 2000 2010 NIre Ire E&W
15 17 19 21 23 25 27 29 31
1910 1920 1930 1940 1950 1960 1970 1980 1990 2000 2010 NIre Ire E&W
1 10 100
Figure 11: Parameter H: 1921-2002 Northern Ireland, England & Wales, Ireland
1.08 1.085 1.09 1.095 1.1 1.105 1.11 1.115 1.12
1910 1920 1930 1940 1950 1960 1970 1980 1990 2000 2010
NIre Ire E& W
Conclusion
The overall conclusion from this complementary and partial analysis of mortality trends in Northern Ireland is that the age-incidence of mortality broadly follows that in Ireland and England & Wales over the last eighty years. In particular, the life table of Northern Ireland males closely resembles that of Ireland in 2002 as shown in Graph 12.
Figure 12: Comparison of Mortality Curves for Males, Northern Ireland and Ireland, 2002
0.00001 0.00010 0.00100 0.01000 0.10000 1.00000
0 10 20 30 40 50 60 70 80 90
Age
qx
(
ln s
ca
le
)
-40% -20% 0% 20% 40% 60% 80% 100%
%
D
iffe
re
n
ce
(N
I o
v
er
Ir
e)
NI Males 2002 [LHS] Ire Males 2002 [LHS] Relative Difference (%) [RHS]
246
ReferencesCSO (2004) Irish Life Tables No. 14, 2001-2003. Central Statistic Office, Dublin. The Economist (2004) The World in 2005. The Economist Newspaper Limited.
Forfar, D.O. & Smith, D.M. (1987) “The Changing Shape of English Life Tables”, Transactions of the Faculty of Actuaries, 40, 98-134.
Gompertz, B. (1825) “On the nature of the function of the law of human mortality and on a new mode of determining the value of life contingencies”, Phil. Transactions of Royal Society, 115, 513-85.
Heligman, L. & Pollard, J.H. (1980) “The Age Pattern of Mortality” Journal of the Institute of Actuaries, 107, 49-80.
King, G. (1909) “On a New Method of Constructing and of Graduating Mortality and other Tables”, Journal of the Institute of Actuaries, XLIII, 109-184.
Makeham, W.M. (1860) “On the law of mortality”, Journal of the Institute of Actuaries, XIII, 325-58.
McNown, R. & Rogers, A. (1989) “Forecasting mortality: a parameterized time series approach”,
Demography, 26, 4, 645-660.