Review Article
Association between the NFκB1-94ins/del ATTG
polymorphism and cancer risk: a meta-analysis
and trial sequential analysis
Chuanjie Zhang
1*, Yuxiao Zheng
2*, Xiao Li
4*, Yang Wu
3, Haoxiang Xu
2, Zhiqiang Qin
2, Jie Wu
2, Cheng Zhang
2,
Yincheng Liu
1, Hanyu Liu
1, Gong Cheng
2, Lixin Hua
21First Clinical Medical College of Nanjing Medical University, Nanjing 210029, China; Departments of 2Urology, 3Pancreas Center, The First Affiliated Hospital of Nanjing Medical University, Nanjing 210029, China; 4Department
of Urology, The Affiliated Cancer Hospital of Jiangsu Province of Nanjing Medical University, Nanjing 210009, China. *Equal contributors.
Received November 7, 2016; Accepted June 5, 2017; Epub July 15, 2017; Published July 30, 2017
Abstract: Objective: This study aimed to perform a comprehensive meta-analysis and trial sequential analysis to clarify the association between the NFκB1 -94ins/del ATTG promoter polymorphism and cancer risk. Methods: A total of 42 studies including 16814 cases and 23367 controls were analyzed in this meta-analysis. We used pooled odds ratios (ORs) to evaluate the strength of the association, and 95% confidence intervals (CIs) to identify precision of the estimate. Results: We found that the NFκB1 promoter -94ins/del ATTG polymorphism was significantly as -sociated with cancer risk in all five genetic models (Homozygote model, OR=1.33, 95% CI=1.12-1.59; Heterozygote model, OR=1.15, 95% CI=1.03-1.29; Dominant model, OR=1.21, 95% CI=1.07-1.38; Recessive model, OR=1.18, 95% CI=1.05-1.32; Allele model, OR=1.14, 95% CI=1.05-1.24). Subgroup analyses revealed a significant associa -tion between the polymorphism and cancer risk in Asian popula-tion and hospital-based studies. Stratified analysis was also performed in genotyping method, and significant associations were detected in all subgroups individually. We found the association was cancer-specific in cancer type subgroup analysis. The trial sequential analysis dem -onstrated statistical significance in favor of the NFκB1 promoter -94ins/del ATTG polymorphism increasing cancer risk, and the number of participants enrolled in this meta-analysis reached the low-bias heterogeneity adjusted information size. Conclusion: Our meta-analysis and TSA results suggested that the association between -94ins/ del polymorphism in the promoter of NFκB1 and cancer risk is statistically significant and the association might be ethnic-specific.
Keywords: NFκB1, gene polymorphism, cancer, meta-analysis, trial sequential analysis
Introduction
Cancer is a terminal complex disease with high
morbidity and mortality that results from the
interactions between inherited and
environ-mental factors [1]. In the past decades, many
genes were found as influence factors of can
-cer [2]. Although the oncogenesis has been
widely studied, the complex etiology of cancer
is not yet fully clarified. Genetic susceptibility is
a known possible explanation for the interindi
-vidual variation in cancer risk and contribute to
the development of cancer [3].
Nuclear factor κB
(NFκB) is a nuclear protein
which was first identified by Sen and Baltimore
in 1986 [4]. NFκB is known as a transcription
factor that plays significant roles in various
physiological process such as inflammation,
cell survival, cell adhesion, differentiation, an-
giogenesis and apoptos [5-8]. There are five
members of the NFκB family present in mam
-mals: NFκB1
(p50), RelA
(p65), c-Rel, RelB and
NFκB2
(p52) [9]. The human NFκB1 gene that
is located on chromosome 4q24 encodes
pro-tein p50 which can regulate inflammation and
cancer development [10-13]. -94ins/del ATTG
(rs28362491) is a common four nucleotides
polymorphism in the promoter region of NF
κB1
association between the NF
κB1 -94ins/del
AT-TG polymorphism and cancer susceptibility has
been investigated by many studies which had
inconsistent results [15-23]. In addition, some
published meta-analysis focused on the
asso-ciation between the NF
κB1 -94ins/del ATTG
po-lymorphism and cancer risk also obtained con
-flicting results [24-26].
To explore the association between the NF-
κB1
-94ins/del ATTG promoter polymorphism
and cancer in a better manner, we collected
all available data to perform a comprehensive
meta-analysis and performed a trial sequen-
tial analysis in the hope of providing more
pre-cise evidence.
Materials and methods
Search strategy
A systematic search on PubMed, EMBASE and
Web of Science was performed to identify all
published potentially appropriate studies (till
May 20th, 2016). The key words were (“genetic
polymorphism”, “polymorphism”, “SNP”, “
single
nucleotide polymorphism
”, “
gene mutation”, or
“genetic variant”), (“neoplasm”, “cancer”,
“tu-mor”, “carcinoma”, or “
carcinogenesis”), and
(“NFκB1”, “nuclear factor kappa B1”, “NF kappa
B1”, or “nuclear factor κ B1”. Additional
publi-cations were identified when we searched the
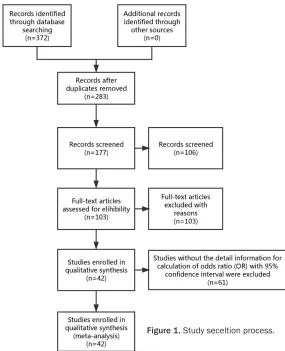
reference list of original articles manually. A
flow diagram of the study selection process is
presented in
Figure 1
.
Inclusion criteria
(1) Studies were case-control studies. (2)
Studies estimated the association between
NFκB1 -94ins/del ATTG polymorphism and can
-cer risk. (3) The information from studies was
performed in detail for calculation of odds ratio
(OR) with 95% confidence interval (CI). (4) Data
involved in different studies were not
overlap-ping (if any, we selected the study with the
larg-est samples).
Exclusion criteria
(1) Studies were not case-control studies. (2)
Studies consisted no usable reported data. (3)
Studies did not relate to cancer risk. (4) Studies
had overlapped data.
Data extraction
Two investigators (Yuxiao Zheng and Xiao Li)
independently extracted all useful information
involved in eligible studies according to the
inclusion criteria performed above. The review
of result was carried out by a third investigator
(Gong Cheng). The following information was
recorded for each selected study: name of first
author, year of publication, ethnicity,
genotyp-ing method, source of controls, frequencies of
the genotypes in cases and controls, cancer
type and Hardy-Weinberg equilibrium (HWE) of
genotype distribution among controls. We
con-sidered studies which consisted more than one
type of cancer as individual datasets only in
subgroup analyses according to cancer type.
Statistical analysis
We used pooled odds ratio (OR) with
corre-sponding 95% confidence interval (CI) to evalu
-ate the strength of association between NFκB1
promoter -94ins/del ATTG polymorphism and
cancer risk. Z test was performed to determine
the statistical significance of the pooled OR,
and a
P
value of < 0.05 was considered sta-
tistically significant. We used the Homozygote
model (ins/ins vs. del/del), Heterozygote model
(ins/del vs. del/del), Recessive model (ins/ins
vs. del/del+ins/del),
D
ominant model (ins/ins+
ins/del vs. del/del), and Allele (ins vs. del) mo-
del to examine NFκB1 -94ins/del ATTG geno
-types. In addition to the overall comparison, we
also performed subgroup analysis stratified by
ethnicity, genotyping method, source of
con-trols, cancer type.
The statistical heterogeneity between studies
involved in this meta-analysis was evaluated
using Q test which based on Cochran’s
chi-square and I
2values. We calculated the
sum-mary OR by the random-effects model when
P
value of heterogeneity was < 0.05 and I
2>
50% which indicated the presence of
heteroge-neity [27]; Otherwise, the fixed-effects model
using the Mantel-Haenszel method was used
[28]. We performed allele counting to regulate
the allele frequencies of the NFκB1 promoter
-94ins/del ATTG polymorphism from the
indi-vidual study. HWE was evaluated using the
goodness-of-fit test (chi-square or Fisher exact
reflect the influence of the individual data set
to the pooled OR) were performed to evaluate
the stability of the results. Egger’s test and
Begg
’s funnel plots were used to assessed the
potential publication bias;
P
value < 0.05 and
asymmetric plot suggest a potential publica-
tion bias. Statistical analyses were performed
using STATA 12.0 software (Stata Corp, College
Station, TX, USA).
Trial sequential analysis
Trial sequential analysis (TSA) was used to as-
sess the increased type I error caused by few
enrolled data and repeated significance
test-ing when updattest-ing with new published studies
[29-34]. We cumulated sample size of studies
included in this meta-analysis and then
per-formed trial sequential analysis to estimated
the information-size of meta-analysis. The
lat-ter, called trial sequential monitoring
boundar-ies, reduce type I errors [29, 31, 33, 35]. We
treated the addition of each individual study in
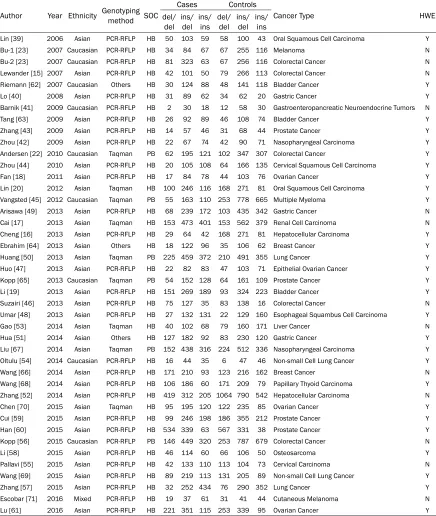
tics of all involved studies were presented in
Table 1
. Newcastle-Ottawa Scale was perform-
ed to estimate the strength of the evidence of
included studies and the result was shown in
Supplementary Table 1. We treated the study
by Bu [23] as two independent studies in sub
[image:3.612.89.374.69.420.2]-group analysis of cancer type because two
dif-ferent cancer types were involved in this arti-
cle. Finally, 3 bladder cancer, 2 breast cancer, 5
colorectal cancer, 3 gastric cancer, 2
hepato-cellular carcinoma, 2 lung cancer, 2
nasopha-ryngeal carcinoma, 2 non-small cell lung
can-cer, 2 oral squamous cell carcinoma, 3 ovarian
cancer, 4 prostate cancer, 1 cervical
carcino-ma, 1 cervical squamous cell carcinocarcino-ma, 1 cu-
taneous melanoma, 1 epithelial ovarian
can-cer, 1 esophageal squambus cell carcinoma,
1 gastroenteropancreatic neuroendocrine tu-
mors, 1 liver cancer, 1 melanoma, 1 multiple
myeloma, 1 osteosarcoma, 1 papillary thyoid
carcinoma and 1 renal cell carcinoma studies
were enrolled in this meta-analysis. Among
those eligible studies, 29 [16-18, 20, 22-23,
Figure 1. Study seceltion process.a cumulative meta-analysis
as an intern meta-analysis to
elucidate whether additional
trials are needed. If the TSA
result showed no cross
con-nection between Z-curve and
the boundary and the requir-
ed information size was not
large enough, that means
we should enroll more trials
and collect more evidence to
reach a conclusion [36-38].
In conclusion, TSA was used
to reduce the risk of type I
error to evaluate whether we
should enroll more samples
from more eligible studies in
further trials.
Results
Characteristics of eligible
studies
A total of 42 studies includ-
ing 16814 cases and 23367
controls were analyzed in
this meta-analysis.
Figure 1
described the process for
study identification and
characteris-Table 1. Main characteristics of studies involved in this meta-analys
is
Author Year Ethnicity Genotyping method SOC
Cases Controls
Cancer Type HWE
del/
del ins/del ins/ins del/del ins/del ins/ins
Lin [39] 2006 Asian PCR-RFLP HB 50 103 59 58 100 43 Oral Squamous Cell Carcinoma Y
Bu-1 [23] 2007 Caucasian PCR-RFLP HB 34 84 67 67 255 116 Melanoma N
Bu-2 [23] 2007 Caucasian PCR-RFLP HB 81 323 63 67 256 116 Colorectal Cancer N Lewander [15] 2007 Asian PCR-RFLP HB 42 101 50 79 266 113 Colorectal Cancer N Riemann [62] 2007 Caucasian Others HB 30 124 88 48 141 118 Bladder Cancer Y Lo [40] 2008 Asian PCR-RFLP HB 31 89 62 34 62 20 Gastric Cancer Y Barnik [41] 2009 Caucasian PCR-RFLP HB 2 30 18 12 58 30 Gastroenteropancreatic Neuroendocrine Tumors N Tang [63] 2009 Asian PCR-RFLP HB 26 92 89 46 108 74 Bladder Cancer Y Zhang [43] 2009 Asian PCR-RFLP HB 14 57 46 31 68 44 Prostate Cancer Y Zhou [42] 2009 Asian PCR-RFLP HB 22 67 74 42 90 71 Nasopharyngeal Carcinoma Y Andersen [22] 2010 Caucasian Taqman PB 62 195 121 102 347 307 Colorectal Cancer Y Zhou [44] 2010 Asian PCR-RFLP HB 20 105 108 64 166 135 Cervical Squamous Cell Carcinoma Y Fan [18] 2011 Asian PCR-RFLP HB 17 84 78 44 103 76 Ovarian Cancer Y Lin [20] 2012 Asian Taqman HB 100 246 116 168 271 81 Oral Squamous Cell Carcinoma Y Vangsted [45] 2012 Caucasian Taqman PB 55 163 110 253 778 665 Multiple Myeloma Y Arisawa [49] 2013 Asian PCR-RFLP HB 68 239 172 103 435 342 Gastric Cancer N Cai [17] 2013 Asian Taqman HB 153 473 401 153 562 379 Renal Cell Carcinoma N Cheng [16] 2013 Asian PCR-RFLP HB 29 64 42 168 271 81 Hepatocellular Carcinoma Y Ebrahim [64] 2013 Asian Others HB 18 122 96 35 106 62 Breast Cancer Y Huang [50] 2013 Asian Taqman PB 225 459 372 210 491 355 Lung Cancer Y Huo [47] 2013 Asian PCR-RFLP HB 22 82 83 47 103 71 Epithelial Ovarian Cancer Y Kopp [65] 2013 Caucasian Taqman PB 54 152 128 64 161 109 Prostate Cancer Y Li [19] 2013 Asian PCR-RFLP HB 151 269 189 93 324 223 Bladder Cancer Y Suzairi [46] 2013 Asian PCR-RFLP HB 75 127 35 83 138 16 Colorectal Cancer N Umar [48] 2013 Asian PCR-RFLP HB 27 132 131 22 129 160 Esophageal Squambus Cell Carcinoma Y Gao [53] 2014 Asian Taqman HB 40 102 68 79 160 171 Liver Cancer N Hua [51] 2014 Asian Others HB 127 182 92 83 230 120 Gastric Cancer Y Liu [67] 2014 Asian Taqman PB 152 438 316 224 512 336 Nasopharyngeal Carcinoma Y Oltulu [54] 2014 Caucasian PCR-RFLP HB 16 44 35 6 47 46 Non-small Cell Lung Cancer Y Wang [66] 2014 Asian PCR-RFLP HB 171 210 93 123 216 162 Breast Cancer N Wang [68] 2014 Asian PCR-RFLP HB 106 186 60 171 209 79 Papillary Thyoid Carcinoma Y Zhang [52] 2014 Asian PCR-RFLP HB 419 312 205 1064 790 542 Hepatocellular Carcinoma N Chen [70] 2015 Asian Taqman HB 95 195 120 122 235 85 Ovarian Cancer Y Cui [59] 2015 Asian PCR-RFLP HB 99 246 198 186 355 212 Prostate Cancer Y Han [60] 2015 Asian PCR-RFLP HB 534 339 63 567 331 38 Prostate Cancer Y Kopp [56] 2015 Caucasian PCR-RFLP PB 146 449 320 253 787 679 Colorectal Cancer N Li [58] 2015 Asian PCR-RFLP HB 46 114 60 66 106 50 Osteosarcoma Y Pallavi [55] 2015 Asian PCR-RFLP HB 42 133 110 113 104 73 Cervical Carcinoma N Wang [69] 2015 Asian PCR-RFLP HB 89 219 113 131 205 89 Non-small Cell Lung Cancer Y Zhang [57] 2015 Asian PCR-RFLP HB 32 252 434 76 290 352 Lung Cancer Y Escobar [71] 2016 Mixed PCR-RFLP HB 19 37 61 31 41 44 Cutaneous Melanoma N Lu [61] 2016 Asian PCR-RFLP HB 221 351 115 253 339 95 Ovarian Cancer Y HB: hospital-based study; PB: population-based study; SOC: source of controls; HWE: Hardy Weinberg equilibrium.
39-61] of them were obeyed HWE while 13
studies [15, 19, 23, 62-71] were not.
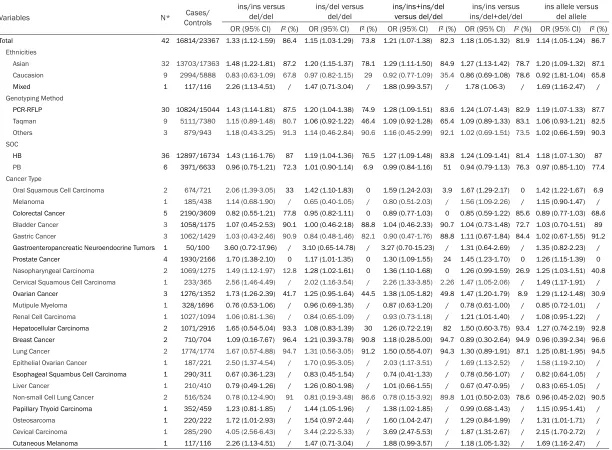
Meta-analysis results
Overall, the statistically significant association
between the NFκB1 promoter -94ins/del ATTG
polymorphism and cancer risk across the five
genetic models in the overall population were
evaluated by the pooled ORs (Homozygote
model, OR=1.33, 95% CI=1.12-1.59;
Heterozy-gote model, OR=1.15, 95% CI=1.03-1.29; D
o-
[image:4.612.88.524.87.603.2]and Allele model, OR=1.14, 95% CI=1.05-1.24).
Ethnic subgroup analyses showed cancer risk
significant increases in all five models among
Asians but not among Caucasians. The results
of SOC subgroup analysis reveled that the as-
sociation between the NFκB1 promoter -94ins/
del ATTG polymorphism and hospital-based
study is statistically significant. Stratified
ana-lysis was also performed in genotyping me-
thod, and significant associations were detect
-ed in all subgroups individually. The results of
cancer type subgroup analysis demonstrated
s
ignificant association
existed between the
NFκB1 -94ins allele and oral squamous cell
[image:5.612.90.524.72.552.2]Table 2.
Meta-analysis of the NFκB1 -94ins/del ATTG promoter polymorphism and cancer ris
k
Variables N* ControlsCases/
ins/ins versus
del/del ins/del versus del/del ins/ins+ins/del versus del/del ins/del+del/del ins/ins versus ins allele versus del allele
OR (95% CI) I² (%) OR (95% CI) I² (%) OR (95% CI) I² (%) OR (95% CI) I² (%) OR (95% CI) I² (%) Total 42 16814/23367 1.33 (1.12-1.59) 86.4 1.15 (1.03-1.29) 73.8 1.21 (1.07-1.38) 82.3 1.18 (1.05-1.32) 81.9 1.14 (1.05-1.24) 86.7
Ethnicities
Asian 32 13703/17363 1.48 (1.22-1.81) 87.2 1.20 (1.15-1.37) 78.1 1.29 (1.11-1.50) 84.9 1.27 (1.13-1.42) 78.7 1.20 (1.09-1.32) 87.1
Caucasion 9 2994/5888 0.83 (0.63-1.09) 67.8 0.97 (0.82-1.15) 29 0.92 (0.77-1.09) 35.4 0.86 (0.69-1.08) 78.6 0.92 (1.81-1.04) 65.8
Mixed 1 117/116 2.26 (1.13-4.51) / 1.47 (0.71-3.04) / 1.88 (0.99-3.57) / 1.78 (1.06-3) / 1.69 (1.16-2.47) /
Genotyping Method
PCR-RFLP 30 10824/15044 1.43 (1.14-1.81) 87.5 1.20 (1.04-1.38) 74.9 1.28 (1.09-1.51) 83.6 1.24 (1.07-1.43) 82.9 1.19 (1.07-1.33) 87.7
Taqman 9 5111/7380 1.15 (0.89-1.48) 80.7 1.06 (0.92-1.22) 46.4 1.09 (0.92-1.28) 65.4 1.09 (0.89-1.33) 83.1 1.06 (0.93-1.21) 82.5
Others 3 879/943 1.18 (0.43-3.25) 91.3 1.14 (0.46-2.84) 90.6 1.16 (0.45-2.99) 92.1 1.02 (0.69-1.51) 73.5 1.02 (0.66-1.59) 90.3
SOC
HB 36 12897/16734 1.43 (1.16-1.76) 87 1.19 (1.04-1.36) 76.5 1.27 (1.09-1.48) 83.8 1.24 (1.09-1.41) 81.4 1.18 (1.07-1.30) 87 PB 6 3971/6633 0.96 (0.75-1.21) 72.3 1.01 (0.90-1.14) 6.9 0.99 (0.84-1.16) 51 0.94 (0.79-1.13) 76.3 0.97 (0.85-1.10) 77.4
Cancer Type
Oral Squamous Cell Carcinoma 2 674/721 2.06 (1.39-3.05) 33 1.42 (1.10-1.83) 0 1.59 (1.24-2.03) 3.9 1.67 (1.29-2.17) 0 1.42 (1.22-1.67) 6.9
Melanoma 1 185/438 1.14 (0.68-1.90) / 0.65 (0.40-1.05) / 0.80 (0.51-2.03) / 1.56 (1.09-2.26) / 1.15 (0.90-1.47) /
Colorectal Cancer 5 2190/3609 0.82 (0.55-1.21) 77.8 0.95 (0.82-1.11) 0 0.89 (0.77-1.03) 0 0.85 (0.59-1.22) 85.6 0.89 (0.77-1.03) 68.6 Bladder Cancer 3 1058/1175 1.07 (0.45-2.53) 90.1 1.00 (0.46-2.18) 88.8 1.04 (0.46-2.33) 90.7 1.04 (0.73-1.48) 72.7 1.03 (0.70-1.51) 89
Gastric Cancer 3 1062/1429 1.03 (0.43-2.46) 90.9 0.84 (0.48-1.46) 82.1 0.90 (0.47-1.76) 88.8 1.11 (0.67-1.84) 84.4 1.02 (0.67-1.55) 91.2 Gastroenteropancreatic Neuroendocrine Tumors 1 50/100 3.60 (0.72-17.96) / 3.10 (0.65-14.78) / 3.27 (0.70-15.23) / 1.31 (0.64-2.69) / 1.35 (0.82-2.23) /
Prostate Cancer 4 1930/2166 1.70 (1.38-2.10) 0 1.17 (1.01-1.35) 0 1.30 (1.09-1.55) 24 1.45 (1.23-1.70) 0 1.26 (1.15-1.39) 0
Nasopharyngeal Carcinoma 2 1069/1275 1.49 (1.12-1.97) 12.8 1.28 (1.02-1.61) 0 1.36 (1.10-1.68) 0 1.26 (0.99-1.59) 26.9 1.25 (1.03-1.51) 40.8
Cervical Squamous Cell Carcinoma 1 233/365 2.56 (1.46-4.49) / 2.02 (1.16-3.54) / 2.26 (1.33-3.85) 2.26 1.47 (1.05-2.06) / 1.49 (1.17-1.91) /
Ovarian Cancer 3 1276/1352 1.73 (1.26-2.39) 41.7 1.25 (0.95-1.64) 44.5 1.38 (1.05-1.82) 49.8 1.47 (1.20-1.79) 8.9 1.29 (1.12-1.48) 30.9
Mutipule Myeloma 1 328/1696 0.76 (0.53-1.06) / 0.96 (0.69-1.35) / 0.87 (0.63-1.20) / 0.78 (0.61-1.00) / 0.85 (0.72-1.01) /
Renal Cell Carcinoma 1 1027/1094 1.06 (0.81-1.36) / 0.84 (0.65-1.09) / 0.93 (0.73-1.18) / 1.21 (1.01-1.40) / 1.08 (0.95-1.22) /
Hepatocellular Carcinoma 2 1071/2916 1.65 (0.54-5.04) 93.3 1.08 (0.83-1.39) 30 1.26 (0.72-2.19) 82 1.50 (0.60-3.75) 93.4 1.27 (0.74-2.19) 92.8
Breast Cancer 2 710/704 1.09 (0.16-7.67) 96.4 1.21 (0.39-3.78) 90.8 1.18 (0.28-5.00) 94.7 0.89 (0.30-2.64) 94.9 0.96 (0.39-2.34) 96.6
Lung Cancer 2 1774/1774 1.67 (0.57-4.88) 94.7 1.31 (0.56-3.05) 91.2 1.50 (0.55-4.07) 94.3 1.30 (0.89-1.91) 87.1 1.25 (0.81-1.95) 94.5
Epithelial Ovarian Cancer 1 187/221 2.50 (1.37-4.54) / 1.70 (0.95-3.05) / 2.03 (1.17-3.51) / 1.69 (1.13-2.52) / 1.58 (1.19-2.10) /
Esophageal Squambus Cell Carcinoma 1 290/311 0.67 (0.36-1.23) / 0.83 (0.45-1.54) / 0.74 (0.41-1.33) / 0.78 (0.56-1.07) / 0.82 (0.64-1.05) /
Liver Cancer 1 210/410 0.79 (0.49-1.26) / 1.26 (0.80-1.98) / 1.01 (0.66-1.55) / 0.67 (0.47-0.95) / 0.83 (0.65-1.05) /
Non-small Cell Lung Cancer 2 516/524 0.78 (0.12-4.90) 91 0.81 (0.19-3.48) 86.6 0.78 (0.15-3.92) 89.8 1.01 (0.50-2.03) 78.6 0.96 (0.45-2.02) 90.5
Papillary Thyoid Carcinoma 1 352/459 1.23 (0.81-1.85) / 1.44 (1.05-1.96) / 1.38 (1.02-1.85) / 0.99 (0.68-1.43) / 1.15 (0.95-1.41) /
Osteosarcoma 1 220/222 1.72 (1.01-2.93) / 1.54 (0.97-2.44) / 1.60 (1.04-2.47) / 1.29 (0.84-1.99) / 1.31 (1.01-1.71) /
Cevical Carcinoma 1 285/290 4.05 (2.56-6.43) / 3.44 (2.22-5.33) / 3.69 (2.47-5.53) / 1.87 (1.31-2.67) / 2.15 (1.70-2.72) /
Cutaneous Melanoma 1 117/116 2.26 (1.13-4.51) / 1.47 (0.71-3.04) / 1.88 (0.99-3.57) / 1.18 (1.05-1.32) / 1.69 (1.16-2.47) /
and cutaneous melanoma, while the
associa-tion were not revealed in colorectal cancer,
multiple myeloma and esophageal squamous
cell carcinoma in all 5 models.
Figure 2
reveals
the association between -94ins/del
polymor-phism in the promoter of NFκB1 and cancer
risk is statistically significant (data was extract
-ed from Homozygote model). All the results of
overall meta-analysis and subgroup analysis
were showed in
Table 2
.
Evaluation of publication bias
[image:7.612.92.373.75.265.2]We performed
Begg
’s funnel plot and Egger’s
test to evaluate publication bias, and no
evi-dence of publication bias was found for all
anal-yses. The funnel plot analysis was showed in
Figure 3
.
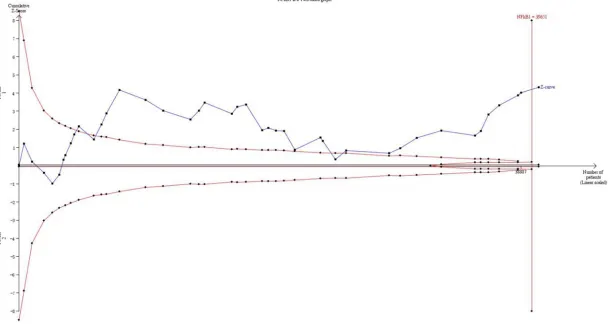
Trial sequential analysis
The result of TSA with a type I error of 5% on
NFκB1 promoter -94ins/del ATTG
polymorph-ism and cancer risk was provided in
Figure 4
.
42 studies which marked with black squares
were enrolled in TSA, and the result
demon-strated that the cumulative Z-curve (blue line
with black
squares) crosses the monitoring
boundary (red lines with black
diamonds). Ad-
ditionally, the cumulative Z-curve also crossed
the line represents the low-bias heterogene-
ity adjusted information size (39651 patients)
which was estimated by assuming a 10%
rela-tive risk reduction (RRR). The TSA result dem
-ved in the inflammatory pathway. Thus, NFκB is
constitutively active in most cancers [74].
NFκB1/p50 is one of the five family members
(the rest are RelA/p65, c-Rel, RelB and NFkB2/
P52) of NFκB transcription factors family [75],
which is among the major signaling pathways
participated in the cellular response to
environ-mental stress [13]. NFκB1 plays a significant
role in inhibiting cell apoptosis by regulating the
level of survival genes including bcl-2
homo-logue A1 [76], PAI-2 [77], and IAP gene family
[78]. In addition, previous studies have
sug-gested that NF
κB1 signaling pathway is
invol-ved in the process of cellular proliferation by
increasing IL-5 [79], promoting MAPK
phos-phorylation [13] and modulating cyclin D1
ex-pression [80]. In recent years, a -94ins/del AT-
TG polymorphism in the promoter region of
NF
κB1 was reported in association with the
risk of numerous cancers. Accumulated evi
-dence illustrated that the insertion allele that
can inhibit apoptosis and promote cellular
pro-liferation by upregulating the expression of
NFκB1 [14, 19, 62], which was implicated in
the mechanism mentioned above.
Several meta-analyses had studied on the as-
sociation between the NFκB1 promoter -94ins/
del ATTG polymorphism and cancer risk in the
past decade. However, the results of these
meta-analyses are not completely consistent.
For example, results of meta-analyses from
Yang et al [81] and Duan et al [82] showed
Figure 3. Funnel plot for publication bias test (for Homozygote model). Each circle represents an individual study for the indicated association.
onstrated statistical signifi
-cance in favor of the NFκB1
promoter -94ins/del ATTG
polymorphism can increase
cancer risk and the number
of participants enrolled in
this meta-analysis reached
the low-bias heterogeneity
adjusted information size.
Discussion
Studies involving NFκB has
grown tremendously in the
past decades since it was
discovered in 1986 by Sen
and Baltimore [4]. NFκB is one
of approximately 2000
esti-mated transcription factors
in human [72, 73], and is the
NFκB1 -94ins/del ATTG promoter
polymorph-ism can increase the overall cancer risk.
How-ever, this result was contradictory with the
meta-analysis performed by Zou et al [26].
Those contradictory results might be caused
by the bias due to limited samples enrolled in
meta-analyses.
After the reported study, numerous
high-quali-ty, large-sample case-control studies further
evaluated the relationship between the NFκB1
promoter -94ins/del ATTG polymorphism and
cancer risk. In this meta-analysis we enrolled
42 case-control studies with 16814 cases and
23367 controls. Our results indicated that the
NFκB1 -94ins allele was a risk factor of cancer.
The result in ethnicity subgroup analyses
indi-cated that the NFκB1 -94ins allele was a risk
factor on cancer in Asian and Mixed population
but had no effect on cancer in Caucasian
popu-lation. This discrepancy may caused by the
dif-ferent function of the -94ins/del polymorphism
in different populations, which may result from
interactions with non-genetic risk factors
inclu-ding diet, environment and lifestyle [83-86].
Our results indicated genotyping method will
not affect the result that the NFκB1 -94ins
allele was a risk factor on cancer. In SOC sub
-group analysis, the result suggested that the
-94ins allele was a risk factor on cancer in hos
-pital-based studies in all five models, but not in
population-based studies in dominant,
reces-sive and allele model. This result suggested
that more high-quality population-based
stud-ies with large samples should be enrolled in
meta-analysis to reduce the bias. We provided
the cancer type subgroup analysis and the
result suggested that except colorectal cancer,
multiple myeloma and esophageal squamous
cell carcinoma (the NFκB -94ins allele has no
association to cancer risk in all five models),
NFκB -94ins allele was a risk factor on the rest
types of cancer involved in our meta-analysis.
This result suggested that the NFκB1 gene
might function as a prominent factor in these
cancers.
The TSA result showed statistical significance
in favor of NFκB -94ins/del ATTG polymorphism
increasing cancer risk. In addition, the number
of samples has reached the low-bias
heteroge-neity adjusted information size (39651), which
suggested the evidence of our meta-analysis is
sufficient and the result is reliable and robust.
Limitations also inevitably existed in our
meta-analysis like any other meta-meta-analysis. First, we
only enrolled the articles which studied on
the association between the NFκB1 -94ins/del
polymorphism and cancer risk from genetic
perspective. Considering the complex of
mech-anism of tumor occurrence, more studies focus
on the interaction between gene and
environ-ment should be enrolled. Second, limited
stud-ies of some type of cancer were involved in
the meta-analysis, which could increase the
bias in subgroup analysis. On the other hand,
many several strengths were shown in our
metaanalysis. First, the number of articles,
samples enrolled in meta-analysis was much
larger than previous meta-analysis [81, 82,
86, 87]. Second, a more comprehensive
sub-group analysis by cancer type was performed
and the result suggested that the -94ins/del
polymorphism may play a different role in
dif-ferent cancer types. Third, the sufficient evi
-dence and robust result were proved by trial
sequential analysis.
In conclusion,our meta-analysis and TSA re-
sult suggested that the association between
NFκB -94ins/del polymorphism and cancer risk
is statistically significant and the association
might be ethnic-specific. The result of our
stu-dy will provide clues and evidence for further
therapeutic approaches target on interruption
of the NFκB signaling pathway.
Disclosure of conflict of interest
None.
Address correspondence to: Gong Cheng and Lixin Hua, Department of Urology, The First Affiliated Hospital of Nanjing Medical University, Nanjing 210029, China. Tel: +86 13813992799; E-mail: [email protected] (GC); Tel: +86 189- 13975911; E-mail: [email protected] (LXH)
References
[1] Roukos DH. Novel clinico-genome network modeling for revolutionizing genotype-pheno-type-based personalized cancer care. Expert Rev Mol Diagn 2010; 10: 33-48.
[2] Pharoah PD, Dunning AM, Ponder BA and Easton DF. Association studies for finding cancer-susceptibility genetic variants. Nat Rev Cancer 2004; 4: 850-860.
[4] Sen R and Baltimore D. Inducibility of kappa immunoglobulin enhancer-binding protein Nf-kappa B by a posttranslational mechanism. Cell 1986; 47: 921-928.
[5] Lin SC, Lu SY, Lee SY, Lin CY, Chen CH and Chang KW. Areca (betel) nut extract activates mitogen-activated protein kinases and NF-kap -paB in oral keratinocytes. Int J Cancer 2005; 116: 526-535.
[6] Canniff JP, Harvey W and Harris M. Oral sub-mucous fibrosis: its pathogenesis and man -agement. Br Dent J 1986; 160: 429-434. [7] Vermeulen L, De Wilde G, Notebaert S, Vanden
Berghe W and Haegeman G. Regulation of the transcriptional activity of the nuclear factor-kappaB p65 subunit. Biochem Pharmacol 2002; 64: 963-970.
[8] Beinke S and Ley SC. Functions of NF-kappaB1 and NF-kappaB2 in immune cell biology. Bio -chem J 2004; 382: 393-409.
[9] Barnes PJ. Nuclear factor-kappa B. Int J Bio -chem Cell Biol 1997; 29: 867-870.
[10] Mathew S, Murty VV, Dalla-Favera R and Cha -ganti RS. Chromosomal localization of genes encoding the transcription factors, c-rel, NF-kappa Bp50, NF-NF-kappa Bp65, and lyt-10 by fluorescence in situ hybridization. Oncogene 1993; 8: 191-193.
[11] Sun XF and Zhang H. NFκB and NFκBI polymor -phisms in relation to susceptibility of tumour and other diseases. Histol Histopathol 2007; 22: 1387-1398.
[12] Chen F, Castranova V, Shi X and Demers LM. New insights into the role of nuclear factor-kappaB, a ubiquitous transcription factor in the initiation of diseases. Clin Chem 1999; 45: 7-17.
[13] Yu Y, Wan Y and Huang C. The biological func-tions of NF-kappaB1 (p50) and its potential as an anti-cancer target. Curr Cancer Drug Tar -gets 2009; 9: 566-571.
[14] Karban AS, Okazaki T, Panhuysen CI, Gallegos T, Potter JJ, Bailey-Wilson JE, Silverberg MS, Duerr RH, Cho JH, Gregersen PK, Wu Y, Achkar JP, Dassopoulos T, Mezey E, Bayless TM, Nou -vet FJ and Brant SR. Functional annotation of a novel NFκB1 promoter polymorphism that increases risk for ulcerative colitis. Hum Mol Genet 2004; 13: 35-45.
[15] Lewander A, Butchi AK, Gao J, He LJ, Lindblom A, Arbman G, Carstensen J, Zhang ZY, Sun XF; Swedish Low-Risk Colorectal Cancer Study Group. Polymorphism in the promoter region of the NFκB1 gene increases the risk of spo -radic colorectal cancer in Swedish but not in Chinese populations. Scand J Gastroenterol 2007; 42: 1332-1338.
[16] Cheng CW, Su JL, Lin CW, Su CW, Shih CH, Yang SF and Chien MH. Effects of NFκB1 and
NFκBIA gene polymorphisms on hepatocellular carcinoma susceptibility and clinicopathologi-cal features. PLoS One 2013; 8: e56130. [17] Cai H, Sun L, Cui L, Cao Q, Qin C, Zhang G,
Mao X, Wang M, Zhang Z, Shao P and Yin C. A functional insertion/deletion polymorphism (-94ins/del ATTG) in the promoter region of the NFκB1 gene is related to the risk of renal cell carcinoma. Urol Int 2013; 91: 206-212. [18] Fan Y, Yu W, Ye P, Wang H, Wang Z, Meng Q,
Duan Y, Liang X and An W. NFκB1 insertion/ deletion promoter polymorphism increases the risk of advanced ovarian cancer in a Chinese population. DNA Cell Biol 2011; 30: 241-245. [19] Li P, Gu J, Yang X, Cai H, Tao J, Yang X, Lu Q,
Wang Z, Yin C and Gu M. Functional promoter -94ins/del ATTG polymorphism in NFκB1 gene is associated with bladder cancer risk in a Chi -nese population. PLoS One 2013; 8: e71604. [20] Meyre D, Froguel P, Horber FF and Kral JG.
Comment on: Valette et al. Melanocortin-4 re-ceptor mutations and polymorphisms do not affect weight loss after bariatric surgery. PLOS ONE 2012; 7(11):E48221. PLoS One 2014; 9: e93324.
[21] Song S, Chen D, Lu J, Liao J, Luo Y, Yang Z, Fu X, Fan X, Wei Y, Yang L, Wang L and Wang J. NFkappaB1 and NFkappaBIA polymorphisms are associated with increased risk for sporadic colorectal cancer in a southern Chinese popu-lation. PLoS One 2011; 6: e21726.
[22] Andersen V, Christensen J, Overvad K, Tjon-neland A and Vogel U. Polymorphisms in NFκB, PXR, LXR and risk of colorectal cancer in a pro -spective study of Danes. BMC Cancer 2010; 10: 484.
[23] Bu H, Rosdahl I, Sun XF and Zhang H. Impor -tance of polymorphisms in NF-kappaB1 and NF-kappaBIalpha genes for melanoma risk, clinicopathological features and tumor pro-gression in Swedish melanoma patients. J Cancer Res Clin Oncol 2007; 133: 859-866. [24] Zou YF, Yuan FL, Feng XL, Tao JH, Ding N, Pan
FM and Wang F. Association between NFκB1 -94ins/del ATTG promoter polymorphism and cancer risk: a meta-analysis. Cancer Invest 2011; 29: 78-85.
[25] Wang X, Lu P, Xu L, Xu Y, Shi Z, Xu J, Wang Y, Zhang J, Wang X, Cao L, Liu N, Yin Y and You Y. Updated meta-analysis of NFkappaB1 -94ins/ Del ATTG promoter polymorphism and cancer risk based on 19 case-control studies. Asian Pac J Cancer Prev 2011; 12: 2479-2484. [26] Zou YF, Wang F, Feng XL, Tao JH, Zhu JM, Pan
[27] DerSimonian R and Laird N. Meta-analysis in clinical trials. Control Clin Trials 1986; 7: 177-188.
[28] Mantel N and Haenszel W. Statistical aspects of the analysis of data from retrospective stud-ies of disease. J Natl Cancer Inst 1959; 22: 719-748.
[29] Wetterslev J, Thorlund K, Brok J and Gluud C. Trial sequential analysis may establish when firm evidence is reached in cumulative meta-analysis. J Clin Epidemiol 2008; 61: 64-75. [30] Moher D, Liberati A, Tetzlaff J, Altman DG and
Group P. Preferred reporting items for system-atic reviews and meta-analyses: the PRISMA statement. Int J Surg 2010; 8: 336-341. [31] Thorlund K, Devereaux PJ, Wetterslev J, Guyatt
G, Ioannidis JP, Thabane L, Gluud LL, Als-Nielsen B and Gluud C. Can trial sequential monitoring boundaries reduce spurious infer-ences from meta-analyses? Int J Epidemiol 2009; 38: 276-286.
[32] Brok J, Thorlund K, Gluud C and Wetterslev J. Trial sequential analysis reveals insufficient in -formation size and potentially false positive results in many meta-analyses. J Clin Epidemiol 2008; 61: 763-769.
[33] Brok J, Thorlund K, Wetterslev J and Gluud C. Apparently conclusive meta-analyses may be inconclusive--Trial sequential analysis adjust-ment of random error risk due to repetitive testing of accumulating data in apparently conclusive neonatal meta-analyses. Int J Epi-demiol 2009; 38: 287-298.
[34] Sormani MP. Modeling the distribution of new MRI cortical lesions in multiple sclerosis longi-tudinal studies by Sormani MP, Calabrese M, Signori A, Giorgio A, Gallo P, De Stefano N [PLoS One 2011;6(10):e26712. Epub 2011 October 20]. Mult Scler Relat Disord 2012; 1: 108.
[35] Afshari A, Brok J, Moller AM and Wetterslev J. Inhaled nitric oxide for acute respiratory dis-tress syndrome and acute lung injury in adults and children: a systematic review with meta-analysis and trial sequential meta-analysis. Anesth Analg 2011; 112: 1411-1421.
[36] Pogue J and Yusuf S. Overcoming the limita-tions of current meta-analysis of randomised controlled trials. Lancet 1998; 351: 47-52. [37] Pogue JM and Yusuf S. Cumulating evidence
from randomized trials: utilizing sequential monitoring boundaries for cumulative meta-analysis. Control Clin Trials 1997; 18: 580-593; discussion 661-586.
[38] Wetterslev J, Thorlund K, Brok J and Gluud C. Estimating required information size by quanti-fying diversity in random-effects model meta-analyses. BMC Med Res Methodol 2009; 9: 86.
[39] Lin SC, Liu CJ, Yeh WI, Lui MT, Chang KW and Chang CS. Functional polymorphism in NFκB1 promoter is related to the risks of oral squa -mous cell carcinoma occurring on older male areca (betel) chewers. Cancer Lett 2006; 243: 47-54.
[40] Lo SS, Chen JH, Wu CW and Lui WY. Functional polymorphism of NFκB1 promoter may corre -late to the susceptibility of gastric cancer in aged patients. Surgery 2009; 145: 280-285. [41] Burnik FS and Yalcin S. NFκB1 -94 insertion/
deletion ATTG polymorphism in gastroentero-pancreatic neuroendocrine tumors. Chemo-therapy 2009; 55: 381-385.
[42] Zhou B, Rao L, Li Y, Gao L, Wang Y, Chen Y, Xue H, Song Y, Peng Y, Liao M and Zhang L. A func-tional insertion/deletion polymorphism in the promoter region of NFκB1 gene increases sus -ceptibility for nasopharyngeal carcinoma. Can-cer Lett 2009; 275: 72-76.
[43] Zhang P, Wei Q, Li X, Wang K, Zeng H, Bu H and Li H. A functional insertion/deletion polymor-phism in the promoter region of the NFκB1 gene increases susceptibility for prostate can-cer. Cancer Genet Cytogenet 2009; 191: 73-77.
[44] Zhou B, Qie M, Wang Y, Yan L, Zhang Z, Liang A, Wang T, Wang X, Song Y and Zhang L. Relation-ship between NFκB1 -94 insertion/deletion ATTG polymorphism and susceptibility of cervi-cal squamous cell carcinoma risk. Ann Oncol 2010; 21: 506-511.
[45] Vangsted AJ, Nielsen KR, Klausen TW, Haukaas E, Tjonneland A and Vogel U. A functional poly-morphism in the promoter region of the IL1B gene is associated with risk of multiple myelo -ma. Br J Haematol 2012; 158: 515-518. [46] Mohd Suzairi MS, Tan SC, Ahmad Aizat AA,
Mohd Aminudin M, Siti Nurfatimah MS, Andee ZD and Ankathil R. The functional -94 inser -tion/deletion ATTG polymorphism in the pro-moter region of NFκB1 gene increases the risk of sporadic colorectal cancer. Cancer Epide-miol 2013; 37: 634-638.
[47] Huo ZH, Zhong HJ, Zhu YS, Xing B and Tang H. Roles of functional NFκB1 and beta-TrCP inser -tion/deletion polymorphisms in mRNA expres-sion and epithelial ovarian cancer susceptibili-ty. Genet Mol Res 2013; 12: 3435-3443. [48] Umar M, Upadhyay R, Kumar S, Ghoshal UC
and Mittal B. Association of common polymor -phisms in TNFA, NFκB1 and NFκBIA with risk and prognosis of esophageal squamous cell carcinoma. PLoS One 2013; 8: e81999. [49] Arisawa T, Tahara T, Shiroeda H, Yamada K,
-ceptibility to the diffuse type of gastric cancer. Oncol Rep 2013; 30: 3013-3019.
[50] Huang D, Yang L, Liu Y, Zhou Y, Guo Y, Pan M, Wang Y, Tan Y, Zhong H, Hu M, Lu W, Ji W, Wang J, Ran P, Zhong N, Zhou Y and Lu J. Functional polymorphisms in NFkappaB1/IkappaBalpha predict risks of chronic obstructive pulmonary disease and lung cancer in Chinese. Hum Genet 2013; 132: 451-460.
[51] Hua T, Qinsheng W, Xuxia W, Shuguang Z, Ming Q, Zhenxiong L and Jingjie W. Nuclear factor-kappa B1 is associated with gastric cancer in a Chinese population. Medicine (Baltimore) 2014; 93: e279.
[52] Zhang Q, Ji XW, Hou XM, Lu FM, Du Y, Yin JH, Sun XY, Deng Y, Zhao J, Han X, Yang GS, Zhang HW, Chen XM, Shen HB, Wang HY and Cao GW. Effect of functional nuclear factor-kappaB ge -netic polymorphisms on hepatitis B virus per -sistence and their interactions with viral muta-tions on the risk of hepatocellular carcinoma. Ann Oncol 2014; 25: 2413-2419.
[53] Gao J, Xu HL, Gao S, Zhang W, Tan YT, Roth-man N, Purdue M, Gao YT, Zheng W, Shu XO and Xiang YB. Genetic polymorphism of NFκB1 and NFκBIA genes and liver cancer risk: a nest -ed case-control study in Shanghai, China. BMJ Open 2014; 4: e004427.
[54] Oltulu YM, Coskunpinar E, Ozkan G, Aynaci E, Yildiz P, Isbir T and Yaylim I. Investigation of NF-kappaB1 and NF-kappaBIA gene polymor -phism in non-small cell lung cancer. Biomed Res Int 2014; 2014: 530381.
[55] Pallavi S, Anoop K, Showket H, Alo N and Mausumi B. NFκB1/NFκBIa polymorphisms are associated with the progression of cervical carcinoma in HPV-infected postmenopausal women from rural area. Tumour Biol 2015; 36: 6265-6276.
[56] Kopp TI, Andersen V, Tjonneland A and Vogel U. Polymorphisms in NFκB1 and TLR4 and inter -action with dietary and life style factors in rela-tion to colorectal cancer in a Danish prospec -tive case-cohort study. PLoS One 2015; 10: e0116394.
[57] Zhang JW, Chen QS, Zhai JX, Lv PJ and Sun XY. Polymorphisms in NF-kappaB pathway genes & their association with risk of lung cancer in the Chinese population. Pak J Med Sci 2015; 31: 1411-1416.
[58] Li X, Zhang C, Qiao W, Zhou X and Sun M. NFκB1 -94ins/del ATTG polymorphism increas -es osteosarcoma risk in a Chin-ese Han popula -tion. Int J Clin Exp Med 2015; 8: 1420-1423. [59] Knobloch TJ, Uhrig LK, Pearl DK, Casto BC,
Warner BM, Clinton SK, Sardo-Molmenti CL, Ferguson JM, Daly BT, Riedl K, Schwartz SJ, Vodovotz Y, Buchta AJ Sr, Schuller DE, Ozer E, Agrawal A and Weghorst CM. Suppression of
proinflammatory and prosurvival biomarkers in oral cancer patients consuming a black rasp -berry phytochemical-rich troche. Cancer Prev Res (Phila) 2016; 9: 159-171.
[60] Han X, Zhang JJ, Yao N, Wang G, Mei J, Li B, Li C and Wang ZA. Polymorphisms in NFκB1 and NFκBIA genes modulate the risk of developing prostate cancer among Han Chinese. Med Sci Monit 2015; 21: 1707-1715.
[61] Lu ZH, Gu XJ, Shi KZ, Li X, Chen DD and Chen L. Association between genetic polymorphisms of inflammatory response genes and the risk of ovarian cancer. J Formos Med Assoc 2016; 115: 31-37.
[62] Riemann K, Becker L, Struwe H, Rubben H, Eisenhardt A and Siffert W. Insertion/deletion polymorphism in the promoter of NFκB1 as a potential molecular marker for the risk of re -currence in superficial bladder cancer. Int J Clin Pharmacol Ther 2007; 45: 423-430. [63] Tang T, Cui S, Deng X, Gong Z, Jiang G, Wang P,
Liao B, Fei Z, Xian S, Zeng D and Li J. Insertion/ deletion polymorphism in the promoter region of NFκB1 gene increases susceptibility for su -perficial bladder cancer in Chinese. DNA Cell Biol 2010; 29: 9-12.
[64] Eskandari-Nasab E, Hashemi M, Ebrahimi M and Amininia S. The functional 4-bp insertion/ deletion ATTG polymorphism in the promoter region of NF-KB1 reduces the risk of BC. Can -cer Biomark 2016; 16: 109-115.
[65] Kopp TI, Friis S, Christensen J, Tjonneland A and Vogel U. Polymorphisms in genes related to inflammation, NSAID use, and the risk of prostate cancer among Danish men. Cancer Genet 2013; 206: 266-278.
[66] Wang Z, Liu QL, Sun W, Yang CJ, Tang L, Zhang X and Zhong XM. Genetic polymorphisms in inflammatory response genes and their asso -ciations with breast cancer risk. Croat Med J 2014; 55: 638-646.
[67] Liu Y, Qiu F, Yang L, Yang R, Yang X, Huang D, Fang W, Zhang L, Jiang Q, Zhang L, Zhou Y and Lu J. Polymorphisms of NFkappaB1 and Ikap -paBalpha and their synergistic effect on naso -pharyngeal carcinoma susceptibility. Biomed Res Int 2015; 2015: 362542.
[68] Wang X, Peng H, Liang Y, Sun R, Wei T, Li Z, Gong Y, Gong R, Liu F, Zhang L and Zhu J. A functional insertion/deletion polymorphism in the promoter region of the NFκB1 gene in -creases the risk of papillary thyroid carcino-ma. Genet Test Mol Biomarkers 2015; 19: 167-171.
[70] Chen LP, Cai PS and Liang HB. Association of the genetic polymorphisms of NFκB1 with sus -ceptibility to ovarian cancer. Genet Mol Res 2015; 14: 8273-8282.
[71] Escobar GF, Arraes JA, Bakos L, Ashton-Prolla P, Giugliani R, Callegari-Jacques SM, Santos S and Bakos RM. Polymorphisms in CYP19A1 and NFκB1 genes are associated with cutane -ous melanoma risk in southern Brazilian pa -tients. Melanoma Res 2016; 26: 348-53. [72] Lander ES, Linton LM, Birren B, Nusbaum C,
Zody MC, Baldwin J, Devon K, Dewar K, Doyle M, FitzHugh W, Funke R, Gage D, Harris K, Hea -ford A, Howland J, Kann L, Lehoczky J, LeVine R, McEwan P, McKernan K, Meldrim J, Mesirov JP, Miranda C, Morris W, Naylor J, Raymond C, Rosetti M, Santos R, Sheridan A, Sougnez C, Stange-Thomann Y, Stojanovic N, Subramani-an A, WymSubramani-an D, Rogers J, Sulston J, Ainscough R, Beck S, Bentley D, Burton J, Clee C, Carter N, Coulson A, Deadman R, Deloukas P, Dun -ham A, Dun-ham I, Durbin R, French L, Graf-ham D, Gregory S, Hubbard T, Humphray S, Hunt A, Jones M, Lloyd C, McMurray A, Matthews L, Mercer S, Milne S, Mullikin JC, Mungall A, Plumb R, Ross M, Shownkeen R, Sims S, Wa -terston RH, Wilson RK, Hillier LW, McPherson JD, Marra MA, Mardis ER, Fulton LA, Chinwalla AT, Pepin KH, Gish WR, Chissoe SL, Wendl MC, Delehaunty KD, Miner TL, Delehaunty A, Kram -er JB, Cook LL, Fulton RS, Johnson DL, Minx PJ, Clifton SW, Hawkins T, Branscomb E, Predki P, Richardson P, Wenning S, Slezak T, Doggett N, Cheng JF, Olsen A, Lucas S, Elkin C, Uberbach -er E, Frazi-er M, Gibbs RA, Muzny DM, Sch-er-er SE, Bouck JB, Sodergren EJ, Worley KC, Rives CM, Gorrell JH, Metzker ML, Naylor SL, Kucher -lapati RS, Nelson DL, Weinstock GM, Sakaki Y, Fujiyama A, Hattori M, Yada T, Toyoda A, Itoh T, Kawagoe C, Watanabe H, Totoki Y, Taylor T, Weissenbach J, Heilig R, Saurin W, Artiguenave F, Brottier P, Bruls T, Pelletier E, Robert C, Wincker P, Smith DR, Doucette-Stamm L, Ru -benfield M, Weinstock K, Lee HM, Dubois J, Rosenthal A, Platzer M, Nyakatura G, Taudien S, Rump A, Yang H, Yu J, Wang J, Huang G, Gu J, Hood L, Rowen L, Madan A, Qin S, Davis RW, Federspiel NA, Abola AP, Proctor MJ, Myers RM, Schmutz J, Dickson M, Grimwood J, Cox DR, Olson MV, Kaul R, Raymond C, Shimizu N, Kawasaki K, Minoshima S, Evans GA, Athana -siou M, Schultz R, Roe BA, Chen F, Pan H, Ramser J, Lehrach H, Reinhardt R, McCombie WR, de la Bastide M, Dedhia N, Blocker H, Hornischer K, Nordsiek G, Agarwala R, Aravind L, Bailey JA, Bateman A, Batzoglou S, Birney E, Bork P, Brown DG, Burge CB, Cerutti L, Chen HC, Church D, Clamp M, Copley RR, Doerks T, Eddy SR, Eichler EE, Furey TS, Galagan J,
Gil-bert JG, Harmon C, Hayashizaki Y, Haussler D, Hermjakob H, Hokamp K, Jang W, Johnson LS, Jones TA, Kasif S, Kaspryzk A, Kennedy S, Kent WJ, Kitts P, Koonin EV, Korf I, Kulp D, Lancet D, Lowe TM, McLysaght A, Mikkelsen T, Moran JV, Mulder N, Pollara VJ, Ponting CP, Schuler G, Schultz J, Slater G, Smit AF, Stupka E, Szusta -kowki J, Thierry-Mieg D, Thierry-Mieg J, Wagner L, Wallis J, Wheeler R, Williams A, Wolf YI, Wolfe KH, Yang SP, Yeh RF, Collins F, Guyer MS, Peterson J, Felsenfeld A, Wetterstrand KA, Pa-trinos A, Morgan MJ, de Jong P, Catanese JJ, Osoegawa K, Shizuya H, Choi S, Chen YJ, Szustakowki J; International Human Genome Sequencing Consortium. Initial sequencing and analysis of the human genome. Nature 2001; 409: 860-921.
[73] GuhaThakurta D. Computational identification of transcriptional regulatory elements in DNA sequence. Nucleic Acids Res 2006; 34: 3585-3598.
[74] Chaturvedi MM, Sung B, Yadav VR, Kannappan R and Aggarwal BB. NF-kappaB addiction and its role in cancer: ‘one size does not fit all’. On -cogene 2011; 30: 1615-1630.
[75] Vallabhapurapu S and Karin M. Regulation and function of NF-kappaB transcription factors in the immune system. Annu Rev Immunol 2009; 27: 693-733.
[76] Karsan A, Yee E, Kaushansky K and Harlan JM. Cloning of human Bcl-2 homologue: inflamma -tory cytokines induce human A1 in cultured endothelial cells. Blood 1996; 87: 3089-3096. [77] Kumar S and Baglioni C. Protection from tumor
necrosis factor-mediated cytolysis by overex-pression of plasminogen activator inhibitor type-2. J Biol Chem 1991; 266: 20960-20964. [78] LaCasse EC, Baird S, Korneluk RG and MacK -enzie AE. The inhibitors of apoptosis (IAPs) and their emerging role in cancer. Oncogene 1998; 17: 3247-3259.
[79] Yang L, Cohn L, Zhang DH, Homer R, Ray A and Ray P. Essential role of nuclear factor kappaB in the induction of eosinophilia in allergic air-way inflammation. J Exp Med 1998; 188: 1739-1750.
[80] Shukla S, Maclennan GT, Marengo SR, Resnick MI and Gupta S. Constitutive activation of P I3 K-Akt and NF-kappaB during prostate can -cer progression in autochthonous transgenic mouse model. Prostate 2005; 64: 224-239. [81] Yang X, Li P, Tao J, Qin C, Cao Q, Gu J, Deng X,
Wang J, Liu X, Wang Z, Wu B, Gu M, Lu Q and Yin C. Association between NFκB1 -94ins/del ATTG promoter polymorphism and cancer sus-ceptibility: an updated meta-analysis. Int J Ge-nomics 2014; 2014: 612972.
-94ins/del ATTG polymorphism and cancer risk: an updated meta-analysis. Cancer Invest 2014; 32: 311-320.
[83] Andersen V, Holst R, Kopp TI, Tjonneland A and Vogel U. Interactions between diet, lifestyle and IL10, IL1B, and PTGS2/COX-2 gene poly -morphisms in relation to risk of colorectal can -cer in a prospective Danish case-cohort study. PLoS One 2013; 8: e78366.
[84] Hutter CM, Mechanic LE, Chatterjee N, Kraft P, Gillanders EM; NCI Gene-Environment Think Tank. Gene-environment interactions in cancer epidemiology: a national cancer institute think tank report. Genet Epidemiol 2013; 37: 643-657.
[85] Liu J, Huang J, Zhang Y, Lan Q, Rothman N, Zheng T and Ma S. Identification of gene-envi -ronment interactions in cancer studies using penalization. Genomics 2013; 102: 189-194. [86] Nickels S, Truong T, Hein R, Stevens K, Buck K,
Behrens S, Eilber U, Schmidt M, Haberle L, Vri -eling A, Gaudet M, Figueroa J, Schoof N, Spur-dle AB, Rudolph A, Fasching PA, Hopper JL, Makalic E, Schmidt DF, Southey MC, Beck -mann MW, Ekici AB, Fletcher O, Gibson L, Silva Idos S, Peto J, Humphreys MK, Wang J, Cordi-na-Duverger E, Menegaux F, Nordestgaard BG, Bojesen SE, Lanng C, Anton-Culver H, Ziogas A, Bernstein L, Clarke CA, Brenner H, Muller H, Arndt V, Stegmaier C, Brauch H, Bruning T, Harth V, Genica N, Mannermaa A, Kataja V, Kosma VM, Hartikainen JM, kConFab, Group AM, Lambrechts D, Smeets D, Neven P, Pari -daens R, Flesch-Janys D, Obi N, Wang-Gohrke S, Couch FJ, Olson JE, Vachon CM, Giles GG, Severi G, Baglietto L, Offit K, John EM, Miron A, Andrulis IL, Knight JA, Glendon G, Mulligan AM, Chanock SJ, Lissowska J, Liu J, Cox A, Cramp H, Connley D, Balasubramanian S, Dunning AM, Shah M, Trentham-Dietz A, Newcomb P, Titus L, Egan K, Cahoon EK, Rajaraman P, Sig-urdson AJ, Doody MM, Guenel P, Pharoah PD, Schmidt MK, Hall P, Easton DF, Garcia-Closas M, Milne RL and Chang-Claude J. Evidence of gene-environment interactions between com-mon breast cancer susceptibility loci and es-tablished environmental risk factors. PLoS Genet 2013; 9: e1003284.
Supplementary Table 1.
Newcastle-Ottawa Scale was
per-formed to estimate the strength of the evidence of included
studies
Author Year NOS score Author Year NOS score
Lin [39] 2006 6 Kopp [65] 2013 8
Bu-1 [23] 2007 8 Li [19] 2013 7
Bu-2 [23] 2007 8 Suzairi [46] 2013 7
Lewander [15] 2007 7 Umar [48] 2013 7
Riemann [62] 2007 7 Gao [53] 2014 7
Lo [40] 2008 6 Hua [51] 2014 7
Barnik [41] 2009 6 Liu [67] 2014 6
Tang [63] 2009 7 Oltulu [54] 2014 8
Zhang [43] 2009 7 Wang [66] 2014 7
Zhou [42] 2009 7 Wang [68] 2014 8
Andersen [22] 2010 8 Zhang [52] 2014 7
Zhou [44] 2010 7 Chen [70] 2015 8
Fan [18] 2011 7 Cui [59] 2015 8
Lin [20] 2012 7 Han [60] 2015 7
Vangsted [45] 2012 8 Kopp [56] 2015 8
Arisawa [49] 2013 8 Li [58] 2015 7
Cai [17] 2013 7 Pallavi [55] 2015 7
Cheng [16] 2013 7 Wang [69] 2015 8
Ebrahim [64] 2013 8 Zhang [57] 2015 7
Huang [50] 2013 7 Escobar [71] 2016 7
Huo [47] 2013 7 Lu [61] 2016 8