Proceedings of the First Workshop on Trolling, Aggression and Cyberbullying, pages 12–18 12
RiTUAL-UH at TRAC 2018 Shared Task: Aggression Identification
Niloofar Safi Samghabadi Deepthi Mave Sudipta Kar Thamar Solorio
Department of Computer Science University of Houston Houston, TX 77204-3010
{nsafisamghabadi, dmave, skar3, tsolorio}@uh.edu
Abstract
This paper presents our system for “TRAC 2018 Shared Task on Aggression Identification”. Our best systems for the English dataset use a combination of lexical and semantic features. However, for Hindi data using only lexical features gave us the best results. We obtained weighted F1-measures of 0.5921 for the English Facebook task (ranked 12th), 0.5663 for the English Social Media task (ranked 6th), 0.6292 for the Hindi Facebook task (ranked 1st), and 0.4853 for the Hindi Social Media task (ranked 2nd).
1 Introduction
Users’ activities on social media is increasing at a fast rate. Unfortunately, a lot of people misuse these online platforms to harass, threaten, and bully other users. This growing aggression against social media users has caused serious effects on victims, which can even lead them to harm themselves. The TRAC 2018 Shared Task on Aggression Identification (Kumar et al., 2018a) aims at developing a classifier that could make a 3-way classification of a given data instance between “Overtly Aggressive”, “Covertly Aggressive”, and “Non-aggressive”. We present here the different systems we submitted to the shared task, which mainly use lexical and semantic features to distinguish different levels of aggression over multiple datasets from Facebook and other social media that cover both English and Hindi texts.
2 Related Work
In recent years, several studies have been done towards detecting abusive and hateful language in online texts. Some of these works target different online platforms like Twitter (Waseem and Hovy, 2016), Wikipedia (Wulczyn et al., 2016), and ask.fm (Samghabadi et al., 2017) to encourage other research groups to contribute to aggression identification in these sources.
Most of the approaches proposed to detect offensive language in social media make use of multiple types of hand-engineered features. Nobata et al. (2016) use n-grams, linguistic, syntactic and distri-butional semantic features to build a hate speech detection framework over Yahoo! Finance and News and get an F-score of 81% for a combination of all features. Davidson et al. (2017) combine n-grams, POS-colored n-grams, and sentiment lexicon features to detect hate speech on Twitter data. Van Hee et al. (2015) use word and character n-grams along with sentiment lexicon features to identify nasty posts in ask.fm. Samghabadi et al. (2017) build a model based on lexical, semantic, sentiment, and stylistic features to detect nastiness in ask.fm. They also show the robustness of the model by applying it to the dataset from different other sources.
Based on Malmasi and Zampieri (2018), distinguishing hate speech from profanity is not a trivial task and requires features that capture deeper information from the comments. In this paper, we try different combinations of lexical, semantic, sentiment, and lexicon-based features to identify various levels of aggression in online texts.
3 Methodology and Data
3.1 Data
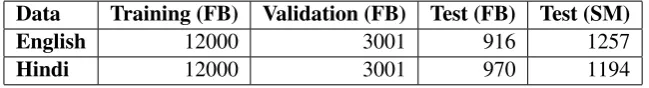
Data Training (FB) Validation (FB) Test (FB) Test (SM)
English 12000 3001 916 1257
[image:2.595.137.462.115.159.2]Hindi 12000 3001 970 1194
Table 1: Data distribution for English and Hindi corpus
The datasets were provided by Kumar et al. (2018b). Table 1 shows the distribution of training, validation and test (Facebook and social media) data for English and Hindi corpora. The data has been labeled with one out of three possible tags:
• Non-aggressive (NAG):There is no aggression in the text.
• Overtly aggressive (OAG):The text is containing either aggressive lexical items or certain syntac-tic structures.
• Covertly aggressive (CAG):The text is containing an indirect attack against the target using polite expressions in most cases.
3.2 Data Pre-processing
Generally the data from social media resources is noisy, grammar and syntactic errors are common, with a lot of ad-hoc spellings, that make it hard to analyze. Therefore, we first put our efforts to clean and prepare the data to feed it to our systems. For the English dataset, we lowercased the data and removed URLs, Email addresses, and numbers. We also did minor stemming by removing “ing”, plural and possessive “s”, and replaced a few common abstract grammatical forms with the formal versions.
On manual inspection of the training data for Hindi, we found that some of the instances are Hindi-English code-mixed, some use Roman script for Hindi and others are in Devanagari. Only 26% of the training data is in Devanagari script. We normalize the data by transliterating instances in Devanagari to Roman script. These instances are identified using Unicode pattern matching and are transliterated to Roman script usingindic-transtransliteration tool1. For further analysis, we run an in-house word-level language identification system on the training data (Mave et al., 2018). This CRF system is trained on Facebook posts and has an F1-weighted score of 97%. Approximately 60% of the training data is code-mixed, 39% is only Hindi and0.42%is only English.
3.3 Features
We make use of the following features:
Lexical: Words are powerful mediums to convey a feeling, describe or express ideas. With this notion, we use wordn-grams (n=1, 2, 3), charn-grams (n=3, 4, 5), andk-skipn-grams (k=2, n=2, 3) as features. We weigh each term with its term frequency-inverse document frequency (TF-IDF). We also consider using another weighting scheme by trying binary wordn-grams (n=1, 2, 3).
Word Embeddings: The idea behind this approach is to use a vector space model for extracting se-mantic information from the text (Le and Mikolov, 2014). For the embedding model we use pre-trained vectors trained on part of Google News dataset including about 3 million words2. We computed word embeddings feature vectors by averaging the word vector of all the words in each comment. We skip the words which are not in the vocabulary of the pre-trained model. This representation is only used for English data and the coverage of the Google word embedding is 63% for this corpus.
1
https://github.com/libindic/indic-trans
Sentiment: We use Stanford Sentiment Analysis tool (Socher et al., 2013)3 to extract fine-grained sen-timent distribution of each comment. For every message, we calculate the mean and standard deviation of sentiment distribution over all sentences and use them as feature vector.
LIWC (Linguistic Inquiry and Word Count): LIWC2007 (Pennebaker et al., 2007) includes around 70 word categories to analyze different language dimensions. In our approach, we only use the categories related to positive or negative emotions and self-references. To build the feature vectors in this case, we use a normalized count of words separated by any of the mentioned categories. This feature is only applicable to English data.
Gender Probability: Following the approach in Waseem (2016) we use the Twitter based lexicon pre-sented in Sap et al. (2014) to calculate the probability of gender. We also convert these probabilities to binary gender by considering the positive cases as female and the rest as male. We make the feature vec-tors with the probability of the gender and binary gender for each message. This feature is not applicable to Hindi corpus.
4 Experiments and Results 4.1 Experimental Settings
For both datasets, we trained several classification models using different combinations of features dis-cussed in 3.3. Since this is a multi-class classification task, we use a one-versus-rest classifier which trains a separate classifier for each class and labels each comment with the class with highest predicted probability across all classifiers. We tried Logistic Regression and linear SVM as the estimator for the classifier. We decided to use Logistic Regression in our final systems, since it works better in the valida-tion phase. We implemented all models using scikit-learn tool4.
4.2 Results
To build our best systems for both English and Hindi data, we experimented with several models using the different combinations of available features. Table 2 shows the validation results on training and validation sets.
F1-weighted
Feature English Hindi
Unigram (U) 0.5804 0.6159
Bigram (B) 0.4637 0.5195
Trigram (T) 0.3846 0.4300
Char 3gram (C3) 0.5694 0.6065
Char 4gram (C4) 0.5794 0.6212
Char 5gram (C5) 0.5758 0.6195
Word Embeddings (W2V) 0.5463 N/A
Sentiment (S) 0.3961 N/A
LIWC 0.4350 N/A
Gender Probability (GP) 0.3440 N/A BU + U + C4 + C5 + W2V 0.5875 N/A
C3 + C4 + C5 0.5494 0.6207
[image:3.595.186.413.448.657.2]U + C3 + C4 + C5 0.5541 0.6267
Table 2: Validation results for different features for the English and Hindi datasets using Logistic Re-gression model. In this table BU stands for Binary Unigram.
Table 3 shows the results of our three submitted systems for the English Facebook and Social Media data. In all three systems, we used the same set of features as follows: binary unigram, word unigram,
3
https://nlp.stanford.edu/sentiment/code.html
character n-grams of length 4 and 5, and word embeddings. In the first system, we used both train and validation sets for training our ensemble classifier. In the second system we only used the train data for training the model. The only difference between the second and the third models is that we corrected the misspellings using PyEnchant5 spell checking tool. Unfortunately, we could not try applying the sentiment and lexicon-based features after spell correction due to the restrictions on the total number of submissions. However, we believe that it can improve the performance of the system.
F1 (weighted)
System FB SM
Random Baseline 0.3535 0.3477
System 1 0.5673 0.5453
System 2 0.5847 0.5391
[image:4.595.214.387.157.241.2]System 3 0.5921 0.5663
Table 3: Results for the English test set. FB: Facebook and SM: Social Media.
F1 (weighted)
System FB SM
Random Baseline 0.3571 0.3206
System 1 0.6451 0.4853
[image:4.595.212.388.289.359.2]System 2 0.6292 0.4689
Table 4: Results for the Hindi test set. FB: Facebook and SM: Social Media.
Table 4 shows the performance of our systems for the Hindi Facebook and social media data. For the Hindi dataset, the combination of word unigrams, character n-grams of length 3, 4 and 5 gives the best performance over the validation set. These features capture the word usage distribution across classes. Both System 1 and System 2 use these features, trained over training set only and training and validation sets respectively.
4.3 Analysis
Looking at the mislabeled instances at validation phase, we found that there are two main reasons for the classifier mistakes:
1. Perceived level of aggression can be subjective. There are some examples in the validation dataset where the label is CAG but it is more likely to be OAG and vice versa. Table 5 shows some of these examples.
2. There are several typos and misspellings in the data that affect the performance.
Label
Language Example Actual Predicted
English What has so far Mr.Yechuri done for this Country. Ask him to shut down his bloody
piehole for good or I if given the chance will crap on his mouth hole. CAG OAG The time you tweeted is around 3 am morning,,which is not at all a namaz time.,As
you bollywood carrier is almost finished, you are preparing yourself for politics by these comments.
OAG CAG
Hindi ajeeb chutya hai.... kahi se course kiya hai ya paida hee chutya hua tha CAG OAG
Salman aur aamir ki kounsi movie release huyee jo aandhi me dub gaye?? ?Bikau
[image:4.595.71.523.622.725.2]chatukar media OAG CAG
Table 5: Misclassified examples in case of the aggression level
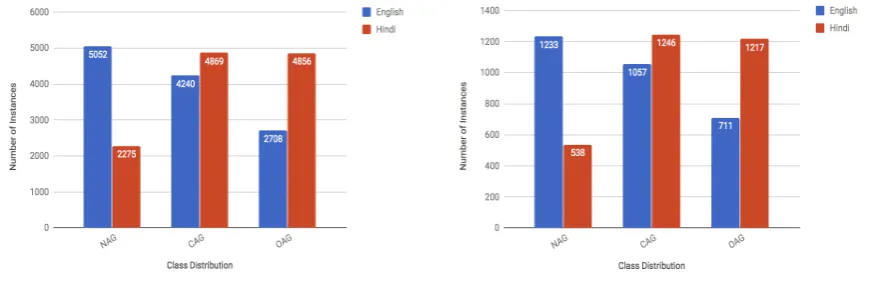
Also, it is obvious from Figure 1 that Hindi corpus is more balanced than the English one in case of OAG and CAG instances. That could be a good reason why the performance of the lexical features is better for Hindi data.
[image:5.595.82.518.121.263.2](a) Data distribution for training sets (b) Data distribution for evaluation sets
Figure 1: Label distribution comparison between training and evaluation sets
Table 6 illustrates the most informative features learned by the classifier for all three classes in Hindi data. We observe that word unigrams and character trigrams are the most important features for the system. From the table, the top features for CAG are mostly swear words in Hindi and character n-grams of the swear words. More English words appear in the top list for NAG than the other two classes. There is no overlap between these features with top features from either CAG or OAG. Our system has difficulty differentiating between OAG and CAG when there is no strong swear word in the comments.
NAG CAG OAG
unigram : unigram ? char tri gram kut
unigram mera unigram baki unigram bc
unigram bike unigram ?? char tri gram cho
unigram jai unigram pm char 4 gram kut
unigram main unigram o unigram chutiya
unigram sahi char tri gram ky unigram maa unigram ... unigram badla unigram mc unigram launch cha tri gram yad unigram gand
[image:5.595.165.435.419.571.2]unigram jay char 5 gram e... char tri gram tiy char tri gram mer unigram 3 char tri gram chu
Table 6: Top 10 features learned by System 1 for each class for the Hindi dataset.
Figure 2a shows the confusion matrix of our best model for all three classes in English Facebook corpus. The most interesting part of this figure is that the classifier mislabeled several NAG instances with CAG label. Since our system is mostly based on lexical features, we can conclude that there are much fewer profanities in CAG instances comparing with the OAG ones, which make it hard to distinguish them from NAG examples without considering the sentiment aspects of the messages. This fact can also be proved by looking at Figure 2b, since it seems that the classifier was also confused to label CAG instances in both cases with and without profanities in English Social Media corpus.
OAG CAG NAG Predicted label OAG CAG NAG True label
83 42 19
28 79 35
75 210 345
Confusion Matrix 0.0 0.1 0.2 0.3 0.4 0.5
(a) EN-FB task
OAG CAG NAG
Predicted label OAG
CAG
NAG
True label
244 74 43
150 131 132
26 105 352
Confusion Matrix 0.0 0.1 0.2 0.3 0.4 0.5 0.6 0.7
[image:6.595.94.509.64.255.2](b) EN-SM task
Figure 2: plots of confusion matrices of our best performing systems for English Facebook and Social Media data
OAG CAG NAG
Predicted label OAG
CAG
NAG
True label
199 155 8
69 313 31
25 54 116
Confusion Matrix 0.0 0.1 0.2 0.3 0.4 0.5 0.6 0.7
(a) HI-FB task
OAG CAG NAG
Predicted label OAG
CAG
NAG
True label
177 134 148
50 155 176
23 78 253
Confusion Matrix 0.0 0.1 0.2 0.3 0.4 0.5 0.6 0.7
(b) HI-SM task
Figure 3: Plots of confusion matrices of our best performing systems for Hindi Facebook and Social Media data
5 Conclusion
In this paper, we present our approaches to identify the aggression level in English and Hindi comments in two different datasets, one from Facebook and another from other social media. In our best performing systems, we use a combination of lexical and semantic features for English corpus, and lexical features for Hindi data.
[image:6.595.90.509.314.502.2]References
Thomas Davidson, Dana Warmsley, Michael Macy, and Ingmar Weber. 2017. Automated Hate Speech Detection and the Problem of Offensive Language. InProceedings of ICWSM.
Ritesh Kumar, Atul Kr. Ojha, Shervin Malmasi, and Marcos Zampieri. 2018a. Benchmarking Aggression Identifi-cation in Social Media. InProceedings of the First Workshop on Trolling, Aggression and Cyberbulling (TRAC), Santa Fe, USA.
Ritesh Kumar, Aishwarya N. Reganti, Akshit Bhatia, and Tushar Maheshwari. 2018b. Aggression-annotated Corpus of Hindi-English Code-mixed Data. InProceedings of the 11th Language Resources and Evaluation Conference (LREC), Miyazaki, Japan.
Quoc V. Le and Tomas Mikolov. 2014. Distributed representations of sentences and documents. In ICML, volume 14, pages 1188–1196.
Shervin Malmasi and Marcos Zampieri. 2018. Challenges in Discriminating Profanity from Hate Speech.Journal of Experimental & Theoretical Artificial Intelligence, 30:1–16.
Deepthi Mave, Suraj Maharjan, and Thamar Solorio. 2018. Language Identification and Analysis of Code-Switched Social Media Text. InProceedings of the Third Workshop on Computational Approaches to Linguistic Code-Switching, Melbourne, Australia, July. Association for Computational Linguistics.
Chikashi Nobata, Joel Tetreault, Achint Thomas, Yashar Mehdad, and Yi Chang. 2016. Abusive Language Detec-tion in Online User Content. InProceedings of the 25th International Conference on World Wide Web, pages 145–153. International World Wide Web Conferences Steering Committee.
James W. Pennebaker, Roger J. Booth, and Martha E. Francis. 2007. Liwc2007: Linguistic inquiry and word count. Austin, Texas: liwc.net.
Niloofar Safi Samghabadi, Suraj Maharjan, Alan Sprague, Raquel Diaz-Sprague, and Thamar Solorio. 2017. Detecting nastiness in social media. InProceedings of the First Workshop on Abusive Language Online, pages 63–72.
Maarten Sap, Gregory Park, Johannes Eichstaedt, Margaret Kern, David Stillwell, Michal Kosinski, Lyle Ungar, and Hansen Andrew Schwartz. 2014. Developing age and gender predictive lexica over social media. In Proceedings of the 2014 Conference on Empirical Methods in Natural Language Processing (EMNLP), pages 1146–1151.
Richard Socher, Alex Perelygin, Jean Wu, Jason Chuang, Christopher D Manning, Andrew Ng, and Christopher Potts. 2013. Recursive deep models for semantic compositionality over a sentiment treebank. InProceedings of the 2013 conference on empirical methods in natural language processing, pages 1631–1642.
Cynthia Van Hee, Els Lefever, Ben Verhoeven, Julie Mennes, Bart Desmet, Guy De Pauw, Walter Daelemans, and Veronique Hoste. 2015. Detection and fine-grained classification of cyberbullying events. InProceedings of the International Conference Recent Advances in Natural Language Processing, pages 672–680. INCOMA Ltd. Shoumen, Bulgaria.
Zeerak Waseem and Dirk Hovy. 2016. Hateful symbols or hateful people? predictive features for hate speech detection on twitter. InProceedings of the NAACL student research workshop, pages 88–93.
Zeerak Waseem. 2016. Are you a racist or am i seeing things? annotator influence on hate speech detection on twitter. InProceedings of the first workshop on NLP and computational social science, pages 138–142.