ECNU: Expression- and Message-level Sentiment Orientation
Classification in Twitter Using Multiple Effective Features
Jiang Zhao†, Man Lan∗, Tian Tian Zhu†
Department of Computer Science and Technology East China Normal University
†51121201042,[email protected]; ∗[email protected]
Abstract
Microblogging websites (such as Twitter, Facebook) are rich sources of data for opinion mining and sentiment analysis. In this paper, we describe our approaches used for sentiment analysis in twitter (task 9) organized in SemEval 2014. This task tries to determine whether the sentiment orientations conveyed by the whole tweets or pieces of tweets are positive, negative or neutral. To solve this problem, we ex-tracted several simple and basic features considering the following aspects: surface text, syntax, sentiment score and twitter characteristic. Then we exploited these features to build a classifier using SVM algorithm. Despite the simplicity of fea-tures, our systems rank above the average.
1 Introduction
Microblogging services such as Twitter1,
Face-book2 today play an important role in expressing
opinions on a variety of topics, discussing current issues or sharing one’s feelings about different ob-jects in our daily life (Agarwal and Sabharwal, 2012). Therefore, Twitter (and other platforms) has become a valuable source of users’ sentiments and opinions and with the continuous and rapid growth of the number of tweets, analyzing the sen-timents expressed in twitter has attracted more and more researchers and communities, for example, the sentiment analysis task in twitter was held in This work is licensed under a Creative Commons At-tribution 4.0 International Licence. Page numbers and pro-ceedings footer are added by the organisers. Licence details: http://creativecommons.org/licenses/by/4.0/
1http://twitter.com 2http://facebook.com/
SemEval 2013 (Nakov et al., 2013). It will bene-fit lots of real applications such as simultaneously businesses, media outlets, and help investors to discover product trends, identify customer pref-erences and categorize users by analyzing these tweets (Becker et al., 2013).
The task of sentiment analysis in twitter in Se-mEval 2014 (Sara et al., 2014) aims to classify whether a tweet’s sentiment is positive, negative or neutral at expression level or message level. The expression-level subtask (i.e., subtask A) is to de-termine the sentiment of a marked instance of a word or phrase in the context of a given message, while the message-level subtask (i.e., subtask B) aims to determine the sentiment of a whole mes-sage. Previous work (Nakov et al., 2013) showed that message-level sentiment classification is more difficult than that of expression-level (i.e., 0.690 vs 0.889 in terms ofF-measure) since a message may be composed of inconsistent sentiments.
To date, lots of approaches have been proposed for conventional blogging sentiment analysis and a very broad overview is presented in (Pang and Lee, 2008). Inspired by that, many features used in microblogging mining are adopted from tradi-tional blogging sentiment analysis task. For ex-ample, n-grams at the character or word level, part-of-speech tags, negations, sentiment lexicons were used in most of current work (Agarwal et al., 2011; Barbosa and Feng, 2010; Zhu et al., 2013; Mohammad et al., 2013; K¨okciyan et al., 2013). They found thatn-grams are still effective in spite of the short length nature of microblog-ging and the distributions of different POS tags in tweets with different polarities are highly dif-ferent (Pak and Paroubek, 2010). Compared with formal blog texts, tweets often contain many in-formal writings including slangs, emoticons,
ative spellings, abbreviations and special marks (i.e., mentions @ and hashtags #), and thus many twitter-specific features are proposed to character-ize this phenomena. For example, features record the number of emoticons, elongated words and hashtags were used in (Mohammad et al., 2013; Zhu et al., 2013; K¨okciyan et al., 2013). In this work, we adopted many features from previous work and then these features were fed to SVM to perform classification.
The remainder of this paper is organized as fol-lows. Section 2 describes our systems including preprocessing, feature representations, data sets, etc. Results of two subtasks and discussions are reported in Section 3. Finally, we conclude this paper in Section 4.
2 Our Systems
We extracted eight types of features and the first six types were used in subtask A and all features were used in subtask B. Then, several classifica-tion algorithms were examined on the develop-ment data set and the algorithm with the best per-formance was chosen in our final submitted sys-tems.
2.1 Preprocessing
In order to remedy as many informal texts as possible, we recovered the elongated words to their normal forms, e.g., “goooooood” to “good” and collected about five thousand slangs or ab-breviations from Internet to convert each slang to its complete form, e.g., “1dering” to “won-dering”, “2g2b4g” to “to good to be forgotten”. Then these preprocessed texts were used to extract non twitter-specific features (i.e., POS, lexicon, n-grams, word cluster and indicator feature).
2.2 Feature Representations 2.2.1 POS Features
(Pak and Paroubek, 2010) found that POS tags help to identify the sentiments of tweets and they pointed out that objective tweets often contain more nouns than subjective tweets and subjec-tive tweets may carry more adjecsubjec-tives and adverbs than objective tweets. Therefore, we used Stan-ford POS Tagger3 and recorded the number of
four different tags for each tweet: noun (the cor-responding POS tags are “NN”, “NNP”, “NNS” and “NNPS”), verb (the corresponding POS tags
3http://nlp.stanford.edu/software/tagger.shtml
are “VB”, “VBD”, “VBG”, “VBN”, “VBP” and “VBZ”), adjective (the corresponding POS tags are “JJ”, “JJR” and “JJS”) and adverb (the corre-sponding POS tags are “RB”, “RBR” and “RBS”). Then we normalized them by the length of given instance or message.
2.2.2 Sentiment Lexicon-based Features
Sentiment lexicons are widely used to calculate the sentiment scores of phrases or messages in pre-vious work (Nakov et al., 2013; Mohammad et al., 2013) and they are proved to be very helpful to detect the sentiment orientation. Given a phrase or message, we calculated the following six fea-ture values: (1) the ratio of positive words to all words, i.e., the number of positive words divided by the number of total words; (2) the ratio of neg-ative words to all words; (3) the ratio of objective words to all words; (4) the ratio of positive senti-ment score to the total score (i.e., the sum of the positive and negative score); (5) the ratio of nega-tive sentiment score to the total score; (6) the ratio of positive score to negative score, if the negative score is zero, which means this phrase or message has a very strong positive sentiment orientation, we set ten times of positive score as its value.
During the calculation, we also considered the effects of negation words since they may reverse the sentiment orientation in most cases. To do so, we defined the negation context as a snippet of a tweet that starts with a negation word and ends with punctuation marks. If a non-negation word is in a negation context and also in the sentiment lexicon, we reverse its polarity. For example, the word “bad” in phrase “not bad” originally has a negative score of 0.625, after reversal, this phrase has a positive score of 0.625. A manually made list containing 29 negation words (e.g.,no,hardly, never, etc) was used in our experiment.
Four sentiment lexicons were used to decide whether a word is subjective or objective and ob-tain its sentiment score.
SentiWordNet(SWN) (Baccianella et al., 2010). This sentiment lexicon contains about 117 thousand items and each item corresponds to a synset of WordNet. Three sentiment scores: positivity, negativity, objectivity are provided and the sum of these three scores is always 1, for example, living#a#3, positivity: 0.5, negativity: 0.125, objectivity: 0.375. In experiment we used the most common sense of a word.
NRC(Mohammad et al., 2013). Mohammad et al. collected two sets of tweets and each tweet con-tains the seed hashtags or emoticons and then they labeled the sentiment orientation for each tweet according to its hashtags or emoticons. They used pointwise mutual information (PMI) to calculate the sentiment score for each word and obtained two sentiment lexicons (i.e., hashtag lexicon and emoticon lexicon).
IMDB. We generated an unigram lexicon by ourselves from a large movie review data set from IMDB website (Maas et al., 2011) which con-tains 25,000 positive and 25,000 negative movie reviews by calculating their PMI scores.
2.2.3 Wordn-Gram
Words in themselves in tweets usually carry out the original sentiment orientation, so we con-sider word n-grams as one feature. We removed URLs, mentions, hashtags, stopwords from tweet and then all words were stemmed using the nltk4
toolkit. For subtask A, only unigram was used and we used word frequency as feature values. For subtask B, both unigram and bigram were used. Besides, weighted unigram was also used where we replaced word frequency with their sentiment scores using the hashtag lexicon and emoticon lex-icon in NRC.
2.2.4 Twitter-specific Features
PunctuationGenerally, punctuation may express users’ sentiment in a certain extent. Therefore we recorded the frequency of the following four types of punctuation: exclamation (!), question (?), dou-ble (”) and single marks (’). In addition, we also recorded the number of contiguous sequences of exclamation marks, question marks, and both of them which appeared at the end of a phrase or mes-sage.
Emoticon Emoticons are widely used to directly express the sentiment of users and thus we counted
4http://nltk.org/
the number of positive emoticons, negative cons and the sum of positive and negative emoti-cons. To identify the polarities of emoticons, we collected 36 positive emoticons and 33 negative emoticons from the Internet.
Hashtag A hashtag is a short phrase that con-catenates more than one words together without white spaces and users usually use hashtags to label the subject topic of a tweet, e.g., #toobad, #ihateschool, #NewGlee. Since a hashtag may contain a strong sentiment orientation, we first used the Viterbi algorithm (Berardi et al., 2011) to split hashtags and then calculated the sentiment scores of hashtags using the hashtag and emoticon lexicon in NRC.
2.2.5 Word Cluster
Apart from n-gram, we presented another word representations based on word clusters to explore shallow semantic meanings and reduced the spar-sity of the word space. 1000 word clusters pro-vided by CMU pos-tagging tool5were used to
rep-resent tweet contents. For each tweet we recorded the number of words from each cluster, resulting in 1000 features.
2.2.6 Indicator Features
We observed that the polarity of a message some-times is revealed by some special individual posi-tive or negaposi-tive words in a certain degree. How-ever the sentiment lexicon based features where a synthetical sentiment score of a message is cal-culated may hide this information. Therefore, we directly used several individual sentiment scores as features. Specifically, we created the following sixteen features for each message where the hash-tag and emoticon lexicons were used to obtain sen-timent scores: the sensen-timent scores of the first and last sentiment-bearing words, the three highest and lowest sentiment scores.
2.3 Data sets and Evaluation Metric
The organizers provide tweet ids and a script for all participants to collect data. Table 1 shows the statistics of the data set used in our experiments. To examine the generalization of models trained on tweets, the test data provided by the organiz-ers consists of instances from different domains for both subtasks. Specifically, five corpora are in-cluded: LiveJournal(2014) is a collection of com-ments from LiveJournal blogs, SMS2013 is a SMS
data set directly from last year, Twitter2013 is a twitter data set directly from last year, Twitter2014 is a new twitter data set and Twitter2014Sarcasm is a collection of tweets that contain sarcasm. No-tice that the data set SMS2013 and Twitter2013 were also used as our development set. Form Ta-ble 1, we find that (1) the class distributions of test data sets almost agree with training data sets for both subtasks, (2) the percentages of classneutral in two subtasks are significantly different (4.7% vs 45.5%), which reflects that a sentence which is composed of different sentiment expressions may act neutrality, (3) Twitter2014Sarcasm data set is very small. According to the guideline, we did not use any development data for training in the eval-uation period.
data set Positive Negative Neutral Total
subtask A:
train 3,609(61%) 2,023(34%) 265(5%) 5,897
dev 2,734(62%) 1,541(35%) 160(3%) 4,435
test
LiveJournal 660(50%) 511(39%) 144(11%) 1,315
SMS2013 1,071(46%) 1,104(47%) 159( 7%) 2,334
Twitter2013 2,734(62%) 1,541(35%) 160(3%) 4,435
Twitter2014 1,807(73%) 578(23%) 88( 4%) 2,473
Twitter2014S 82(66%) 37(30%) 5(4%) 124
all 6,354(59%) 3,771(35%) 556(6%) 10,681
subtask B:
train 3,069(36%) 1,313(15%) 4,089(49%) 8,471
dev 1,572(41%) 601(16%) 1,640(43%) 3,813
test
LiveJournal 427(37%) 304(27%) 411(36%) 1,142
SMS2013 492(24%) 394(19%) 1,207(57%) 2,093
Twitter2013 1,572(41%) 601(16%) 1,640(43%) 3,813
Twitter2014 982(53%) 202(11%) 669(36%) 1,853
Twitter2014S 33(38%) 40(47%) 13(15%) 86
all 3,506(39%) 1,541(17%) 3,940(44%) 8,987
Table 1: Statistics of data sets in training (train), development (dev), test (test) set. Twitter2014S stands for Twitter2014Sarcasm.
We used macro-averaged F-measure of positive and negative classes (without neutral since it is margin in training data) to evaluate the perfor-mance of our systems and the averaged F-measure of five corpora was used to rank the final results.
2.4 Submitted System Configurations
For each subtask, each team can submit two runs: (1)constrained: only the provided data set can be used for training and no additional annotated data is allowed for training, however other resources such as lexicons are allowed; (2) unconstrained: any additional data can be used for training. We explored several classification algorithms on the development set and configured our final systems as follows. For constrained system, we used SVM and logistic regression algorithm implemented in scikit-learn toolkit (Pedregosa et al., 2011) to
ad-dress two subtasks respectively and used self-training strategy to conduct unconstrained system. Self-training is a semi-supervised learning method where a classifier is first trained with a small amount of labeled data and then we repeat the fol-lowing procedure: the most confident predictions by the current classifier are added to training pool and then the classifier is retrained(Zhu, 2005). The parameters in constrained models and the growth sizekand iteration number T in self-training are listed in Table 2 according to the results of prelim-inary experiments.
task constrained unconstrained
subtask A SVM, kernel=rbf, c=500 k=100,T=40 subtask B LogisticRegression, c=1 k=90,T=40 Table 2: System configurations for the constrained and unconstrained runs in two subtasks.
3 Results and Discussion
3.1 Results
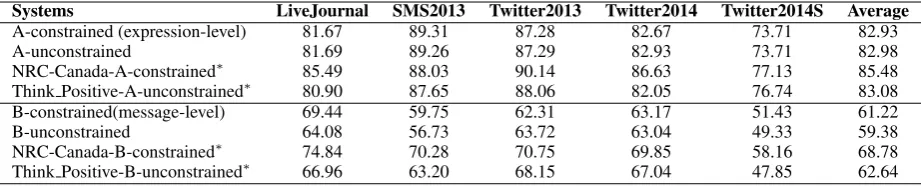
We submitted four systems as described above and their final results are shown in Table 3, as well as the top-ranked systems released by the organizers. From the table, we observe the following findings. Firstly, we find that the results of message-level polarity classification are much worse than the re-sults of expression-level polarity disambiguation (82.93 vs 61.22) on both constrained and uncon-strained systems, which is consistent with the pre-vious work (Nakov et al., 2013). The low per-formance of message-level task may result from two possible reasons: (1) a message may con-tain mixed sentiments and (2) the strength of sentiments is different. In contrast, the texts in expression-level task are usually short and contain a single sentiment orientation, which leads to bet-ter performance.
Secondly, whether on constrained or uncon-strained systems, the performance on Twit-ter2014Sarcasm data set is much worse than the performance on the other four data sets. This is because that sarcasm often expresses the opposite meaning of what it seems to say, that means the actual sentiment orientation of a word is opposite to its original orientation. Moreover, even for our human it is a challenge to identify whether it is a sarcasm or not.
online comments and SMS share some common characteristics with tweets (e.g., emoticons and punctuation). Therefore, in case of lack of labeled online comments or SMS data, we can use the ex-isting tweets as training data instead.
Fourthly, our unconstrained systems exploit the test data of year 2014 in training stage and perform a worse result in subtask B. We speculate that the failure of using self-training on message-level data set is because that the performance of initial clas-sifier was low and thus in the following iterations more and more noisy instances were selected to add the training pool, which eventually resulted in a final weak classifier.
In summary, we adopted some simple and ba-sic features to classify the polarities of expressions and messages and they were promising. For sub-task A, our systems rank 5th out of 19 submissions under the constrained setting and rank 2nd out of 6 submissions under the unconstrained setting. For subtask B, our systems rank 16th out of 42 submis-sions under the constrained setting and rank 5th out of 8 submissions under the unconstrained set-ting.
3.2 Feature Combination Experiments
To explore the effectiveness of different feature types, we conducted a series of feature combina-tion experiments using the constrained setting as shown in Table 2 for both subtasks. For each time we repeated to add one feature type to current fea-ture set and then selected the best one until all the feature types were processed. Table 4 shows the results of different feature combinations and the best results are shown in bold font.
From Table 4, we find that (1) MPQA,n-gram and Word cluster are the most effective feature types to identify the polarities; (2) The POS tags make margin contribution to improve the permance since Stanford parser is designed for for-mal texts and in the future we may use specific parser instead; (3) The lexicon IMDB extracted from movie reviews has negative effects to clas-sify twitter data, which indicates that there exist differences in the way of expressing sentiments between these two domains; (4) Twitter-specific features, i.e., hashtag and emoticon, are not as ef-fective as expected. This is because they are sparse in the data sets. In subtask A with 16578 instances, only 292 instances (1.76%) have hashtags and 419 instances (2.52%) have emoticons. In subtask B
with 17458 messages, more instances have hash-tags (16.72%) and emoticons (26.70%). (5) For subtask A MPQA,n-gram, NRC and punctuation features achieve the best performance and for sub-task B the best performance is achieved by using almost all features.
In summary, we find thatn-gram and some lex-icons such as MPQA are the most effective while twitter-specific features (i.e., hashtag and emoti-con) are not as discriminating as expected and the main reason for this is that they are sparse in the data sets.
Feature Subtask A Feature Subtask B
MPQA 77.49 Word cluster 53.50 .+n-gram 80.08(2.59) .+MPQA 58.35(4.85) .+NRC 82.42(2.34) .+W1Gram 60.22(1.87) .+Pun. 83.83(1.41) .+Pun. 60.99(0.77) .+POS 83.83(0) .+Indicator 61.38(0.39) .+Emoticon 83.49(-0.34) .+SWN 61.51(0.13) .+Hashtag 83.54(0.05) .+Hashtag 61.54(0.03) .+IMDB 83.51(-0.03) .+n-gram 61.56(0.02) .+SWN 82.92(-0.59) .+Emoticon 61.69(0.13)
- - .+POS 61.71(0.02)
- - .+IMDB 61.11(-0.6)
- - .+NRC 61.23(0.12)
Table 4: The results of feature combination eximents. The numbers in the brackets are the per-formance increments compared with the previous results. “.+” means to add current feature to the previous feature set.
4 Conclusion
In this paper we used several basic feature types to identify the sentiment polarity at expression level or message level and these feature types include n-gram, sentiment lexicon and twitter-specific fea-tures, etc. Although they are simple, our systems are still promising and rank above average (e.g., rank 5th out of 19 and 16th out of 42 in subtask A and B respectively under the constrained setting). For the future work, we would like to analyze the distributions of different sentiments in sentences. Acknowledgments
This research is supported by grants from Na-tional Natural Science Foundation of China (No.60903093) and Shanghai Knowledge Service Platform Project (No. ZF1213).
References
Pro-Systems LiveJournal SMS2013 Twitter2013 Twitter2014 Twitter2014S Average
A-constrained (expression-level) 81.67 89.31 87.28 82.67 73.71 82.93
A-unconstrained 81.69 89.26 87.29 82.93 73.71 82.98
NRC-Canada-A-constrained∗ 85.49 88.03 90.14 86.63 77.13 85.48
Think Positive-A-unconstrained∗ 80.90 87.65 88.06 82.05 76.74 83.08
B-constrained(message-level) 69.44 59.75 62.31 63.17 51.43 61.22
B-unconstrained 64.08 56.73 63.72 63.04 49.33 59.38
NRC-Canada-B-constrained∗ 74.84 70.28 70.75 69.85 58.16 68.78
[image:6.595.72.533.62.155.2]Think Positive-B-unconstrained∗ 66.96 63.20 68.15 67.04 47.85 62.64
Table 3: Performance of our systems and the top-ranked systems (marked with asterisk).
ceedings of the Workshop on Information Extraction and Entity Analytics on Social Media Data, pages 39–44, Mumbai, India, December. The COLING 2012 Organizing Committee.
Apoorv Agarwal, Boyi Xie, Ilia Vovsha, Owen Ram-bow, and Rebecca Passonneau. 2011. Sentiment analysis of twitter data. InProceedings of the Work-shop on Languages in Social Media, LSM ’11, pages 30–38. Association for Computational Linguistics. Stefano Baccianella, Andrea Esuli, and Fabrizio
Sebas-tiani. 2010. Sentiwordnet 3.0: An enhanced lexical resource for sentiment analysis and opinion mining. InLREC, volume 10, pages 2200–2204.
Luciano Barbosa and Junlan Feng. 2010. Robust sen-timent detection on twitter from biased and noisy data. In Proceedings of the 23rd International Conference on Computational Linguistics: Posters, pages 36–44. Association for Computational Lin-guistics.
Lee Becker, George Erhart, David Skiba, and Valen-tine Matula. 2013. Avaya: Sentiment analysis on twitter with self-training and polarity lexicon expan-sion. In Proceedings of the Seventh International Workshop on Semantic Evaluation (SemEval 2013), pages 333–340. Association for Computational Lin-guistics, June.
Giacomo Berardi, Andrea Esuli, Diego Marcheggiani, and Fabrizio Sebastiani. 2011. Isti@ trec microblog track 2011: Exploring the use of hashtag segmenta-tion and text quality ranking. InTREC.
Nadin K¨okciyan, Arda C¸elebi, Arzucan ¨Ozg¨ur, and Suzan ¨Usk¨udarli. 2013. Bounce: Sentiment classifi-cation in twitter using rich feature sets. In Proceed-ings of the Seventh International Workshop on Se-mantic Evaluation (SemEval 2013), pages 554–561. Association for Computational Linguistics, June. Andrew L Maas, Raymond E Daly, Peter T Pham, Dan
Huang, Andrew Y Ng, and Christopher Potts. 2011. Learning word vectors for sentiment analysis. In
Proceedings of the 49th Annual Meeting of the Asso-ciation for Computational Linguistics: Human Lan-guage Technologies-Volume 1, pages 142–150. As-sociation for Computational Linguistics.
Saif Mohammad, Svetlana Kiritchenko, and Xiaodan Zhu. 2013. Nrc-canada: Building the state-of-the-art in sentiment analysis of tweets. InProceedings
of the Seventh International Workshop on Semantic Evaluation (SemEval 2013), pages 321–327. Asso-ciation for Computational Linguistics, June. Preslav Nakov, Sara Rosenthal, Zornitsa Kozareva,
Veselin Stoyanov, Alan Ritter, and Theresa Wilson. 2013. Semeval-2013 task 2: Sentiment analysis in twitter. InProceedings of the Seventh International Workshop on Semantic Evaluation (SemEval 2013), pages 312–320. Association for Computational Lin-guistics, June.
Alexander Pak and Patrick Paroubek. 2010. Twitter as a corpus for sentiment analysis and opinion mining. In Proceedings of the International Conference on Language Resources and Evaluation, LREC. Bo Pang and Lillian Lee. 2008. Opinion mining and
sentiment analysis. Foundations and trends in infor-mation retrieval, 2(1-2):1–135.
Fabian Pedregosa, Ga¨el. Varoquaux, Alexandre Gram-fort, Vincent Michel, Bertrand Thirion, Olivier Grisel, Mathieu Blondel, Peter Prettenhofer, Ron Weiss, Vincent Dubourg, Jake Vanderplas, Alexan-dre Passos, David Cournapeau, Matthieu Brucher, Matthieu Perrot, and ´Edouard Duchesnay. 2011. Scikit-learn: Machine learning in Python. Journal of Machine Learning Research, 12:2825–2830. Rosenthal Sara, Ritter Alan, Veselin Stoyanov, and
Nakov Preslav. 2014. Semeval-2014 task 9: Sen-timent analysis in twitter. In Proceedings of the Eighth International Workshop on Semantic Evalu-ation (SemEval’14). Association for Computational Linguistics, August.
Theresa Wilson, Janyce Wiebe, and Paul Hoffmann. 2009. Recognizing contextual polarity: An explo-ration of features for phrase-level sentiment analy-sis.Computational linguistics, pages 399–433. Tian Tian Zhu, Fang Xi Zhang, and Man Lan. 2013.
Ecnucs: A surface information based system de-scription of sentiment analysis in twitter in the semeval-2013 (task 2). InProceedings of the Sev-enth International Workshop on Semantic Evalua-tion (SemEval 2013), page 408.