1
Simulation of failure of air plasma sprayed thermal barrier coating due to interfacial and bulk cracks by using surface based cohesive interaction and extended finite element
method
S.T. Kyaw*, I.A.Jones, T.H.Hyde
Faculty of Engineering, The University of Nottingham University Park, Nottingham, NG7 2RD, UK
*Corresponding author email: [email protected]
Address: C03, ITRC building, University Park, University of Nottingham, NG7 2RD Phone: +44-1159513811
Abstract
The present paper describes a method of predicting the failure of a thermal barrier coating system due to interfacial cracks and cracks within bulk coatings. The interfacial crack is modelled by applying cohesive interfaces where the thermally grown oxide is bonded to the ceramic thermal barrier coating. Initiation and propagation of arbitrary cracks within coatings are modelled using the extended finite element method. Two sets of parametric studies were carried out, concentrating on the effect of thickness of the oxide layer and that of initial cracks within the ceramic coating on the growth of coating cracks and the subsequent failures. These studies have shown that a thicker oxide layer creates higher tensile residual stresses during cooling from high temperature, leading to longer coating cracks. Initial cracks parallel to the oxide interface accelerate coating spallation and simulation of this process is presented in this paper. By contrast, segmented cracks prevent growth of parallel cracks which can lead to spallation.
Keywords: TBC, cohesive interaction, XFEM, crack growth, spallation
Nomenclature
NI(x) Conventional shape function, taking the value 1 at node I and 0 at all other nodes a Half diagonal length of the impression
I
2 α
I
b
Enriched degree of freedom for XFEM c Half of the crack lengthD Damage parameter for the traction-separation model E Young’s modulus
f Crack nucleation factor
xFα Crack tip asymptotic function for XFEM enrichment
GC Critical strain energy release rate (also GIC, GIIC)
Geq Equivalent critical strain energy release rate mixed-mode failure GI Strain energy release rate for Mode I failure (also GII and GIII)
C
I
K Fracture toughness of Mode I failure m Loading stiffness
P maximum indentation load
T Traction stress at which damage initiation occurs
I
u
Degree of freedom for node I β phase angle for mixed mode failureδ
Crack opening/separation at which damage initiation occurs δz Critical crack opening at D = 1δeff Effective critical crack opening for mixed mode failure δn Critical crack opening for Mode I failure
δslip Critical crack opening for Mode II failure Material constant in equation for calculating C
3
1 Introduction
A thermal barrier coating (TBC) system is usually made up of three layers: ceramic TBC, bond coat (BC) and thermally grown oxide (TGO) and the substrate. An air plasma sprayed (APS) TBC system will be considered here and this manufacturing method is commonly used for spraying TBCs onto components of land based engines. Unlike the electron beam physical vapour deposition (EBPVD) method, which is used in the aerospace industry, the APS method does not require the use of a vacuum during manufacturing, bringing down the investment cost for coating equipments. Nevertheless, it requires multiple passes of spraying to achieve the required coating thickness.
The growth of parallel cracks within the coating and interfacial delamination cracks can lead to failure of coating systems. The initiation of these cracks can be predicted based on simulated stress distributions within the system. While this type of prediction is reasonable for failure analysis, it does not take into account stress relaxation as a result of the growth of cracks. Here, the failure of air plasma spray (APS) TBC systems for gas turbines will be explored by implementing models for the crack growth mechanisms both at the coating interfaces and within the bulk coatings.
Stresses which are concentrated around the TGO interfaces at the end of a thermal cycle have been assumed to be the major cause of spallation of the TBC. Tensile stresses originate from the mismatch of strains between layers of the TBC system during the start up or the shutdown of engines. When these stresses exceed the fracture strengths of the TBC layers or the TGO interfaces, they create cracks within the bulk layers and weaken the TGO interfaces by creating delamination cracks. The fracture toughness of the TGO interfaces and of the TBC layers determine the propagation of those cracks and of the overall failure mechanism (ductile or brittle) of TBC system.
Failures of TBC systems based on cracks created within the TBC and the TGO layers have been investigated experimentally by various researchers [1, 2]. Naumenko et al. [2] observed that failure of the APS TBC system mainly occurs within the TBC layer near the TGO/TBC interface because a significant amount of TBC remains attached to the substrate after failure, compared to EBPVD coating systems.
4 is required, and it is therefore computationally expensive especially for 3D models. Arbitrary crack propagation has been modelled for EBPVD systems in [7, 8] but the study does not implement cohesive interface for possible growth of interfacial cracks and delamination.
In this paper, the extended FE method (XFEM) is applied to the simulation of arbitrary crack propagation within the TBC and the TGO while a cohesive interaction is applied at the TGO/TBC interface to investigate the degradation of interface bonding. Furthermore, initial cracks and discontinuities within the TBC are also implemented in the model and their influences on TBC spallation are studied. Initial cracks could sometimes be deliberately introduced to the system using proprietary spraying processes such as the solution-precursor plasma sprayed process (SPPS) as explained in [9] for better strain tolerance.
2 Geometry and boundary conditions
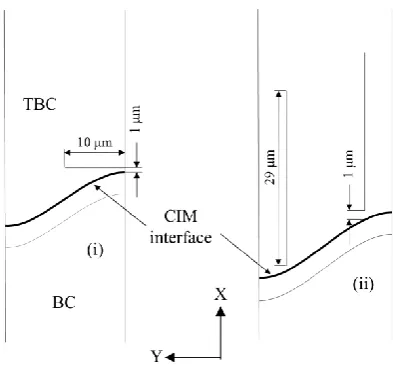
5 The TBC system is assumed to be defect-free during the pre-processing stage for the first part of analysis. Initial TBC cracks were implemented in the second part of the analysis in order to understand their influences on spallation. Two types of APS TBC cracks were considered for implementation at the pre-processing stage: cracks which originate from the intersplat boundaries, which are parallel to the TGO interface (parallel cracks), and cracks that are perpendicular to the interface (segmented cracks) as shown in Fig. 2 (i) and (ii) respectively. The formation of cracks is driven by maximum principal stresses of the TBC systems under thermal cyclic load.
Various researchers [14-16] have explored the relationship between the failure of the TBC system and the thickness of the TGO layer. To observe the relationship between crack growth and TGO thickness, parametric studies were carried out with different TGO thicknesses varied from 1 to 4µm while keeping the aspect ratio the same as for the sinusoidal TGO interface for the initially crack-free model. The TGO thickness, for the model with initial defects, is set to 4μm, which is assumed as the critical TGO thickness for the spallation, to simulate the final spallation of the TBC. The TBC system is considered to be stress-free at the end of the steady state due to the stress relaxation within the BC in accordance with the assumptions made by Rösler [17].
XFEM enrichment was applied to the TGO and the TBC layers based on the principal stress criterion. The adhesion between the TGO and the TBC layer and subsequent degradation of the interface from interfacial crack opening is modelled by using the cohesive interaction method [12] (CIM). The CIM is only applied to the TGO/TBC interface since it has been shown experimentally [2] that spallation of the TBC in the vicinity of the TGO is most common for APS TBCs.
3 Crack growth modelling using XFEM
6
tip tip H N I N N I α I 1 α α I I N I I h b x F a sgn(x) u (x) N x u (1)where NI(x) is a conventional shape function used in elements, regardless of whether XFEM enrichment is used.
u
I represents the degrees of freedom (dof) of nodes for the FE calculations within ordinary isoparametric elements, whilea
I and bαI are enriched dof for the implementation of discontinuities within the elements. sgn(x) is a Heaviside distribution. NH are nodes belonging to the elements cut by a crack. Ntip are nodes belonging to the element within which a crack tip lies. Fα
x is a crack tip asymptotic function. More details for the XFEM can be found in [20].For propagating cracks, the traction-separation model (explained in Section 4) is applied using phantom nodes. Phantom nodes are superimposed onto the nodes of the elements through which the crack has passed. These phantom nodes at opposite sides of the crack will be separated causing opening of the crack face as the loading is applied. The magnitude of the separation of the crack surface before the complete failure is governed by the fracture toughness of the material. For propagating cracks, the crack tip asymptotic singularity is not considered. This means that a crack only initiates when all nodal values (stress or strain) for the element are higher than user-defined critical values, and the crack tip always lies at the element boundary.
In terms of engineering applications, XFEM can be used to predict arbitrary solution-dependent crack initiation and propagation within structures under loading. It can be used in parallel with cohesive failure models. Here, it is used to model crack propagation within the TBC and TGO in conjunction with the CIM model for the propagation of a delaminating crack at the TGO/TBC interface.
4 Traction-separation damage model
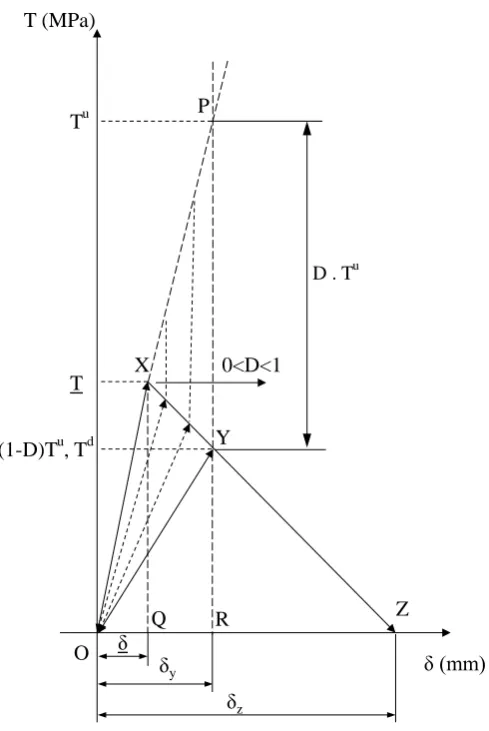
7 between the crack surfaces reduce while the cohesive interface or the crack plane is separating during degradation. If unloading is applied at point Y (refer to Fig. 3), the cohesive stiffness is reduced to (1-D)×k for the next loading step. D is the damage parameter and it can be derived as follows.
D is zero during the elastic loading region (OX) and if the unloading occurs at this region both traction and crack separation should go back to zero. Damage initiates at point X where D is 0 and final failure point is Z where D is 1. To illustrate this, the damage parameter is derived for unloading at point Y as shown in Fig. 4. The loading stiffness (m) after
unloading at point Y will be
y u δ T D 1 m (2)However,
y u δ
T is the stiffness of the undamaged crack (k). Hence m can be
expressed in terms of k. Tu is the stress when there is no cohesive damage whereas Td is the actual traction stress with cohesive damage.
The damage parameter D can be related to the crack separation distances. The slope m is written again as
OR YR
m (3)
Since ZQX and ZRY form a pair of similar triangles, YR can be written as
z y z u T ZQ ZR QX YR (4)Substituting Eq (2) & (4) into (3),
y u δ T D 1 y z y z u T (5)By simplying Eq (5), the damage parameter can be related to crack opening displacement as
δ δ
δ δ δ δ D z y y z (6)8 Critical crack opening (δz) depends on the fracture stress (T) and fracture toughness (
C I
K ) and relationship for Mode I failure is shown in Eq (7).
T E K 2 δ 2 C Iz (7)
5 Traction-separation damage model for mixed mode loading
If a shear mode of failure is taken into account, the effective critical separation (δeff) can be expressed using normal crack opening (δn) and tangential crack opening (δslip) as shown in Eq (8). This effective separation can be used to define failure criterion as an alternative stress based criteria as follows. For mixed mode failure, a quadratic stress or strain criterion can be used for damage initiation in traction-separation model [12] and the former is used here to derive mixed mode failure parameters. The crack nucleates when the parameter (f) as shown in Eq (9) becomes unity.
2 slip 2 n
eff δ δ
δ (8)
2 c 2 c τ τ σ σ f (9)
where σ and τ are nodal direct and shear stresses and
cand
care critical direct and shear stresses. The Macaulay bracket means only tensile direct stress is considered for crack initiation. Ifσ τ
tanβ , then the effective traction stress for damage initiation can be described as in Eq (10), where β is the phase angle for mixed mode failure.
0.5 2 2 C 2 C 2
C sin β
τ σ β cos σ T (10)
For mixed mode damage evolution, the critical energy GC is the equivalent critical strain energy release rate (Geq). This can be calculated in various ways [12]; a B-K (Benzeggagh and
Kenane) law for Geq is shown in Eq (11) as an example.
n9 where GIC and GIIC are critical strain energy release rates of direct and shear modes of failure respectively and GI, GII and GIII are energy release rate for a direct and two shear modes of failure respectively. n is a constant power, which is usually determined empirically.
Currently, it is assumed that the initiation and evolution of damage are independent of failure mode, due to lack of experimental data. Once experimental data for the shear strengths and mode dependent energy release rates of the coatings are available in future, they can be implemented in the mixed-mode failure model as shown by the framework above.
6 Material properties
6.1Elastic and thermal properties
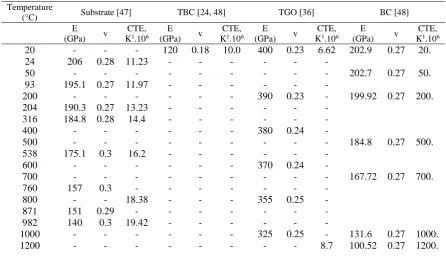
To model time dependent material properties of a complex TBC system, a user defined material subroutine (UMAT) is required [22]. Due to current limitations of the XFEM code implemented within Abaqus [12], it is not possible to couple UMAT with XFEM code. A more complicated user defined element (UEL) is required for this purpose. As a first attempt, the coating layers are currently considered to be elastic during the cooling stage and the system is also assumed to be stress-free at the beginning of the cooling stage. Elastic and thermal properties for the substrate, the TGO and the coating layers are given in Table 1. The system used for the study is an APS TBC system. It includes IN-738LC superalloy substrate, yttria stabilised zirconia (YSZ) ceramic coating, beta (NiAl) - gamma (Ni) BC and alumina (Al2O3) TGO. Please note that elastic and CTE of TBC are measured at room temperature. However studies[23-27] have shown that sintering at high temperature could modify the elastic modulus significantly and hence either empirical sintering model [22] or physical models [28] should be considered for further studies.
10
6.2Tensile strengths of coatings
To apply the traction-separation law, the maximum stress and cohesive interface stiffness for damage initiation and the critical strain energy release rate for damage evolution and failure have to be defined. Tensile strength was taken as the maximum stress for damage initiation by assuming that both the TGO and TBC are brittle with no yielding at the point of failure. Tensile strength of the TGO is 260MPa as reported by Munro [36]. The strength does not vary significantly for the temperature range between 20°C and 1000°C although it falls linearly to 10MPa between 1000°C and 1400°C [36]. It is assumed that TGO formed within the TBC system is comparable to bulk alumina (mass fraction of Al2O3 ≥ 0.995 and a nominal grain size of 5μm) used for experimental testing in [36].The fracture stress of the YSZ TBC is largely dependent on its yttria content as demonstrated in [37]. It was observed that at a high concentration of yttria, the tensile strength is almost equal to the flexural strength. Since no reliable temperature dependent tensile strengths are available, the temperature dependent flexural strengths of YSZ with 6.5 mol% of yttria in [38] are taken as the fracture strength of the TBC. The strength of the sintered YSZ varies from 150 MPa to 50MPa between 20°C to 1000°C. Please note that the specimens used for the experiments in [36, 38] are made up of bulk coating materials whose dimensions are much larger than actual coating layers. The tensile strength of coatings could be size-dependent and it should be investigated further.
6.3Interfacial tensile strength
11 bond strengths from pull tests such as the one in [39] are much lower than maximum out-of-plane tensile stresses (normal to the coating interface) simulated using FE models.
An alternative method for bond strength, which is based on experimental spallation tests and the FE method, is proposed as follows. It is assumed that the coating delaminates when the mismatch stress, due to cooling, exceeds the critical stress as explained in [26]. Experimentally, the critical thermal load for delamination can be obtained by applying different thermal cycles to the TBC system. According to data from spallation tests [42], delamination occurs after cooling down from heating at 1000°C for 1050h. When the same thermal cycle was applied to the FE model of the TBC system [22], the maximum tensile out-of-plane stress at the TGO/TBC interface is found to be 196.5MPa at the end of cooling. This stress is taken as the delamination strength of the interface.
6.4Interfacial cohesive stiffness
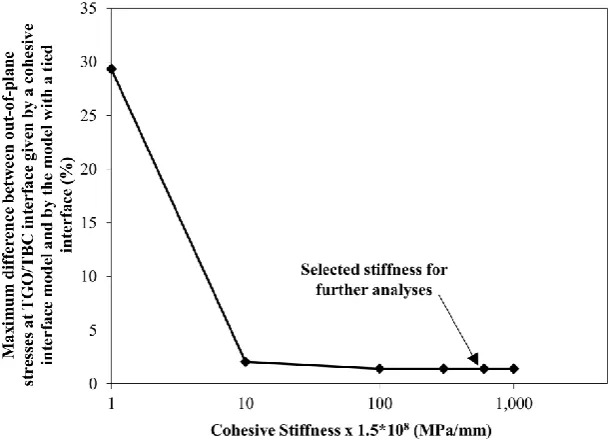
Unlike physical properties (e.g. the tensile strength or toughness of materials), the cohesive stiffness for traction-separation model is an assumed property without a direct physical interpretation. Some researchers investigating adhesive joints [43] have suggested the use of a stiffness value which is equal to the ratio of the modulus of the adhesive to its thickness. However, the physical thickness of the adhesive has no relevance to the case of a cohesive bond as in the model applied here. Therefore, a sensitivity study was carried out to obtain a useful interface cohesive stiffness. This is chosen to give values of out-of-plane stress at the cohesive interface, within the linear elastic region, close to the stress values predicted from the model with completely tied interfaces. The value of traction stress for damage initiation at the TGO/TBC interface is assumed to be 3 GPa to ensure the mismatch stresses will not initiate delamination cracks and affect the stress distribution. Cohesive stiffnesses ranging from 1.5×10⁸ to 1.5×10¹¹ MPa/mm were applied at the TGO/TBC interface within the sensitivity study.
12
6.5Critical strain energies and fracture toughness
The critical strain energy release rate can be related to the bulk/interfacial fracture toughness ( C
I
K ) and modulus (E) as GC C E
2
I K
for plane strain Mode I failure. The fracture toughness values for a TGO film (thickness = 0.38µm) and bulk TBC (thickness = 1mm) were measured by Stollberg, et al. [44] using the nanoindentation method. The relationship between nanoindentation test data and fracture toughness value can be shown by Eq (12). The corresponding values are 2.22±0.31 and 1.3±0.29 MPa m. Yamazaki et al. [45] investigated the TGO/TBC interface toughness and estimated it to be around 3.5 MPa m. In the absence of the physical elastic modulus for the TGO/TBC interface, the apparent modulus of the interface acquired from the load-depth indentation curve according to ISO 14577 is used by Yamazaki et al. [45]. The modulus is obtained by equating fracture toughness measured by the nanoindentation technique to the value measured from a 4 point bend test [45]:
E P c a
C
3
I
K (12)
where is a constant, E is the elastic modulus or apparent elastic modulus for interfacial toughness, a is half diagonal length of the impression, P is maximum indentation load and c is half of the crack length.
7 Results and discussion
7.1Parametric study of the influence of TGO thickness on crack growth within bulk coatings
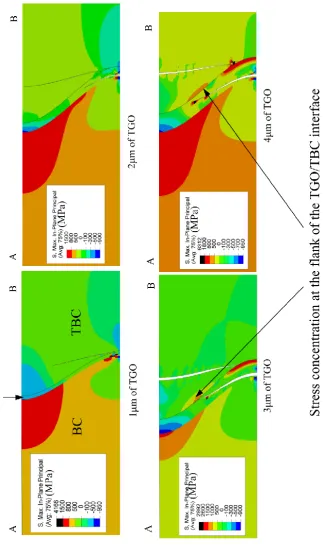
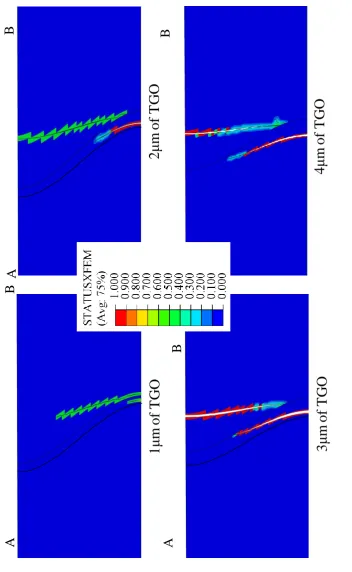
13 completely through the periodicity plane AB of the model when the TGO is thicker than 2μm. Therefore, coalescence of cracks within the TBC and the spallation of the TBC are expected when the TGO becomes thicker due to oxidation of the system at high temperature.
As shown in Fig. 7, there are multiple regions with stresses which are higher than the tensile strength of the coatings, and these stresses can cause initiation of further cracks. However, in this case, new cracks are not generated due to the limitations in the XFEM enrichment within Abaqus [12]. Formation of new cracks is not allowed in the vicinity of the existing crack until the complete separation of the existing crack face occurs. This could be because formation of multiple cracks within an element is not currently supported by Abaqus. In other words, XFEM is not suitable for modelling failure caused by multiple cracks which nucleate simultaneously. As seen from the damage parameter contours for XFEM cracks shown in Fig. 8, the existing cracks have some regions with damage parameters less than 1. This prevents the initiation of new cracks near the regions of the existing cracks.
7.2Parametric study of influence of TGO thickness on crack growth at the TGO/TBC interface
The damage status of a delamination crack at the interface can be studied by monitoring the contact opening variable within Abaqus. For mixed-mode failure, the effective opening (δeff) can be calculated from direct (COPEN, δn) and shear crack opening (CSLIP, δslip) variables as shown in Eq (8). The crack opens when δn or δslip is higher than δ and the complete failure occurs when δeff reaches the critical separation (δz) as shown in
Fig. 3. For this case, (δ) and δz are 1.31x10-09 mm and 1.597x10⁻³ mm respectively. δn and effective separations along the TGO/TBC interfaces are plotted for systems with different TGO thicknesses as shown in Fig. 9 & Fig. 10 respectively. Generally, tangential separations are around half an order to an order of magnitude higher than normal separations (Fig. 9 & Fig. 10). None of the models show a completely delaminated interface while contact separations in both directions are higher for thicker TGOs. However, the separations for the model with 4μm TGO are lower compared to the values from the system with 3μm TGO because of higher stress relaxation at the interface for 4μm TGO model from the formation of multiple cracks (Fig. 8).
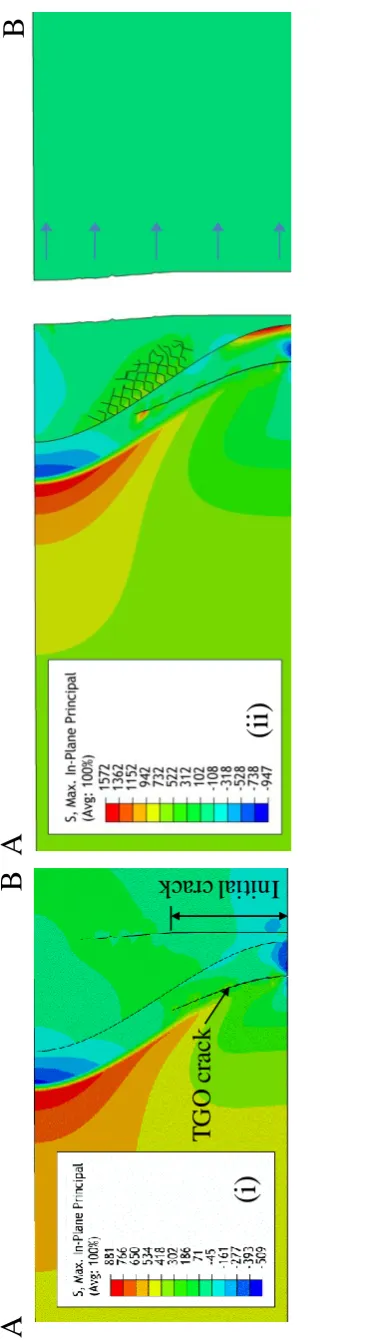
7.3Influence of initial parallel TBC cracks on crack growth within the TBC system
14 TGO/TBC interface [Fig. 11 (i)] and this makes the initial TBC crack grow towards the valley. Once the TBC crack reaches the periodicity plane (AB), a rapid separation of the TBC cracked planes occurs according to a linear traction separation law. Principal stress distribution before and after the complete TBC spallation is demonstrated in Fig. 11 (ii). Numerous cracks near the TBC flank after the spallation can be explained by the limitations of Abaqus XFEM enrichment [12]. The elements at the region where those cracks occur have stresses higher than maximum principal stress before spallation. Nevertheless, initiation of cracks is not allowed due to limitation explained in 7.1. After spallation, the damage parameter (STATUSFEM) becomes unity for the existing TBC crack and nucleation of multiple cracks in its vicinity is possible. This results in the spontaneous appearance of multiple cracks at the TBC flank as shown in Fig. 11 (ii) after complete spallation has occurred.
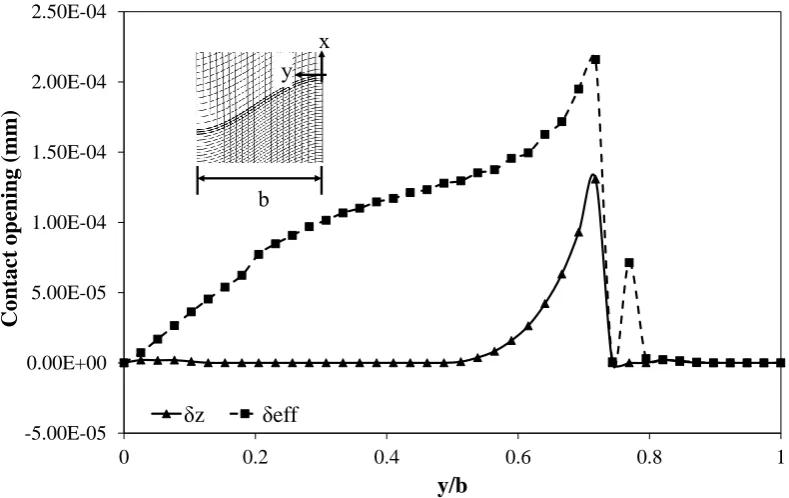
7.4Influence of initial segmented TBC cracks on crack growth within the TBC system
Fig. 12 shows the maximum principal stresses and cracks within the bulk coating for the system with two initial segmented cracks. When cooling is applied to the system, opening of the initial cracks is not expected to occur. This is because the in-plane (parallel to the TGO interface) mismatch stress within the TBC is compressive due to its lower CTE compared to the BC and substrate. The initial cracks also have no effect on the propagation direction of a TGO crack, which is growing towards the TGO/TBC interface in a similar manner to the damage-free models (Fig. 7). In the vicinity of one of the initial segmented cracks, two parallel cracks are developed during cooling. The propagation of one of the cracks is stalled once it reaches the crack surface of the initial segmented cracks. It can also be observed that if a parallel TBC crack penetrates the TBC/TGO interface, interface separation initiates and the interfacial bond weakens. Normal and effective contact openings at the interface (Fig. 13) significantly increase at the point where TBC crack penetrates the interface (y/b = 0.72 in Fig. 13). At that point, the delamination crack is expected to nucleate and this can lead to local separation of the TBC from the substrate.
8 Conclusions
The conclusions made from the presented parametric studies are as follows.
15 The delamination crack opening at the TGO/TBC interface, as observed from contact
openings at the interface, also becomes larger when the TGO becomes thicker.
In general, tangential contact separations at the TGO/TBC interface are an order of magnitude higher than normal separations. This observation indicates that it is necessary to implement mixed mode interfacial failure.
Inclusion of initial segmented cracks in the TBC increases the strain tolerance of the TBC and reduces the risk of spallation as the cracks prevent the propagations of parallel cracks. As a result, the lengths of the parallel cracks are significantly shorter for the model with initial segmented cracks (Fig. 12). This confirms that using a spraying method which creates segmented cracks after deposition (e.g. SPPS), is likely to be beneficial for coating life.
On the other hand, initial parallel micro-cracks within a TBC leads to complete spallation of the TBC and the deposition process has to be optimised to reduce this type of crack.
The proposed algorithm presented can be utilised to predict the failure of TBC systems. However, various sets of data (e.g. fracture toughness and interfacial bond strengths) for mixed-mode fracture behaviour of bulk coatings and interfaces are not currently taken into account due to a lack of experimental data. Moreover, improvements in the XFEM element formulations would enable time dependent creep deformation during steady state to be modelled.
Acknowledgement
17
References
[1] K.W. Schlichting, N.P. Padture, E.H. Jordan, M. Gell, Materials Science and Engineering A, 342 (2003) 120-130.
[2] D. Naumenko, V. Shemet, L. Singheiser, W. Quadakkers, Journal of Materials Science, 44 (2009) 1687-1703.
[3] H. Bhatnagar, S. Ghosh, M.E. Walter, Mechanics of Materials, 42 (2010) 96-107.
[4] M. Caliez, J.L. Chaboche, F. Feyel, S. Kruch, Acta Materialia, 51 (2003) 1133-1141.
[5] R. Soulignac, V. Maurel, L. Rémy, A. Köster, Surface and Coatings Technology, 237 (2013) 95-104.
[6] P. Seiler, M. Bäker, J. Rösier, IOP Conference Series: Materials Science and Engineering, 10 (2010) 012056.
[7] T.S. Hille, T.J. Nijdam, A.S.J. Suiker, S. Turteltaub, W.G. Sloof, Acta Materialia, 57 (2009) 2624-2630.
[8] T.S. Hille, A.S.J. Suiker, S. Turteltaub, Engineering Fracture Mechanics, 76 (2009) 813-825.
[9] L. Xie, D. Chen, E.H. Jordan, A. Ozturk, F. Wu, X. Ma, B.M. Cetegen, M. Gell, Surface & Coatings Technology 201 ((2006)) 1058-1064.
[10] U. Hermosilla, University of Nottingham, (Thesis (PhD), 2008).
[11] V. Maurel, E.P. Busso, J. Frachon, J. Besson, F. N’Guyen, INT J SOLIDS STRUCT, 51(19) ((2014)) 3293-3330.
[12] Abaqus, Dassault Systemes Simulia Corp., (2011).
[13] C. Sharma, Master Thesis (University of Pavia), (2007).
[14] M. Martena, D. Botto, P. Fino, S. Sabbadini, M.M. Gola, C. Badini, Eng. Fail. Anal., 13 (2006) 409-426.
[15] A. Rabiei, A.G. Evans, Acta Materialia, 48 (2000) 3963-3976.
[16] P.K. Wright, A.G. Evans, Current Opinion in Solid State and Materials Science, 4 (1999) 255-265.
[17] M. Bäker, J. Rösler, G. Heinze, Acta Materialia, 53 (2005) 469-476.
[18] T. Belytschko, T. Black, International Journal for Numerical Methods in Engineering, 45 ((1999)) 601-620.
[19] J.M. Melenk, I. Babuska, Comput. Assist. Mech. Eng. Sci, 4 (1997) 607-632.
[20] T. Belytschko, R. Gracie, G. Ventura, IOP Publishing Ltd • Modelling and Simulation in Materials Science and Engineering, Volume 17, Number 4, (2009).
[21] G. Alfano, M.A. Crisfield, International Journal for Numerical Methods in Engineering, 50 (2001) 1701-1736.
[22] S.T. Kyaw, I.A. Jones, T.H. Hyde, Eng. Fail. Anal., 27 (2013) 150-164.
[23] L. Baiamonte, F. Marra, G. Pulci, J. Tirillò, F. Sarasini, C. Bartuli, T. Valente, Surface and Coatings Technology, 277 (2015) 289-298.
[24] D. Zhu, R. Miller, Journal of Thermal Spray Technology, 9 (2000) 175-180.
[25] V. Lughi, V.K. Tolpygo, D.R. Clarke, Materials Science and Engineering: A, 368 (2004) 212-221.
18 [27] Thompson.J.A, Ji.W, Klocker.T, Clyne T.W, Ninth International Symposium on Superalloys, (2000) 685-692.
[28] A. Cipitria, I.O. Golosnoy, T.W. Clyne, Sintering Kinetics of Plasma-Sprayed Zirconia TBCs. In, 2007 International Thermal Spray Conference, Beijing, China, 14 - 16 May 2007. ASM International, 434-439.
[29] E.P. Busso, H.E. Evans, Z.Q. Qian, M.P. Taylor, Acta Materialia, 58 (2010) 1242-1251.
[30] E.P. Busso, J. Lin, S. Sakurai, M. Nakayama, Acta Mater., 49 (2001) 1515-1528.
[31] E.P. Busso, J. Phys. IV France, 09 (1999) Pr9-287-Pr289-296.
[32] J. Rösler, M. Bäker, K. Aufzug, Acta Mater. , 52 (2004) 4809-4817.
[33] E.P. Busso, Z.Q. Qian, M.P. Taylor, H.E. Evans, Acta Materialia, 57 (2009) 2349-2361.
[34] U. Hermosilla, M.S.A. Karunaratne, I.A. Jones, T.H. Hyde, R.C. Thomson, Mater. Sci. Eng. A, 513-514 (2009) 302-310.
[35] S. Maharjan, X. C. Zhang, F. Z. Xuan, Z. D. Wang, S.T. Tu, J. Appl. Phys. 110, 063511 (2011), (2011).
[36] R.G. Munro, J. Am. Ceram. Soc., 80 (1997) 1919-1928.
[37] J. Kondoh, H. Shiota, K. Kawachi, T. Nakatani, Journal of Alloys and Compounds, 365 (2004) 253-258.
[38] J.W. Adams, R. Ruh, K.S. Mazdiyasni, Journal of the American Ceramic Society, 80 (1997) 903-908.
[39] M. Gell, J. Eric, V. Krishnakumar, K. McCarron, B. Barber, Y.-H. Sohn, V.K. Tolpygo, Surface and Coatings Technology, 120–121 (1999) 53-60.
[40] M. Okazaki, Y. Yamazaki, K. Namba, K. Ogawa, M. Ohki, K. Fujiyama, H. Waki, M. Arai, M. Sekihara, A. Itoh, H. Fukanuma, N. Ohno, H. Kaneko, M. Kawamura, Journal of Solid Mechanics and Materials Engineering, Volume 4, Issue 2, pp. 252-263 (2010).
[41] C. Berndt, Journal of Materials Engineering, 11 (1989) 275-282.
[42] M. Seraffon, N.J. Simms, J.R. Nicholls, J. Sumner, J. Nunn, Mater. High Temp., 28 (2011 ) 309-314.
[43] F. Krasucki, S. Lenci, International Journal of Solids and Structures, 37 (2000) 3619-3632.
[44] D.W. Stollberg, J.M. Hampikian, L. Riester, W.B. Carter, Materials Science and Engineering A, 359 (2003) 112-118.
[45] Y.YAMAZAKI, S.KUGA, T.YOSHIDA, Acta Metallurgica Sinica(English letters), Vol.24 (2011) 109-117.
[46] M. Ranjbar-Far, J. Absi, G. Mariaux, F. Dubois, Mater. & Des., 31 (2010) 772-781.
[47] The International Nickel Company Inc. Alloy IN-738 technical data.
19
Fig. 1: (i) A TBC system with a sinusoidal TGO with periodicity in the circumferential direction
(Cells bounded by double-dashed line are used for a FE unit cell); not to scale (ii) A detailed
geometry of the TGO interface (iii) Mesh and boundary conditions of a unit cell (uθ represents
displacement in the circumferential direction)
[image:19.595.113.485.68.348.2] [image:19.595.216.413.435.620.2]20
Fig. 3: Linear traction-separation law
Fig. 4: Damage parameter and unloading process
δn(mm) O
X
Y
Z
δ T
T (MPa)
δz δy
k
(1-D)k
δ (mm) O
X
Y
Z δ
T T (MPa)
δz δy Tu
(1-D)Tu, Td
0<D<1 P
Q R
[image:20.595.173.418.316.682.2]21
Fig. 5: Adhesion tensile pull test (DIN 50160)
Fig. 6: Maximum difference between out-of-plane stresses at the TGO/TBC interface given by a cohesive interface model with different cohesive stiffness and by the model with a tied interface
F
F
Epoxy based adhesive coating
metal
[image:21.595.145.453.321.541.2]22
Fig.
7
: Max
im
um p
ri
nc
ip
al
s
tre
ss
es
f
o
r t
he
m
od
el
s
w
it
h d
if
fer
en
t T
G
O
t
hi
ck
ness
[image:22.595.129.456.70.623.2]24
Fig. 9: Normal separations at the TGO/TBC interface for the models with different TGO thicknesses
Fig. 10: Effective separations at the TGO/TBC interface for the models with different TGO thicknesses
-1.0E-05 0.0E+00 1.0E-05 2.0E-05 3.0E-05 4.0E-05
0 0.2 0.4 0.6 0.8 1 1.2
No
rm
al
separat
ion
(δ
n
),
mm
y/b
COPEN(TGO = 2 µm) COPEN(TGO = 4 µm) COPEN (TGO = 1 µm) COPEN(TGO = 3 µm)
y x
b
1.0E-19 1.0E-16 1.0E-13 1.0E-10 1.0E-07 1.0E-04 1.0E-01
0 0.2 0.4 0.6 0.8 1 1.2
Effectiv
e
sepa
rat
ion
(δ
eff
),
mm
y/b
TGO = 1 µm TGO = 2 µm TGO = 3 µm TGO = 4 µm
2 slip 2 n
eff
y x
[image:24.595.97.497.398.656.2]26
Fig. 12: XFEM cracks within the TBC systems with initial segmented cracks after cooling to 20°C from 1000°C (4μm TGO)
Fig. 13: Normal and effective contact openings at the TGO/TBC interface for the system with initial segmented cracks within the TBC
Initial segmented crack TGO crack
Newly formed parallel cracks
-5.00E-05 0.00E+00 5.00E-05 1.00E-04 1.50E-04 2.00E-04 2.50E-04
0 0.2 0.4 0.6 0.8 1
Co
nt
act
op
ening
(mm)
y/b
δz δeff
y x
[image:26.595.96.491.346.595.2]27
Table 1: Elastic properties and CTEs of coatings and substrate
Temperature
(°C) Substrate [47] TBC [24, 48] TGO [36] BC [48] E
(GPa) v
CTE, K1.106
E (GPa) v
CTE, K1.106
E (GPa) v
CTE, K1.106
E (GPa) v
CTE, K1.106
20 - - - 120 0.18 10.0 400 0.23 6.62 202.9 0.27 20.
24 206 0.28 11.23 - - - -
50 - - - 202.7 0.27 50.
93 195.1 0.27 11.97 - - - -
200 - - - 390 0.23 - 199.92 0.27 200.
204 190.3 0.27 13.23 - - - -
316 184.8 0.28 14.4 - - - -
400 - - - 380 0.24 -
500 - - - 184.8 0.27 500.
538 175.1 0.3 16.2 - - - -
600 - - - 370 0.24 -
700 - - - 167.72 0.27 700.
760 157 0.3 - - - -
800 - - 18.38 - - - 355 0.25 -
871 151 0.29 - - - -
982 140 0.3 19.42 - - - -
1000 - - - 325 0.25 - 131.6 0.27 1000.