An Improved Replacement Oscillator Approach for Soil-Structure
Interaction Analysis Considering Soft Soils
Yang Lu
1*, Iman Hajirasouliha
2, Alec M. Marshall
31 College of Architecture and Environment, Sichuan University, PRC 2Department of Civil & Structural Engineering, The University of Sheffield, UK
3Department of Civil Engineering, University of Nottingham, UK
*Corresponding Author: E-mail: [email protected]
Abstract
This paper aims to improve the effectiveness of the replacement oscillator approach for soil-structure interaction (SSI) analysis of flexible-base structures on soft soil deposits. The replacement oscillator approach transforms a flexible-base single-degree-of-freedom (SDOF) structure into an equivalent fixed-base SDOF (EFSDOF) oscillator so that response spectra for fixed-base structures can be used directly for SSI systems. A sway-rocking SSI model is used as a baseline for assessment of the performance of EFSDOF oscillators. Both elastic and constant-ductility response spectra are studied under 20 horizontal ground motion records on soft soil profiles. The effects of frequency content of the ground motions and initial damping of the SSI systems are investigated. It is concluded that absolute acceleration spectra, instead of pseudo-acceleration spectra, should be used for EFSDOF oscillators in force-based design of SSI systems. It is also shown that using an EFSDOF oscillator is not appropriate for predicting the constant-ductility spectra when the initial damping ratio of the SSI system exceeds 10%. Based on the results of this study, a correction factor is suggested to improve the accuracy of the replacement oscillator approach for soft soil conditions.
1. Introduction
The preliminary design of typical building structures in current seismic design codes and provisions is mainly based on elastic spectrum analysis, where the inelastic strength and displacement demands are estimated by using modification factors, such as the constant-ductility strength reduction factor R (i.e. reduction in strength demand due to nonlinear hysteretic behaviour) and inelastic displacement ratio C[1–3]. The spectral shapes of elastic response spectra and modification factors in most seismic design codes and provisions (e.g. [3,4]) are derived by averaging the results of response-history analyses performed on single-degree-of-freedom (SDOF) oscillators using a number of earthquake ground motions [5–7]. In engineering practice, the frequency content of a ground acceleration motion at a soft soil site is often characterized by a predominant period [8] as an influential parameter for estimating the seismic response of buildings.
It is well known that spectral accelerations for soft soil sites attain their maximum values at specific periods TP, which correspond to the resonance between the vibration of buildings and the amplification of seismic
waves travelling upwards through various soil deposits [9]. However, most current seismic codes adopt design acceleration spectra that are smoothed by the averaging of a number of spectra whose peak ordinates may occur at significantly different values of TP. As a consequence, averaging these dissimilar spectra leads to a
flatter spectrum for soft soil profiles than for rock and stiff soil sites, while disregarding the frequency content of the ground motions [7].
Xu and Xie [10] developed the concept of a Bi-Normalized Response Spectrum (BNRS) by normalizing the spectral acceleration Sa and the period of the structure T by the Peak Ground Acceleration (PGA) and the
spectral predominant period TP of each ground excitation, respectively. Based on analyses performed using
206 free-field records of the Chi-Chi earthquake (1999), they found that the BNRS curves were practically independent of site class or epicentre distance, and thus represented a good substitute for the code-specified design spectra that are based on simple averaging of spectral values. In a follow-up study, Ziotopoulou and Gazetas [7] demonstrated that BNRS can preserve the resonance between soil deposits and excitations, thereby reflecting more realistically the effects of the frequency content of the ground motion.
Comprehensive studies have been carried out in the past three decades to calculate values of constant-ductility strength reduction factor R and inelastic displacement ratio C for fixed-base structures [11,12]. It has been shown that R and C usually reach their maximum and minimum values, respectively, at the predominant period of the ground motion Tg, which is defined as the maximum ordinate in the relative velocity spectrum
calculated for an elastic SDOF system having a 5% damping ratio. It has also been observed that, in the vicinity of Tg, maximum inelastic displacements are sometimes smaller than the elastic displacement demands. It
should be noted that the predominant period is mainly a characteristic of soft soils.
The studies discussed above all assumed that the structures were rigidly supported, adopted a viscous damping ratio between 2 and 5%, and disregarded the effects of soil stiffness and damping within the soil domain, also known as soil-structure interaction (SSI) effects. However, it is well known that SSI can significantly affect the seismic response of superstructures, especially those on soft soil profiles [13,14]. Khoshnoudian et al [15] and Khoshnoudian and Ahmadi [16,17] investigated the effects of SSI on the seismic performance of nonlinear SDOF and multi-degree of freedom (MDOF) systems and proposed empirical equations to predict the inelastic displacement ratios. However, the results of their studies were mainly based on pulse-like near-field earthquakes, and therefore, may not be directly applicable for other types of earthquake ground motions.
For design purposes, an SSI system is usually replaced by an equivalent fixed-base SDOF (EFSDOF) oscillator (also called replacement oscillator) having an elongated period of Tssi, an effective initial damping ratio of ssi
and an effective ductility ratio of ssi. Inelastic and linear EFSDOF oscillators were adopted by Mekki et al.
response spectra can provide more accurate design solutions for nonlinear systems compared to equivalent linearization (e.g. [21,22]), the current study is focused on inelastic EFSDOF oscillators.
The effectiveness of the EFSDOF oscillator approach for seismic design of structures located on soft soil sites is evaluated in this paper. A sway and rocking SSI model, which provides sufficient accuracy for modelling the dynamic soil-structure interaction in engineering practice (e.g. [13,14]), is used as a reference to assess the accuracy of the results obtained using the EFSDOF oscillators. The effects of both SSI and frequency content of seismic excitations on elastic and inelastic response spectra are investigated using the adopted SSI models and the EFSDOF oscillators for 20 far-field earthquake ground motions recorded on soft soil sites. The results are then used to improve the EFSDOF oscillator for predicting constant-ductility spectra of flexible-base structures on soft soil profiles. The current study, for the first time, proposes improvements to the replacement oscillator approach and explicitly includes the effect of frequency content of ground motions on soft soils in SSI analysis. The paper provides a description of the adopted SSI model and key design parameters, as well as the EFSDOF oscillator. Limitations of the EFSDOF oscillator approach for highly damped SSI systems are identified and some modifications are suggested to improve predictions. The strengths and potential applications of the improved EFSDOF approach to SSI procedures in performance-based design are also addressed.
2. Soil-structure interaction model
For the SSI model adopted in this study, the superstructure is idealized as an equivalent SDOF oscillator having a mass ms, mass moment of inertia Js, effective height hs, and lateral stiffness ks. In response to seismic loading,
the oscillator is assumed to exhibit elastic-perfectly plastic behaviour as an energy dissipation mechanism, in addition to having a viscous damping ratio of s in its elastic state. This nonlinear hysteretic model can simulate
the seismic behaviour of non-deteriorating structural systems such as buckling-restrained braced frames and moment resisting steel frames.The superstructure represents either a single-storey or a multi-storey building corresponding to its fundamental mode of vibration.
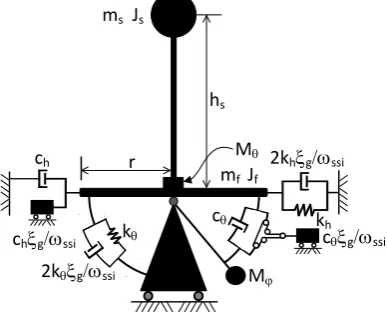
The dynamic behaviour of the shallow foundation is simulated using a discrete-element model, which is based on the idealization of a homogeneous soil under a rigid circular base mat as a semi-infinite truncated cone [23]. The accuracy of this model has been validated against more rigorous solutions [24,25]. Fig. 1 shows the SSI model used in this study, which consists of a superstructure and a foundation with sway and rocking components defined by Wolf [25] as follows:
2 2
, 2 8
r v c r v
k s h s
h
(1)
1
, 4 38 2 3 v r4
c r v
k s
p
(2)
2 5 2 51 128
9 ,
3 1 3 .
0
s p
v v r M
r
M (3)
where kh, k and ch, c correspond to the zero-frequency foundation stiffness and high-frequency dashpot
coefficient for the sway and rocking motions, respectively. The circular foundation beneath the superstructure is assumed to be rigid, with a radius r, mass mf and centroidal mass moment of inertia Jf. For simplicity, the
superstructure is assumed to be axisymmetric with its mass uniformly distributed over a circular area of radius r. Therefore, the moment of inertia J of either the superstructure or the foundation is equal to mr2/4, m being
the corresponding mass of the foundation mf or the superstructure ms. The homogenous soil half-space is
characterized by its mass density , Poisson’s ratio , as well as the shear and dilatational wave velocities vs
and vp. An additional rocking degree of freedom , with its own mass moment of inertia M is introduced so
of the linear SSI model was verified against results obtained using the foundation impedance functions [27]; for inelastic structures the model was verified using the central difference numerical integration method [28].
kh
r M
M
c
cg/wssi
2kg/wssi k
ch
chg/wssi
2khg/wssi ms Js
[image:4.595.192.386.108.264.2]mf Jf hs
Fig. 1. Soil-structure interaction model
Note that soil incompressibility leads to a high value of vp (i.e. vp→∞ as →0.5), which consequently results
in an unrealistic overestimation of the rocking damping at high frequencies (see Eq. (2)). To address this issue, an added mass moment of inertia M was assigned to the foundation rocking degree of freedom, while vp was
replaced with 2vs for 1/3<≤0.5. The soil material damping g was evaluated at the equivalent frequency of
the SSI system wssi and modelled by augmenting each of the springs and dashpots with an additional dashpot
and mass, respectively.
3. Modelling parameters
In this study, the following dimensionless parameters were used to characterize the important features of SSI systems:
1. Structure-to-soil stiffness ratio a0:
s s s
v
h
a
0
w
(4) where ws=2/Ts is the circular frequency of the superstructure in its fixed-base condition, with Ts being thecorresponding natural period. 2. Slenderness ratio of a building s:
r
h
s
s (5) 3. Structure-to-soil mass ratio m̅:2 r h m m
s s
(6)
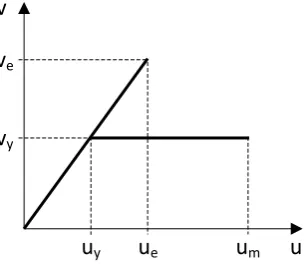
4. Ductility demand :
y m
u u
(7)where um is the maximum earthquake-induced displacement and uy the yield displacement (see Fig. 2). For an
SSI system, either a global ductility ssi or a structural ductility s can be defined. The former corresponds to
v
ev
yu
yu
eu
mv
[image:5.595.218.371.81.213.2]u
Fig. 2. Elastic-perfectly plastic lateral force-displacement relation
It has been shown that a0 and s are key parameters that control the severity of SSI effects [13]. In engineering
practice, a0 generally varies from 0, for buildings that are rigidly supported, to 3 for buildings built on very
soft soil profiles [28]. In the current study, all superstructures were assumed to have a slenderness ratio s less than or equal to 4, while the structure-to-soil mass ratio m̅ was set to 0.5 and the foundation mass was assumed to be ten percent of the structural mass (i.e. mf/ms=0.1). The Poisson’s ratio was taken as 0.5 (for very soft
soil in undrained conditions) and both elastic structural damping and soil hysteretic damping ratios were set to 5% (i.e. s=g=0.05) unless stated otherwise. The stated parameter values are representative of those for
common building structures (e.g. [13,28]).
Considering an SDOF oscillator with a simple elasto-plastic force-deformation relation depicted in Fig. 2, the constant-ductility strength reduction factor R and inelastic displacement ratio C are defined as:
y e
V V R ,
e m
u
u
C
(8) where Ve and ue are maximum base shear and displacement of an oscillator under seismic loading in its elasticcondition, and um is the maximum displacement of a yielding oscillator with a reduced base shear strength Vy
under the same loading condition. Given the definition of ductility demand given by Eq. (7), the inelastic displacement ratio can be calculated by:
R
C (9)
Eq. (8) illustrates that Rand C link the strength and displacement demands of an inelastic system to its elastic counterpart, allowing the seismic demands of an inelastic SDOF oscillator to be determined directly from an elastic design acceleration Sa or displacement Sd spectrum. This will be explained in more detail in the
following sections.
4. EFSDOF oscillator
The elastic response of a dynamic system under a specific ground motion is mainly dependent on its natural period and damping ratio. Replacement of an SSI system by an equivalent fixed-base SDOF (EFSDOF) oscillator with an equivalent period Tssi and an effective damping ratio ssi has been adopted by many
researchers as a convenient way to simplify SSI analyses (e.g. [29]). This approach is based on the selection of Tssi and ssifor the EFSDOF oscillator so that its resonant pseudo-acceleration and the corresponding
frequency are equal to those of the actual SSI system. Since EFSDOF oscillators in general can provide accurate estimations of the deformation demands of SSI systems, several studies have been devoted to the derivation of Tssi and ssi for flexibly-supported structures [30,31]. Notable examples include the Veletsos and
2
4
1
ssi ssi
w
(10)
2 2 2 2 2 24
1
4
1
4
1
s ss h
h h
ssi
w
w
w
(11)
where is defined by:
1 2 2 2 2 2 2 4 1 1 4 1 1 4 1 1 s s hh
w
w
w
(12)
and the frequencies wh, w and damping ratios h, (including both radiation damping and soil material
damping) are calculated according to:
w
w
w
w
w
w
2
,
2
,
,
2 2 2 s h h s h s s f s f h h hv
r
v
r
h
m
J
k
m
m
k
(13)in which w is the circular frequency of vibration. Closed-form expressions for h, , h, , defined as
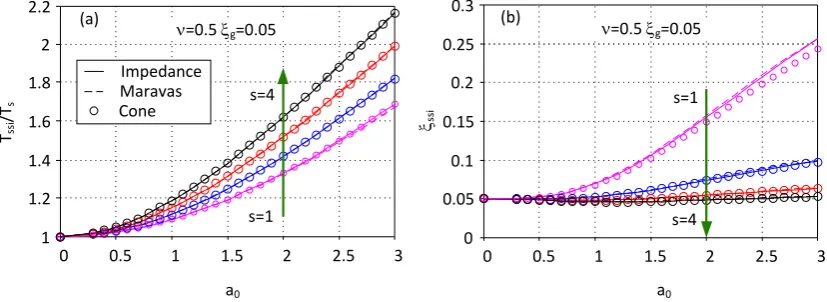
frequency-dependent coefficients associated with dynamic spring stiffness and dashpot damping, were proposed by Veletsos and Verbic [27]. These frequency-dependent springs and dashpots that characterize the dynamic foundation force-displacement relationships are termed “foundation impedance functions”. Fig. 3 presents a comparison between cone and impedance models as well as the Maravas et al. [32] solutions by expressing the period lengthening ratio Tssi/Ts and the effective damping ratio ssi as functions of the
structure-to-soil stiffness ratio a0 and the slenderness ratio s. The procedures for determining Tssi/Ts and ssi using the
cone and impedance models are explained in Appendix 1.
a0
0 0.5 1 1.5 2 2.5 3
1 1.2 1.4 1.6 1.8 2 2.2 Tss i /Ts s=4 s=1
=0.5 g=0.05
Impedance Maravas Cone (a)
a0
0 0.5 1 1.5 2 2.5 3
0 0.05 0.1 0.15 0.2 0.25 0.3 s=1 s=4
=0.5 g=0.05 (b)
[image:6.595.85.499.398.549.2]ssi
Fig. 3. Comparison of period lengthening ratio and effective damping of SSI systems (=0.5 and g=0.05)
Due to the frequency dependence of wh, w, h and , the response parameters shown in Fig. 3 were obtained
iteratively until the frequency of vibration w equalled wssi, within an acceptable tolerance of 0.1%. It should
be mentioned that the Maravas et al. [32] method inherently assumes that the structural damping is frequency independent. Therefore, if viscous damping is used, as was done in this study, the damping ratios s in Eqs.
(10) to (12) should be multiplied by ws/w.
In general, Fig. 3 shows good agreement between the three sets of results, which validates the use of the cone model as the baseline for evaluating the EFSDOF oscillator results. It is observed that slender buildings always have a greater period lengthening and a lower effective damping when compared with short squatty structures. Softer soil profiles (i.e. higher a0 values) also lead to greater period lengthening and higher effective damping
a negligible influence on the effective damping ratio. Note that these observations are based on the parameters considered in this study, which represent common building structures located on soft soil profiles.
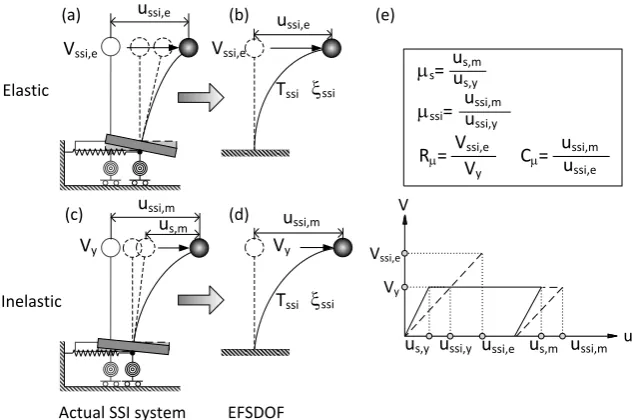
Fig. 4 schematically illustrates how the EFSDOF oscillator can be used to design flexible-base structures. For elastic systems, an SSI system shown in Fig. 4 (a) can be replaced by a fixed-base oscillator with Tssi and ssi
shown in Fig. 4 (b). As a result, the base shear and displacement demands of the flexible-base system can be obtained from a response spectrum derived for fixed-base structures with an effective damping ratio ssi and
an elongated period Tssi (or a reduced initial stiffness kssi).
ussi,m us,m ussi,e
Vssi,e
Vy
Actual SSI system Elastic
Inelastic
EFSDOF ussi,m ussi,e Vssi,e
Vy Tssi ssi
Tssi ssi
(a) (b)
(c) (d)
(e)
ssi= u ssi,y ussi,m
s= us,y us,m
u V
us,y ussi,y us,m ussi,m
Vy Vssi,e
ussi,e C=
R= u
ssi,e ussi,m Vy
Vssi,e
Fig. 4. Equivalent fixed-base SDOF (EFSDOF) oscillator approach to design flexible-base structures
If the superstructure exhibits nonlinear deformation, the maximum seismic lateral force imposed on the SSI system will be equal to the base shear strength Vy of the superstructure. To measure the level of inelastic
deformation, either the global ductility ssi=ussi,m/ussi,y or the structural ductility s=us,m/us,y can be used. Based
on the assumption that the energy dissipated by yielding of the SSI system (Fig. 4 (c)) is equal to that of the EFSDOF oscillator (Fig. 4 (d)), the following relation between the global and structural ductility ratios, with reference to Fig.4 (e), can be obtained [33]:
1
12
s
ssi s ssi
T
T
(14)It should be mentioned that the energy dissipation due to elastic damping was not accounted for in the derivation of Eq. (14). The EFSDOF oscillator used in this study enables both global and structural ductility demands to be determined simultaneously. Therefore, displacement demands relating to either an SSI system (including the rigid-body motions of the foundation) or the structural deformation can be estimated using Eq. (14).
5. Response Parameters
to study the inelastic displacement ratio for SSI systems where foundations were either bonded to the soil [14] or allowed to separate (uplift) [34]. However, the effect of the spectral predominant period was disregarded in those studies.
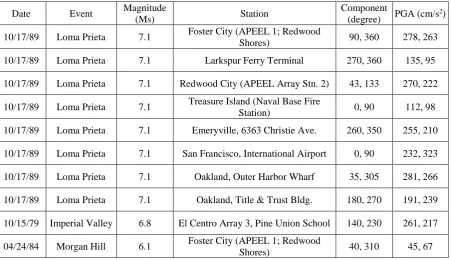
Table 1. Ground motions recoded on very soft soil profiles
Date Event Magnitude
(Ms) Station
Component
(degree) PGA (cm/s
2)
10/17/89 Loma Prieta 7.1 Foster City (APEEL 1; Redwood
Shores) 90, 360 278, 263
10/17/89 Loma Prieta 7.1 Larkspur Ferry Terminal 270, 360 135, 95
10/17/89 Loma Prieta 7.1 Redwood City (APEEL Array Stn. 2) 43, 133 270, 222 10/17/89 Loma Prieta 7.1 Treasure Island (Naval Base Fire
Station) 0, 90 112, 98
10/17/89 Loma Prieta 7.1 Emeryville, 6363 Christie Ave. 260, 350 255, 210 10/17/89 Loma Prieta 7.1 San Francisco, International Airport 0, 90 232, 323 10/17/89 Loma Prieta 7.1 Oakland, Outer Harbor Wharf 35, 305 281, 266 10/17/89 Loma Prieta 7.1 Oakland, Title & Trust Bldg. 180, 270 191, 239 10/15/79 Imperial Valley 6.8 El Centro Array 3, Pine Union School 140, 230 261, 217 04/24/84 Morgan Hill 6.1 Foster City (APEEL 1; Redwood
Shores) 40, 310 45, 67
The current study investigates the accuracy of the EFSDOF oscillator by comparing results with those of the corresponding SSI model illustrated in Fig. 1. Note that for squatty buildings (e.g. s=1), the effective damping ratio ssi can increase up to 25% (see Fig. 3), whereas it is usually around 5% for typical fixed-base structures.
It is required by seismic provisions [1] that the effective damping ratio of a linear SSI system is higher than 5% but does not exceed 20%. Therefore, in the current study, the damping ratios ssi of the selected SSI systems,
which were achieved using various combinations of a0 and s, were restricted to the range of 5-20%. In the
following sections, the response obtained using the SSI models and their EFSDOF oscillators are illustrated using elastic acceleration spectra, constant-ductility strength reduction factor, and inelastic displacement ratio spectra.
6. Elastic acceleration response spectrum
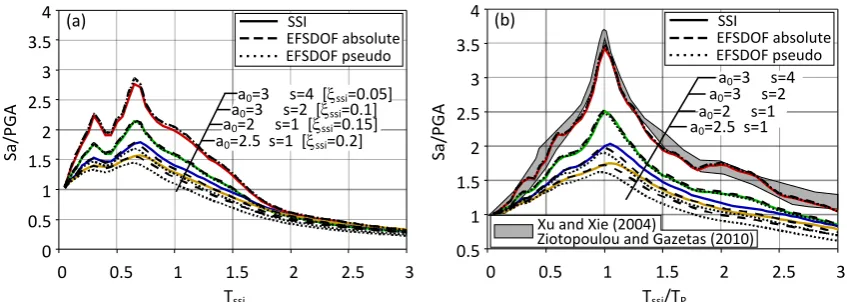
The average acceleration response spectra of the 20 selected ground motions (Table 1) were calculated for the EFSDOF oscillators and their corresponding SSI models considering different effective damping ratios, as shown in Fig. 5. To account for the frequency content of the ground motions, the results are also presented using Bi-Normalized Response Spectrum (BNRS) curves where the predominant period TP was measured for
each acceleration record at its maximum spectral ordinate value. It was found that the period TP was almost
unaffected by the initial damping level in the range of interest (i.e. =5-20%); a value of TP corresponding to
Tssi
(a)
Sa
/P
G
A
0 0.5 1 1.5 2 2.5 3
0 0.5 1 1.5 2 2.5 3 3.5 4
a0=3 s=4 [ssi=0.05] a0=2 s=1 [ssi=0.15]
a0=3 s=2 [ssi=0.1] a0=2.5 s=1 [ssi=0.2]
SSI
EFSDOF absolute EFSDOF pseudo
0 0.5 1 1.5 2 2.5 3
0.5 1 1.5 2 2.5 3 3.5 4
Tssi/TP
(b)
Sa
/P
G
A
Xu and Xie (2004)
Ziotopoulou and Gazetas (2010)
a0=3 s=4 a0=3 s=2 a0=2 s=1 a0=2.5 s=1
SSI
[image:9.595.79.503.73.224.2]EFSDOF absolute EFSDOF pseudo
Fig. 5. Elastic acceleration spectra for flexible-base structures: (a) conventional format and (b) bi-normalized format
In Figs. 5 (a) and (b), the solid lines represent the SSI models, whereas the dashed lines are the results obtained using the EFSDOF oscillators, both of which were obtained by averaging the peak absolute acceleration of the structure (including ground accelerations) under the 20 ground acceleration records. The dotted lines correspond to the average pseudo-acceleration spectra of the EFSDOF oscillators. Fig. 5 shows that for SSI systems with low initial damping ratios of ssi≤10%, using either absolute or pseudo-acceleration spectra of
the EFSDOF oscillators can provide an accurate prediction of the peak absolute accelerations of the structural mass in the SSI models. However, the spectral accelerations of SSI models having higher initial effective damping ratios (i.e. ssi=15% and 20%) are generally higher than those of the EFSDOF oscillators, especially
when spectral pseudo-accelerations are compared. The difference between absolute and pseudo-acceleration spectra is negligible in typical fixed-base building structures due to their low structural damping s [35].
Therefore, the pseudo-acceleration spectra adopted by seismic codes can provide accurate seismic design of fixed-base buildings. In addition, damping in soil serves to dissipate external energy to a structure, which is usually designed on the basis of a acceleration spectrum. However, using the spectral pseudo-acceleration of EFSDOF oscillators with high effective damping ssi may result in a severely underestimated
design base shear for the actual flexible-base structures (explained in detailed in Appendix 1). Therefore, for the force-based seismic design of SSI systems, the absolute acceleration spectra should be used in EFSDOF oscillators. This implies that for SSI analyses, damping reduction factors compatible with absolute acceleration spectra should be adopted [36].
Fig. 5 also shows that the conventional acceleration response spectra exhibit two subsequent peaks, whereas the BNRS curves reach a distinct peak value at Tssi/TP≈1. As discussed earlier, a BNRS accounts for the
frequency content of the ground motions in the averaging process. The peak spectral ordinates of the BNRS for initial effective damping ratios of ssi=0.05, 0.1, 0.16 and 0.21 are, respectively, 1.22, 1.17, 1.13 and 1.11
times higher than those of the conventional spectra. By using more ground motion records, the spectral shape in Fig. 5 (a) would become more similar to those adopted by seismic codes, where a flat segment is expected due to averaging and smoothing. In that case, the difference between the peak values for the conventional and bi-normalized spectra would be even more significant. In Fig. 5 (b), the curves associated with ssi=0.05
coincide with the shaded area that envelops the 5% damped BNRS obtained by Xu and Xie [10] and Ziotopoulou and Gazetas [7], demonstrating the consistency of the BNRS.
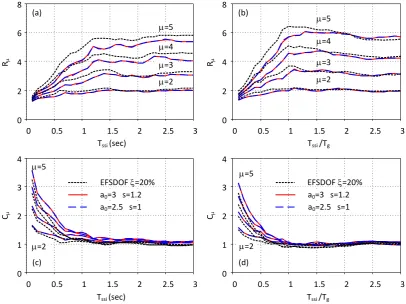
7. Constant-ductility strength reduction factor and inelastic displacement ratio
According to the definitions of the modification factors used for SSI systems (shown in Fig. 4), R and C were calculated based on the displacements of the structural mass relative to the ground, which included the foundation rigid-body motions. The spectral predominant period for a specified ground motion Tg is defined
as the period at which the maximum ordinate of the relative velocity spectrum (for a damping ratio of ssi)
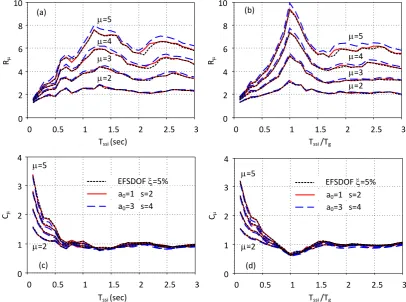
Fig. 6 compares the R and C spectra derived using the SSI models and EFSDOF oscillators. The a0 and s
values of the SSI systems were chosen so that the effective damping ratio ssi was approximately equal to 5%,
which was then assigned to the EFSDOF oscillators. The results in Fig. 6 are the averaged R and C spectra obtained for all 20 ground motions and are presented in both conventional and normalized formats. Similar to previous studies (e.g. [5,37]), the peaks and valleys are more noticeable when using the normalized format (Figs. 6 (b) and (d)). For instance, the normalized response spectrum curves indicate that, at a period ratio Tssi/Tg≈1, the peak displacement of an inelastic system is on average smaller than its elastic counterpart (i.e.
C< while the constant-ductility strength reduction factor R is always maximum. This important behaviour is not obvious from the conventional response spectra shown in Figs. 6 (a) and (c).
R
(a)
0 0.5 1 1.5 2 2.5 3
0 2 4 6 8 10
=4
=2
=5
=3
Tssi (sec)
R
(b)
0 0.5 1 1.5 2 2.5 3
0 2 4 6 8 10
=4
=2
=5
=3
Tssi /Tg
C
Tssi (sec)
=5
=2
(c)
0 0.5 1 1.5 2 2.5 3
0 1 2 3 4
EFSDOF=5%
a0=3 s=4 a0=1 s=2
C
Tssi /Tg
=5
=2
(d)
0 0.5 1 1.5 2 2.5 3
0 1 2 3 4
a0=3 s=4 a0=1 s=2 EFSDOF=5%
Fig. 6. Conventional (a, c) and normalized (b, d) R and C spectra for SSI models and EFSDOF oscillators (5% damping ratio)
Fig. 6 illustrates that the use of the EFSDOF oscillator is, in general, able to provide a reasonable estimate of R and C for SSI systems. However, for slender structures (e.g. a0=3, s=4) where period lengthening becomes
higher, the oscillator approach slightly underestimates R, which consequently leads to an overestimation of C, especially when global ductility demands become higher. Since the EFSDOF oscillators work perfectly well for predicting the elastic response of the SSI system with a0=3 and s=4 (see Fig. 5 (b)), the underestimation
of R could be a result of a higher strength predicted by the EFSDOF oscillators than that required by the SSI models to satisfy a target ductility demand. As will be discussed in the following sections, due to a large period lengthening effect, a global ductility ratio ssi=4 for an SSI system with a0=3 and s=4 corresponds to an
unexpectedly high structural ductility ratio s>10, which is not used in common practice. Therefore, the results
for higher global ductility demands are not seen to be important for practical design purposes. Note also that it may not be practical for a common flexible-base slender building to have a short elastic fundamental period (e.g. a0=3, s=4, Tssi<0.5 in Fig. 6). These systems were mainly used to show that the damping ratio values due
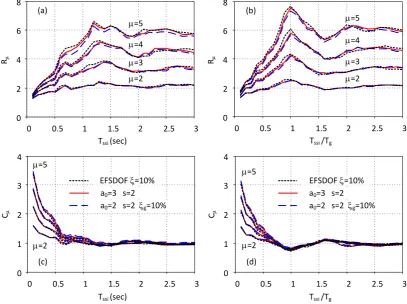
For a higher effective damping ratio ssi=10%, the performance of the EFSDOF oscillators is still excellent, as
shown in Fig. 7. However, in general, values of R calculated by the oscillator approach are slightly higher than those from the SSI models. Fig. 7 also includes results for SSI systems with a larger soil material damping g=10%; R and C predictions by the EFSODF oscillators for these cases are very good. Therefore, it can be
concluded that an EFSDOF oscillator is a viable substitute for a lightly-to-moderately damped SSI system.
R
(a)
0 0.5 1 1.5 2 2.5 3
0 2 4 6 8
=4
=2
=5
=3
Tssi (sec)
R
(b)
0 0.5 1 1.5 2 2.5 3
0 2 4 6 8
=4
=2
=5
=3
Tssi /Tg
C
Tssi (sec) (c)
0 0.5 1 1.5 2 2.5 3
0 1 2 3 4
=5
=2
EFSDOF=10%
a0=2 s=2 g=10% a0=3 s=2
C
Tssi /Tg (d)
0 0.5 1 1.5 2 2.5 3
0 1 2 3 4
=5
=2
EFSDOF=10%
[image:11.595.86.494.156.460.2]a0=2 s=2 g=10% a0=3 s=2
Fig. 7. Conventional (a, c) and normalized (b, d) R and C spectra for SSI models and EFSDOF oscillators (10% damping ratio)
Fig. 8 presents results for a much higher initial damping ratio ssi=20%, which is the upper limit of the overall
R
(a)
0 0.5 1 1.5 2 2.5 3
0 2 4 6 8
=4
=2
=5
=3
Tssi (sec)
R
(b)
0 0.5 1 1.5 2 2.5 3
0 2 4 6 8
=4
=2
=5
=3
Tssi /Tg
C
Tssi (sec) (c)
=5
0 0.5 1 1.5 2 2.5 3
0 1 2 3 4
EFSDOF=20%
a0=2.5 s=1 a0=3 s=1.2
=2
C
Tssi /Tg (d)
=5
0 0.5 1 1.5 2 2.5 3
0 1 2 3 4
EFSDOF=20%
a0=2.5 s=1 a0=3 s=1.2
[image:12.595.87.494.75.379.2]=2
Fig. 8. Conventional (a, c) and normalized (b, d) R and C spectra for SSI models and EFSDOF oscillators (20% damping ratio)
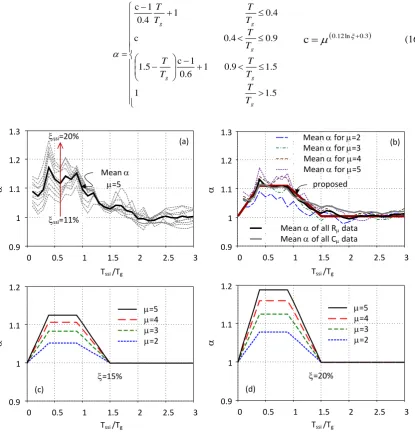
It can be concluded from the above observations that the EFSDOF oscillators, over a wide range of normalized period, over- and under-estimate, respectively, R and C values for SSI systems with a high initial damping ratio. Therefore, a correction factor can be introduced to improve predictions of the EFSDOF oscillators for highly damped SSI systems. Note that for common building structures having a slenderness ratio s greater than 2, the effective damping ratio is always lower than 10%, regardless of a0 values (see Fig. 3), which means that
the EFSDOF oscillator approach can be directly applied to these structures without any modification. To improve the prediction of the seismic response of SSI systems, a correction factor is defined in this study as the ratio of R predicted by an EFSDOF oscillator to that of the SSI model. According to Eq. (9), can also be used to modify the inelastic displacement ratio C predicted by an EFSDOF oscillator:
, , /
, , / ,
, /
, , / ,
, /
, ,
, ,
g EFSDOF
g ssi
g ssi
g EFSDOF g
T T C
T T C T
T R
T T R
T
T (15)
The constant-ductility strength reduction factor ratios R,EFSDOF/R,ssi were calculated for each of the SSI
systems which had initial effective damping ratios varying from 11-20% at a 1% interval. Fig. 9(a) is an example of the results for SSI systems with a global ductility ratio ssi=5. As expected, the correction factor
becomes greater for higher initial effective damping levels, and the averaged data exhibits, approximately, an ascending, a constant, and a descending trend, respectively, in spectral regions Tssi/Tg<0.4, 0.4≤Tssi/Tg<0.9,
and Tssi/Tg≥0.9. Mean R,EFSDOF/R,ssi ratios for ductility values from 2 to 5 are compared in Fig. 9 (b), which
shows that, in general, greater correction factor values should be applied to more ductile systems. Fig. 9 (b) also illustrates the mean spectra derived using both ratios of R,EFSDOF/R,ssi and C,ssi/C,EFSDOF, which are
5 . 1 1 5 . 1 9 . 0 1 6 . 0 1 c 5 . 1 9 . 0 4 . 0 c 4 . 0 1 4 . 0 1 c g g g g g g T T T T T T T T T T T T
c
0.12ln0.3 (16)(a)
0 0.5 1 1.5 2 2.5 3
0.9 1 1.1 1.2 1.3
ssi=11%
ssi=20%
=5 Mean
Tssi /Tg
(b)
0 0.5 1 1.5 2 2.5 3
0.9 1 1.1 1.2 1.3
Mean for =2 Mean for =3 Mean for =4 Mean for =5
Mean of all R data
Mean of all C data
proposed
Tssi /Tg
0 0.5 1 1.5 2 2.5 3
0.9 1 1.1 1.2 =5 =4 =3 =2 (c)
Tssi /Tg
=15%
0 0.5 1 1.5 2 2.5 3
0.9 1 1.1 1.2 =5 =4 =3 =2 (d)
Tssi /Tg
[image:13.595.88.504.72.509.2]=20%
Fig. 9. (a)-(b) Correction factor obtained from response-history analyses, and (c)-(d) proposed analytical values of as a function of period of vibration, effective ductility ratio and effective damping ratio of an SSI system
R
(a)
0 0.5 1 1.5 2 2.5 3
0 2 4 6 8
=4
=2
=5
=3 Modified EFSDOF=15%
a0=3 s=1.48 a0=3 s=1.8 g=10%
Tssi /Tg
R
(b)
0 0.5 1 1.5 2 2.5 3
0 2 4 6 8
=4
=2
=5
=3
a0=3 s=1.2 a0=2.5 s=1 Modified EFSDOF=20%
Tssi /Tg
0 0.5 1 1.5 2 2.5 3
0 1 2 3 4
C
Tssi /Tg (c)
Modified EFSDOF=15% a0=3 s=1.48 a0=3 s=1.8 g=10%
=2
=5
0 0.5 1 1.5 2 2.5 3
0 1 2 3 4
C
Tssi /Tg (d)
a0=3 s=1.2 a0=2.5 s=1
Modified EFSDOF=20%
=2
[image:14.595.85.498.73.378.2]=5
Fig. 10. Improved performance of the modified EFSDOF oscillators
8. Structural and global ductility ratios
Although the global ductility ssi relates the displacement demand of an inelastic SSI system to its yielding
displacement, the structural ductility s is sometimes more important since it directly reflects the expected
damage in a structure. By using the global ductility ssi, the structural ductility ratio s can be calculated
according to Eq. (14). In order to evaluate the effectiveness of this equation, the actual structural ductility ratios s obtained by response-history analysis using the SSI model (points) are compared with those calculated using
Eq. (14) (lines) in Fig. 11. The presented results are the averaged values for the 20 records (Table 1) considering four global ductility values ssi= 2, 3, 4, and 5; the shaded areas illustrate the practical range of the design
structural ductility demands s.
In general, Fig. 11 shows good agreement between Eq. (14) and the results of response-history analyses, especially for lightly-damped SSI systems with equivalent natural periods close to those of their fixed-base systems (e.g. Fig. 11(a)). For highly nonlinear structures, on the other hand, using Eq. (14) leads to an overestimation of s. This is particularly obvious for systems with a higher period lengthening effect, as shown
in Figs. 11 (b), (c) and (e). However, it may not be important for common buildings that are usually designed for a structural ductility ratio of less than 8. Note that for a given global ductility ratio, the period lengthening effect is greater for structures with a higher structural ductility ratio (see Eq. (14)). The results illustrated in Fig. 11 generally demonstrate very good agreement between structural ductility ratios s obtained from the
Tssi /Tg (a)
s
0 1 2 3
0 2 4 6
ssi=5
ssi=2
a0s2ssi=5%
Tssi /Tg
s
0 1 2 3
0 5 10 15
ssi=5
ssi=2
(b)
a03s4ssi=5%
Tssi /Tg
s
(c) 0 1 2 3
0 5 10 15
ssi=5
ssi=2
a03s2ssi=10%
Tssi /Tg
s
0 1 2 3
0 3 6 9
ssi=5
ssi=2
(d)
a02s2g=10% ssi=10%
s
(e)
Tssi /Tg
ssi=5
ssi=2
0 1 2 3
0 5 10 15
a03s.48ssi=15%
s
Tssi /Tg
0 1 2 3
0 3 6 9 12
ssi=5
ssi=2
(f)
a02.5sssi=20%
[image:15.595.91.494.75.551.2]Actual Predicted Practical range of s
Fig. 11. Structural ductility ratios s: response-history analysis using SSI model (points) versus results using
Eq. (14) (lines)
9. Discussion
(using R) or displacement-based (using C) design for SSI systems. The effects of near-fault directivity, the structural hysteretic model, and higher modes were not considered in this study and require further evaluation.
10. Conclusions
Around 200,000 response-history analyses were carried out using fixed-base and soil-structure interaction models to study the elastic and inelastic response spectra of buildings on soft soil profiles. Based on results for 20 ground motions recorded on very soft soil deposits, it was shown that normalizing the equivalent period of an SSI system Tssi by the corresponding predominant period resulted in more rational spectra for seismic design
purposes. In the elastic response spectra, Tssi is normalized by the spectral predominant period TP
corresponding to the peak ordinate of a 5% damped elastic acceleration spectrum, while for nonlinear structures Tssi should be normalized by the predominant period of the ground motion Tg at which the relative velocity
spectrum reaches its maximum value.
It was shown that an actual SSI system could be replaced by an equivalent fixed-base oscillator having a natural period of Tssi, a viscous damping ratio of ssi, and a ductility ratio of ssi. It was concluded that the absolute
acceleration spectra, instead of the pseudo-acceleration spectra, should be used for EFSDOF oscillators in force-based design of SSI systems. The EFSDOF oscillator approach provided an excellent estimate of acceleration and inelastic spectra for lightly-to-moderately damped SSI systems. However, it was shown that the EFSDOF oscillators, in general, overestimate the constant-ductility strength reduction factor R of SSI systems with high initial damping ratio (e.g. squatty structures founded on very soft soil profiles), which consequently leads to an underestimation of inelastic displacement ratio C. Based on the results of this study, a correction factor was proposed to improve the efficiency of the EFSDOF oscillators to predict the R and C spectra of SSI systems having initial effective damping ratios greater than 10%.
Finally, it was demonstrated that for any ground motion, the structural ductility demand of a nonlinear flexible-base structure can be calculated, with good accuracy, from the global ductility demand of the whole SSI system. The improved EFSDOF oscillator can thus be easily implemented in the performance-based design of structures on soft soil with a target ductility ratio which is defined either for an SSI system or for the structure alone.
References
[1] ASCE/SEI 7-16, Minimum Design Loads and Associated Criteria for Buildings and Other Structures, American Society of Civil Engineers, Reston, Virginia, 2017.
[2] ASCE/SEI 41-17, Seismic Evaluation and Retrofit of Existing Buildings, American Society of Civil Engineers, Reston, Virginia, 2017.
[3] CEN, Eurocode 8: Design of structures for earthquake resistance. Part 5: Foundations, retaining structures and geotechnical aspects. EN 1998-5:2004, Comité Européen de Normalisation, Brussels, Belgium, 2004.
[4] FEMA 440, Improvement of Nonlinear Static Seismic Analysis Procedures, Applied Technology Council, Washington DC, 2005.
[5] J. Ruiz-García, E. Miranda, Inelastic displacement ratios for evaluation of structures built on soft soil sites, Earthq. Eng. Struct. Dyn. 35 (2006) 679–694.
[6] T. Vidic, P. Fajfar, M. Fischinger, Consistent inelastic design spectra: Strength and displacement, Earthq. Eng. Struct. Dyn. 23 (1994) 507–521.
[7] A. Ziotopoulou, G. Gazetas, Are current design spectra sufficient for soil-structure systems on soft soils?, in: Adv. Performance-Based Earthq. Eng., Springer, 2010: pp. 79–87.
[8] E.M. Rathje, N.A. Abrahamson, J.D. Bray, Simplified frequency content estimates of earthquake ground motions, J. Geotech. Geoenvironmental Eng. 124 (1998) 150–159.
[9] G. Mylonakis, G. Gazetas, Seismic soil-structure interaction: Beneficial or detrimental?, J. Earthq. Eng. 4 (2000) 277–301.
[10] L. Xu, L. Xie, Bi-normalized response spectral characteristics of the 1999 Chi-Chi earthquake, Earthq. Eng. Eng. Vib. 3 (2004) 147–155.
[12] E. Miranda, J. Ruiz-García, Evaluation of approximate methods to estimate maximum inelastic displacement demands, Earthq. Eng. Struct. Dyn. 31 (2002) 539–560.
[13] M.A. Ghannad, H. Jahankhah, Site-dependent strength reduction factors for soil-structure systems, Soil Dyn. Earthq. Eng. 27 (2007) 99–110.
[14] F. Khoshnoudian, E. Ahmadi, F.A. Nik, Inelastic displacement ratios for soil-structure systems, Eng. Struct. 57 (2013) 453–464.
[15] F. Khoshnoudian, E. Ahmadi, S. Sohrabi, Response of nonlinear soil-MDOF structure systems subjected to distinct frequency-content components of near-fault ground motions, Earthq. Eng. Struct. Dyn. 13 (2013) 1809–1833.
[16] F. Khoshnoudian, E. Ahmadi, Effects of pulse period of near-field ground motions on the seismic demands of soil-MDOF structure systems using mathematical pulse models, Earthq. Eng. Struct. Dyn. 42 (2013) 1565–1582.
[17] F. Khoshnoudian, E. Ahmadi, Effects of inertial soil-structure interaction on inelastic displacement ratios of SDOF oscillators subjected to pulse-like ground motions, Bull. Earthq. Eng. 13 (2014) 1809–1833.
[18] M. Mekki, S.M. Elachachi, D. Breysse, D. Nedjar, M. Zoutat, Soil-structure interaction effects on RC structures within a performance-based earthquake engineering framework, Eur. J. Environ. Civ. Eng. 18 (2014) 945–962.
[19] M. Moghaddasi, G.A. MacRae, J.G. Chase, M. Cubrinovski, S. Pampanin, Seismic design of yielding structures on flexible foundations, Earthq. Eng. Struct. Dyn. (2015).
[20] E.E. Seylabi, H. Jahankhah, M. Ali Ghannad, Equivalent linearization of non-linear soil-structure systems, Earthq. Eng. Struct. Dyn. 41 (2012) 1775–1792.
[21] A.K. Chopra, R.K. Goel, Direct displacement-based design: use of inelastic vs. elastic design spectra, Earthq. Spectra. 17 (2001) 47–64.
[22] P. Fajfar, Capacity spectrum method based on inelastic demand spectra, Earthq. Eng. Struct. Dyn. 28 (1999) 979–993.
[23] G. Ehlers, The effect of soil flexibility on vibrating systems, Bet. Und Eisen. 41 (1942) 197–203. [24] J.W. Meek, J.P. Wolf, Cone Models for Homogeneous Soil. I, J. Geotech. Eng. 118 (1992) 667–685. [25] J.P. Wolf, A.J. Deeks, Foundation Vibration Analysis: A Strength of Materials Approach, 2004. [26] The Mathworks Inc., MATLAB - MathWorks, Www.mathworks.com/products/matlab. (2016). [27] A.S. Veletsos, B. Verbič, Vibration of viscoelastic foundations, Earthq. Eng. Struct. Dyn. 2 (1973)
87–102.
[28] Y. Lu, I. Hajirasouliha, A.M. Marshall, Performance-based seismic design of flexible-base multi-storey buildings considering soil-structure interaction, Eng. Struct. 108 (2016) 90–103.
[29] J. Avilés, L.E. Pérez-Rocha, Influence of Foundation Flexibility on R[sub μ] and C[sub μ] Factors, J. Struct. Eng. 131 (2005) 221–230.
[30] J. Avilés, M. Suárez, Effective periods and dampings of building-foundation systems including seismic wave effects, Eng. Struct. 24 (2002) 553–562.
[31] A.S. Veletsos, V. V Nair, Seismic interaction of structures on hysteretic foundations, J. Struct. Div. 101 (1975) 109–129.
[32] A. Maravas, G. Mylonakis, D.L. Karabalis, Simplified discrete systems for dynamic analysis of structures on footings and piles, Soil Dyn. Earthq. Eng. 61 (2014) 29–39.
[33] J. Avilés, L.E. Pérez-Rocha, Soil-structure interaction in yielding systems, Earthq. Eng. Struct. Dyn. 32 (2003) 1749–1771.
[34] M.A. Ghannad, A.H. Jafarieh, Inelastic displacement ratios for soil–structure systems allowed to uplift, Earthq. Eng. Struct. Dyn. 43 (2014) 1401–1421.
[35] A.K. Chopra, Dynamics of Structures, Pearson Education, 2012.
[36] Y.Y. Lin, K.C. Chang, Study on Damping Reduction Factor for Buildings under Earthquake Ground Motions, J. Struct. Eng. 129 (2003) 206–214.
[37] E. Miranda, J. Ruiz-García, Influence of stiffness degradation on strength demands of structures built on soft soil sites, Eng. Struct. 24 (2002) 1271–1281.
Appendix
The equation of motion of an SSI system subjected to a ground acceleration time-history üg(t) can be expressed in the following matrix form:
For nonlinear structures, the term “[M]{u(t)}” is replaced with restoring forces “{F(t)}”. In the frequency domain where the system is subjected to a harmonic motion having a frequency w and an amplitude Üg, Eq. (A1) can be written as:
w M iwC K
U
w
M
RUg w2 (A2)
where i is the imaginary unit satisfying i2=-1.
For the cone model shown in Fig. 1, the mass, damping coefficient, and stiffness matrices are given by:
0 0 0 0 0 / / Sym. / / 0 0 / 0 0 0 w w w w w g g g g f s g h f s c M c c c M J J c m mM (A3)
w
w c c k h c c h c k c c h c c c C g s s s s g h s h s s s s Sym. / 2 0 / 2 0 0 2
0 (A4)
0 Sym. 0 0 0 2 k h k h k k k h k k k K s s s s s h s s s s (A5)where the frequency w0 equals w and wssi in the frequency and time domains, respectively. The displacements
and influence coefficients are defined as:
T
Th
ssi u R
u
u [ , ,
,
] , [1,1,0,0] (A6) where uh is the foundation swaying displacement, and the displacement of the structural mass relative to theground ussi= uh+hs+us, with reference to Fig. A1.
For the impedance model depicted in Fig. A1(a):
f s f s J J m m M Sym. 0 0 0 (A7)
s s s s s s h h s s s s s v rk h c h c v rk c h c c c C / Sym. / 2
(A8)
k h k h k k k h k k k K s s s s h h s s s s s 2 Sym. (A9)where closed-form expressions for h, , h and were proposed by Veletsos and Verbic [27] as
frequency-dependent dynamic modifiers to the foundation swaying and rocking stiffness. These dynamic modifiers are also functions of the soil Poisson’s ratio and hysteretic soil damping ratio g.
T
Th
ssi
u
R
u
u
h
h
su
su
g
h
sm
s, J
sm
f, J
fk
sk
hk
u
ssiu
gu
sdof(a)
(b)
k
sdof [image:19.595.153.432.73.211.2]m
sFig. A1. (a) SSI impedance model; and (b) equivalent fixed-base SDOF (EFSDOF) oscillator
Unlike the pseudo-acceleration spectra for design of fixed-base buildings with external energy dissipation systems, the absolute acceleration spectra for EFSDOF oscillators should be used for flexible-base structures. This point can be addressed by comparing the equations of motion for the structural mass in both the SSI system and the EFSDOF oscillator shown in Fig. A1:
u
ssi
u
g
2
w
s
su
s
w
s2u
s
0
(A11)
u
sdof
u
g
2
w
n
u
sdof
w
n2u
sdof
0
(A12) where the elastic dynamic properties of the EFSDOF oscillator are characterized by its circular frequency of vibration ωn=√ksdof/ms and a viscous damping ratio of . Provided that usdof of the EFSDOF oscillator is anaccurate estimation of ussi of the SSI system, the absolute acceleration of the EFSDOF oscillator
g sdof u u equals that of the SSI system
g ssi u u
. Due to a low structural damping ratio of s=5%, the base shear demand
of the flexible-base structure can be calculated using either the pseudo-acceleration
ω
2su
s,maxor the absolute acceleration
g ssi u u
max which equals the spectral absolute acceleration of the EFSDOF oscillator
usdof ug
max . If, however, the spectral pseudo-acceleration of the EFSDOF oscillator sdof,max 2
n
u
ω
is used, the design base shear may be underestimated, due to high damping effects =ssi >>5%.For the SDOF oscillator illustrated in Fig. A1(b), Eqs. (A1) and (A2) reduce to the corresponding single equation of motion. The resonant response of this SDOF oscillator subjected to the harmonic motions Üg(ω) satisfies the following expressions [43]:
2 2
2
2 1 ,
1 2
1
w w w
res
n g
res n
U U
(A13) where Ures is the resonant amplitude of the displacement usdof.
Similarly, it may be assumed that Eq. (A13) also holds for the SSI systems shown in Figs. 1 and A1(a), whereby wssi, ssi, and ussi correspond, respectively, to wn, , and usdof of the SDOF oscillator. With this assumption, the
equivalent natural frequency wssi and the effective damping ratio ssi can be solved by Eq. (A13) at the resonant