Galaxy Zoo: secular evolution of barred galaxies from structural
decomposition of multiband images
Sandor J. Kruk,
1‹Chris J. Lintott,
1Steven P. Bamford,
2Karen L. Masters,
3Brooke D. Simmons,
1,4†
Boris H¨außler,
5Carolin N. Cardamone,
6Ross E. Hart,
2Lee Kelvin,
7Kevin Schawinski,
8Rebecca J. Smethurst
1,2and Marina Vika
9‡
1Oxford Astrophysics, Department of Physics, University of Oxford, Denys Wilkinson Building, Keble Road, Oxford OX1 3RH, UK 2School of Physics and Astronomy, The University of Nottingham, University Park, Nottingham NG7 2RD, UK
3Institute of Cosmology and Gravitation, University of Portsmouth, Dennis Sciama Building, Barnaby Road, Portsmouth PO1 3FX, UK 4Center for Astrophysics and Space Sciences (CASS), Department of Physics, University of California, San Diego, CA 92093, USA 5ESO – European Southern Observatory, Alonso de Cordova 3107, Vitacura, Casilla 19001, Santiago, Chile
6Math and Science Department, Wheelock College, 200 The Riverway, Boston, MA 02215, USA
7Astrophysics Research Institute, Liverpool John Moores University, IC2, Liverpool Science Park, 146 Brownlow Hill, Liverpool L3 5RF, UK 8Institute for Astronomy, Department of Physics, ETH Z¨urich, Wolfgang-Pauli Strasse 27, CH-8093 Z¨urich, Switzerland
9Institute for Astronomy, Astrophysics, Space Applications and Remote Sensing, National Observatory of Athens, Penteli, 15236 Athens, Greece
Accepted 2017 October 4. Received 2017 October 3; in original form 2017 August 7
A B S T R A C T
We present the results of two-component (disc+bar) and three-component (disc+bar+bulge) multiwavelength 2D photometric decompositions of barred galaxies in five Sloan Digital Sky Survey (SDSS) bands (ugriz). This sample of∼3500 nearby (z<0.06) galaxies with strong bars selected from the Galaxy Zoo citizen science project is the largest sample of barred galaxies to be studied using photometric decompositions that include a bar component. With detailed structural analysis, we obtain physical quantities such as the bar- and bulge-to-total luminosity ratios, effective radii, S´ersic indices and colours of the individual components. We observe a clear difference in the colours of the components, the discs being bluer than the bars and bulges. An overwhelming fraction of bulge components have S´ersic indices consistent with being pseudo-bulges. By comparing the barred galaxies with a mass-matched and volume-limited sample of unbarred galaxies, we examine the connection between the presence of a large-scale galactic bar and the properties of discs and bulges. We find that the discs of unbarred galaxies are significantly bluer compared to the discs of barred galaxies, while there is no significant difference in the colours of the bulges. We find possible evidence of secular evolution via bars that leads to the build-up of pseudo-bulges and to the quenching of star formation in the discs. We identify a subsample of unbarred galaxies with an inner lens/oval and find that their properties are similar to barred galaxies, consistent with an evolutionary scenario in which bars dissolve into lenses. This scenario deserves further investigation through both theoretical and observational work.
Key words: galaxies: bulges – galaxies: evolution – galaxies: general – galaxies: star forma-tion – galaxies: stellar content – galaxies: structure.
1 I N T R O D U C T I O N
Galactic bars have been known to exist ever since the discovery of the first galaxies, and their abundance in the local Universe led
E-mail:[email protected]
†Einstein Fellow.
‡This investigation has been made possible by the participation of over 350 000 users in the Galaxy Zoo project. Their contributions are acknowledged athttp://authors.galaxyzoo.org.
Edwin Hubble to dedicate a major part of his classification scheme to barred spiral galaxies (Hubble1936). Observational studies con-firmed that stellar bars are common in disc components, with a frac-tion of 30 per cent showing bars at optical wavelengths (Sellwood & Wilkinson1993; Masters et al.2011), rising to 70 per cent in the infrared, if weaker bars are included (Sheth et al.2008).
Athanassoula, Machado & Rodionov (2013) who found that the gas fraction of a galaxy plays a major role in the formation and evolution of a bar: large-scale bars are harder to form in gas-rich discs than in gas-poor ones. In an earlier study, Athanassoula & Misiriotis (2002) also found that bars can redistribute the angular momentum in the interstellar medium and are efficient at funnelling gas to the centre of the galaxy. This can cause an increase in central star formation (Hawarden et al.1986) and can lead to the formation of so-called pseudo-bulges (Kormendy & Kennicutt2004) that have properties (such as ordered stellar orbits) similar to disc galaxies, rather than ellipticals. The gas that falls in the central parts of the galaxy might trigger AGN (e.g. Noguchi1988; Wada & Habe1992); different au-thors have investigated if the presence of an AGN is correlated with the presence of a bar, finding contradictory answers (e.g. Galloway et al.2015; Cheung et al.2015a; Cisternas et al.2015; Goulding et al.2017). This is not surprising given that time-scales vary con-siderably for bar-driven motions (∼Gyr, Athanassoula2000) and AGN activity (∼Myr, Hickox et al.2014).
Recent observational studies involving large samples show that the fraction of disc galaxies that have a bar increases with redder, gas-poor galaxies (Masters et al.2012), with over half of the red disc galaxies being barred (see fig. 3 in Masters et al.2011). Using a similarly large sample of barred galaxies, Cheung et al. (2013) find that the likelihood of a galaxy hosting a bar is anticorrelated with the specific star formation rate, regardless of stellar mass or bulge prominence. They suggest that the observed trends are driven by the gas fraction in the discs, pointing towards a scenario in which the secular evolution of barred galaxies is driven by bars.
Nevertheless, the role of bars in quenching the star formation, making a disc galaxy become ‘red and dead’ and the details of this process are still unclear. To investigate these, one has to study the stellar populations of the individual components (bars, discs and bulges) separately, in detail. One way to achieve this is with integral field spectroscopy (IFS), whereby spectra of various parts of galax-ies are obtained simultaneously. However, until now there have been few IFS studies to observationally characterize the influence of bars on nearby galaxies, and they were limited to small samples (e.g. BaLROG – Bars in Low-Redshift Optical Galaxies with SAURON IFS, Seidel et al.2015; NGC 4371 with MUSE, Gadotti et al.2015). Only with the advent of large IFS surveys such as CALIFA (S´anchez et al.2012), SAMI (Croom et al.2012), MaNGA (SDSS Collabo-ration et al.2016), it is now becoming possible to study the internal stellar populations for large samples.
The alternative is to study the stellar populations of bars, discs and bulges by photometric decomposition of galaxy images (Byun & Freeman 1995), which can be applied simultaneously to a large sample of galaxies. Many authors have applied 2D de-composition methods to separate discs and bulges (e.g. using GIM2D– Allen et al. 2006;GASP2D – M´endez-Abreu et al.2008;
BUDDA– Gadotti2009). The largest two-band image bulge+disc de-composition, of over a million galaxies in Sloan Digital Sky Survey (SDSS), was carried out by Simard et al. (2011). However, simple bulge+disc decompositions can give inaccurate fits when applied to strongly barred galaxies, with the bar flux being erroneously as-signed primarily to the bulge, as shown by Laurikainen, Salo & Buta (2005). Using detailed decompositions of 15 barred galaxies, Laurikainen et al. (2006) showed that the bulge-to-total luminosity ratios can be significantly overestimated when only the discs and bulges are accounted for.
Laurikainen et al. (2007) decomposed 216 nearby disc galaxies in detail, including bars, and found strong evidence for pseudo-bulges across all Hubble types. Reese et al. (2007) also attempted
to decompose the light of 68 disc galaxies into discs, bulges and bar components. Weinzirl et al. (2009) decomposed 143 brightH-band galaxies,∼80 including a bar component, and studied the correla-tions between bulges of barred and unbarred galaxies concluding that bulges are likely to have been built by a combination of secu-lar processes and minor mergers in the recent Universe. Using the BUDDAsoftware (de Souza et al.2004), Gadotti (2009) performed disc+bulge+bar decomposition in three bands (g,randi) on a sam-ple of 291 barred galaxies from SDSS and studied their properties in Gadotti (2011). More recently, Salo et al. (2015) decomposed 2352 nearby (<40 Mpc) galaxies from the S4G survey (out of which ∼800 included a bar component; Sheth et al.2010), while Kim et al. (2015) fitted 144 face-on barred galaxies from S4G with a bar component.
The aim of this paper is to get meaningful physical parame-ters for the bulges, discs and bars of the largest sample of barred galaxies to date (∼3500) and compare them with unbarred galaxies using the most complete multiwavelength data for nearby galaxies from the SDSS. The bulge-to-total (B/T), bar-to-total (Bar/T) lu-minosity ratios, component colours and S´ersic indices are analysed with the aim of understanding the effect of bars on the evolution of barred galaxies. The fits from this paper have already been used to identify a sample of 271 galaxies with an off-centre bar and study their properties (Kruk et al.2017).
The paper is structured as follows. In Section 2, we discuss the sample selection and identification of barred galaxies, and also de-scribe the method used in the multiwavelength 2D photometric decomposition. In Section 3, we present the main results on the properties of barred galaxies, while in Section 4, we compare the properties of mass-matched volume-limited samples of barred and unbarred galaxies. In Section 5, we consider the properties of non-barred galaxies with inner lenses. Finally, in Section 6, we discuss our findings in the context of secular evolution of barred galaxies. Throughout the paper, we adopt the WMAP Seven-Year Cosmo-logical parameters (Jarosik et al.2011) with (M,,h)=(0.27,
0.73, 0.71).
2 DATA A N D M E T H O D S
2.1 Galaxy Zoo and SDSS
All the galaxies used in the study are drawn from the Sloan Digital Sky Survey (SDSS) (Gunn et al.1998; York et al.2000; Eisenstein et al.2011) DR7 (Abazajian et al.2009). Morphological classifi-cation of galaxies are taken from the Galaxy Zoo 21project (GZ2) (Lintott et al.2008; Willett et al.2013) that asked citizen scien-tists to provide detailed information about the visual appearance of galaxies. Each galaxy was inspected by at least 17 volunteers and the mean number of classification per galaxy is∼42.
From the subset of 240 419 galaxies classified in GZ22 that have stellar masses available from the MPA-JHU catalogue (Kauffmann et al.2003a), available inclinations and measured spec-troscopic redshifts, we have selected all the galaxies with redshifts 0.005<z<0.06. This redshift range provides reliable GZ2 morpho-logical classifications and suitable SDSS image resolution. Identi-fying bars in highly inclined galaxies is challenging; thus, we se-lected only galaxies with an axis ratio ofb/a>0.5, given by the
1http://zoo2.galaxyzoo.org
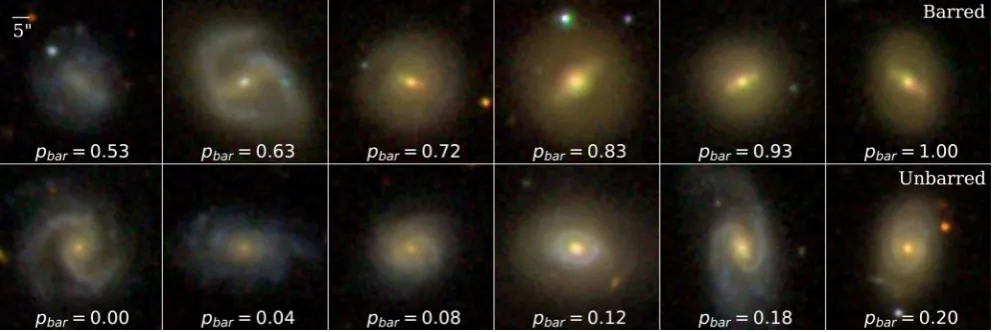
Figure 1. Examples of barred and unbarred galaxies in the volume-limited samples used in our study. Thepbarshows the Galaxy Zoo debiased likelihood of
a disc galaxy being barred, based on the volunteers’ inspection and classifications. The galaxies were randomly selected, approximately equally spaced inpbar
values.
exponential model fits in SDSS (Stoughton et al.2002), correspond-ing to inclinationsi60◦.
In order to reach the bar question, a user must first classify a galaxy as a non-edge-on galaxy with a disc or features. Following Masters et al. (2011) and the recommendation of Willett et al. (2013), we only selected galaxies for which there were at least 10 answers to the question ‘Is there a sign of a bar feature through the centre of the galaxy?’. To quantify the likelihood that a galaxy is barred, GZ2 calculates the ratio of the number of volunteers who identified a galaxy being barred and the total number of votes to the bar question. These raw likelihoods are then adjusted to account for the inconsistency of users, as well as for the deterioration of image quality with redshift, as detailed in Willett et al. (2013). Finally, we are left with a debiased bar likelihood, denoted aspbar, which will be used throughout this paper. A galaxy was classified as being barred if the number of volunteers identifying it as having a bar is larger than, or equal to the number identifying it as not having a bar, i.e. pbar≥0.5. Furthermore, to avoid problems with the deblending of galaxy images we exclude merging or overlapping galaxies, which according to Darg et al. (2010), can be achieved with a cut of the GZ1 (Lintott et al.2011) merging parameterpmerger<0.4. All galaxies in GZ2, considered in this study, are included in GZ1 and, although using a different classification tree,pmergerparameter has a strong correlation with the projected galaxy separation (Casteels et al.2013). Our final, large sample of barred galaxies contains 5282 galaxies, with a mean number of users who answered the bar question of 22.
The bars detected by GZ volunteers agree well with expert classi-fications made by Nair & Abraham (2010a). Using a sample size of 14 000 galaxies and with an overlap of 90 per cent with GZ2, Nair & Abraham (2010a) detected a bar fraction of∼30 per cent (Nair & Abraham2010b) and classified the bars according to their strength as strong, intermediate or weak, depending on their sizes relative to the sizes of the discs and on the bars’ prominence. Nevertheless, their classification corresponds to subclasses of the strong bar clas-sification in RC3 (de Vaucouleurs et al.1991), as Nair & Abraham (2010a) point out. Comparing the sample of barred galaxies in GZ2 and the one in Nair & Abraham (2010a), GZ tends to identify strong and intermediate bars with the thresholdpbar≥0.5 and weak bars with 0.2<pbar<0.5, as discussed in Skibba et al. (2012) and Mas-ters et al. (2012) and shown in fig. 10 of Willett et al. (2013). Masters et al. (2012) also show in their appendix A that Galaxy Zoo detects
90 per cent of the strong and intermediate bars withpbar≥0.5, while 92 per cent of their unbarred galaxies havepbar<0.5, suggesting thatpbar≥0.5 is adequate for selecting a clean sample of strong and intermediate bars. This cut has been adopted by several other Galaxy Zoo studies of barred galaxies (Masters et al.2011,2012; Melvin et al.2014; Cheung et al.2015a,b). A further discussion regarding the implications of including the weak bars in this study can be found in the Appendix.
The main GZ2 spectroscopic sample contains only SDSS galax-ies brighter thanr<17 (Willett et al.2013). Therefore, to study the statistical distribution and properties of these systems, we se-lected a volume-limited sample of barred galaxies brighter than Mr <−20.15, which is ther-band Petrosian absolute magnitude corresponding to the GZ2 completeness magnitude of 17, at a red-shift ofz =0.06. To construct a comparison sample of galaxies without bars, we have used a similar criteria (same cut for inclina-tion and at least 10 answers to the quesinclina-tion ‘Is there a sign of a bar feature through the centre of the galaxy?’) in order to select disc galaxies, but withpbar<0.2, in this case, to select a volume-limited sample of unbarred galaxies between 0.005<z<0.06 and brighter thanMr<−20.15. There are 3547 and 8689 galaxies in theVOLUME -LIMITED BARREDandVOLUME-LIMITED UNBARREDsamples, respectively. Examples of barred and unbarred galaxies in the volume-limited samples can be seen in Fig.1. The larger number of unbarred galax-ies allows us to select a subsample of unbarred galaxgalax-ies with a mass distribution matching the one of barred galaxies, which is described further in Section 4. Eliminating the mass-dependence (Kauffmann et al.2003b) enables us to study secondary effects due to the pres-ence of bars. The selection criteria and sample sizes are summarized in Table1.
2.2 Galaxy image decomposition
A key observable is the spatial distribution of light in a galaxy, which can be measured using parametric functions such as the S´ersic profile. The generalized S´ersic profile can be expressed as an intensity profile, such that (Sersic1968)
I(r)=Ieexp
−bn
r re
1
n
−1
Table 1. Selection criteria and sample size.
Description Criterion No.
GZ2 all GZ2a 243 500
MPA-JHU catalogue match 240 419
Nearby 0.005<z<0.06 81 736
Face-on i<60◦ 52 851
Discs Nbar≥10 24 478
Non-interacting pmerger<0.4 23 388
Barred discs pbar≥0.5 5282
Volume-limited barred sample Mr<−20.15 3547
Unbarred discsb pbar≤0.2 12 573
Volume-limited unbarred sample Mr<−20.15 8689
Notes.aWith spectroscopic redshifts.
bThe unbarred disc selection also follows the first six criteria.
whereIeis the intensity at the effective radiusrethat encloses half of the total light from the model.bnis a constant depending on the
model chosen and the S´ersic indexndescribes the shape of the light profile. For a de Vaucouleurs profilen=4, while for an exponential profilen=1.
In this paper, we use a modified version of GALFIT3.0 (Peng et al.2010) calledGALFITM3developed by the MegaMorph project (Bamford et al. 2011; H¨außler et al. 2013; Vika et al. 2013) to perform automatic 2D disc+bar+bulge, disc+bar and disc+bulge decompositions. In contrast toGALFITthat can fit only one band at a time,GALFITMmakes use of the full wavelength coverage of surveys (H¨außler et al.2013). It enables fitting across multiple wavelengths to increase the accuracy of the measured parameters, as well as improving magnitudes and effective radii estimation in low S/N bands, by constraining the parameters to Chebyshev polynomials as a function of wavelength. Since the aim of this study is to ex-tract as much physical information for each galaxy component as possible across the optical spectrum, it is the ideal software to use.
2.3 Images
In this study, we use publicly available FITS images from SDSS DR10 (Ahn et al.2014) in five bands:u, g, r, iandz. For the galaxy images, we use the corrected and background-subtracted SDSS fields4in which the galaxy appears. To deal with galaxies that are at the edges of fields, we combine the frames into a single mosaic using MONTAGE(Jacob et al.2010).MONTAGEcombines different fields into a single image by performing the required rebinning, reprojections and background transformations. We created cutouts of the galaxies with a square with a side length of eight times ther-band Petrosian radius of the galaxy, as given by SDSS.
In SDSS-III, all the fluxes are expressed in terms of nanomaggies, which is a linear unit of flux. In order for GALFITM to create a good
σ image, we converted the images to electron counts by using an average of thenanomaggies per countfactors in theFITSheaders of all the frames, assuming an average gain for each band across the whole survey and an exposure time of 53.91 s to calculate the zero-point magnitudes.
GALFITM requires a point spread function (PSF) to correct the images for seeing effects, especially in the central regions of the galaxies. We constructed a PSF for each galaxy, in each band, at the position of the galaxy using the corresponding SDSS
3G
ALFITM is publicly available at http://www.nottingham.ac.uk/
astronomy/megamorph/.
4Fromhttp://data.sdss3.org/fields.
psFields5frames. The estimation of the background level is also important for a successful fit (H¨aussler et al. 2007). The SDSS pipeline sky subtraction is inevitably imperfect; therefore, we used concentric elliptical annuli around the galaxy to extract the back-ground value at the point where the surface brightness gradient is flat, as further detailed in Barden et al. (2012), and we kept the sky value fixed throughout the fitting process. Finally, usingSEXTRACTOR (Bertin & Arnouts1996) segmentation maps we created a mask for each galaxy field in therband by masking out all the bright sources (stars and galaxies), except the target. The same mask was used for all the five bands in the fitting process. We remind the reader that interacting or overlapping galaxies were excluded in this study, thus the galaxies should not have many bright close neighbours.
2.4 Model
GALFITM can fit a wavelength-dependent model with multiple components to images in different bands. It uses the Levenberg-Marquardt algorithm to minimize theχ2residual between an image and the PSF-convolved model, by changing the free parameters. The
χ2is calculated using a weighted sigma (σ) map created internally by GALFITM.
GALFITM fits all the five bands simultaneously and the user has the choice of varying all the parameters between the bands or fixing some of them. The reasons for fitting the bands simultaneously are (1) to increase the overall signal-to-noise ratio (S/N), (2) to use the colour differences between the components to help the decompo-sition and (3) to measure consistent colours for each component. In the fitting procedure, we constrain some of the parameters such as the centre (xc,yc), the effective radius (re), the S´ersic index (n),
the axis ratio (b/a) and the position angle (θ) of each component to be the same in all five bands. The only parameter that was allowed to vary freely, independent of wavelength, was the magnitude. This approximation ignores colour and, hence stellar population gradi-ents within the independent models of each component, which is a simplified picture of galaxy structure. Nevertheless, McDonald et al. (2011) have shown that there is no significant variation of the S´ersic index of the bulge and the effective radii of the disc and bulge with wavelength. We also test for the variations of the fitted parameters in Section 2.6.1.
To fit the barred galaxies we used an iterative process, in which we added one component at a time. The process we used for fitting is as follows:
I.One component. First, we fitted a single S´ersic profile for each galaxy, with the purpose of providing initial values for the param-eters for the subsequent fits, as well as to measure the luminosity of the galaxy. As initial estimates for this fit, we usedn=1 and magnitudes,r-band Petrosian radii, ellipticities and position angles from SDSS (Stoughton et al.2002).
II.Two components. We then used the values from the single S´ersic fit as input into a two-component model: an exponential disc and a bar. For the bar component, we used a slightly dimmer initial magnitude, an initial effective radius of 60 per cent that of the disc in the one component fit, an initial S´ersic index ofn=0.7 and axis ratio b/a=0.2, since the bar is an elongated feature, which according to Kormendy & Kennicutt (2004) has an ellipticity between 0.2 and 0.4. We modelled the bar using a free S´ersic model rather than a Ferrers function (Binney & Tremaine1987) as an approximation
of the true bar intensity profile in order to allow more flexibility in the bar profiles due to the mix of late and early-type galaxies in our sample, as well as to avoid the Ferrers function converging to a different component. We set the position angle of the bar to be at 90◦to the disc. We also tried fitting a boxy bar instead of an ellipse, which should be closer to the shape of a real bar; some bars are either boxy or peanut shaped (Bureau & Freeman1999; Athanassoula & Misiriotis2002). We found it almost impossible to automatically fit a boxy S´ersic profile to a highly elliptical component, as the boxiness parameter, was rapidly diverging. Therefore, we decided to use a pure ellipse model for the bar (C0=0 in GALFITM). For the galaxies with a significant bulge present, the second component that was fitted did not appear to be a real bar. The light from the bulge and from the bar were modelled together in one component by GALFITM, yielding a component with a high S´ersic index (68 per cent withn ≥1) and anrelarger than the typicalreof the bulge, but smaller than that of the bar.
III.Three components. Only the galaxies for which the two com-ponents successfully converged were fitted with three comcom-ponents. Based on the parameters from the two-component fit as initial guesses, we added a third component, a bulge, also modelled with a free S´ersic profile. We started with an initial disc having slightly larger (125 per cent)re,discthan thereof the disc in the two compo-nent fit and a bar with anre,barof 50 per cent thereof the disc in the two-component fit. As an initial estimate for the bulge effective radius we used 25 per cent of thereof the second component in step II, while for the initial axis ratio of the bulge, we used a value of b/a=0.8, since the bulge should be a nearly round feature. The initial position angle was initially set to that of the disc. The initial S´ersic index of the bulge was set ton=2, so that it is sufficiently different from the other components. This is also the boundary noted by Fisher & Drory (2008) to distinguish pseudo-bulges from classical bulges.
We also tested adding the components in the order disc-bulge-bar, but since a large fraction of the barred galaxies in our sample lack a significant bulge (as discussed later), we found that the second component often converged to a bar. Therefore, we chose to add the components in the order disc-bar-bulge. For 523 galaxies, the second component in step II converged to a model closer to that of a bulge, as discussed in the following subsection; hence, we added the bar at the third iteration. To reduce the chances of GALFITM converging to an unphysical fit, we provided several constraints: the magnitude was required to be within 6 mag of the input value, the effective radii between 0.5 and 500 pixels and the S´ersic indices smaller than 8. We also required the bar and bulge components to have the same centre, in order to avoid one of the components converging to a clump, or overlapping star. However, the discs and the bar or bar+bulge components were not constrained to have the same centre, they were allowed to vary within 12 arcsec, which is the medianr-band radius containing 90 per cent of the Petrosian flux of the galaxies (rPetro90) in our sample. In Kruk et al. (2017), we discuss the case of the galaxies that have the disc-bar offsets larger than the full width at half-maximum (FWHM) of the PSF, where we categorize them as ‘offset systems’ and discuss their properties in more detail.
The constraints mentioned above are reasonable and useful to guide the fitting process, but occasionally one or more of the fitted parameters converges to a limit imposed by a constraint. In such cases, the resulting fit is probably wrong and it is reasonable to discard it from further analysis. Finally, because in GALFITM the three components can interchange, we identified the disc has being the component with the largest effective radius, the bar being the
elongated component and the bulge the component with the smallest effective radius at the end of step III.
In the case of unbarred galaxies, we used a similar method of fitting two components, a disc and a bulge. For the bulge, we used 10 per cent of the disc component’s effective radius (from step I) as an initial guess, an initial S´ersic index ofn=2 and an initial axis ratio ofb/a= 0.8. The absolute values of the initial bulge re were, on average, similar to the initial guesses in the case of barred galaxies, so the models for barred and unbarred galaxies are consistent.
We stress that the galaxies modelled in this paper are simple representations of galaxy structures, in which the galaxies can be represented by a bulge, bar and an exponential disc. In reality, galaxies are more complex, showing complex structures such as spiral arms and rings. Although fitting all these different features in GALFITM is possible, it would require much more detailed attention for each galaxy, which is beyond the scope of this paper. Our aim was to keep the models relatively simple and uniform over a large range of angular sizes and surface brightness, while also quantifying bar structural parameters for a large sample of barred galaxies. We further discuss the addition of another component for unbarred galaxies, lenses, in Section 5.
2.5 Inspecting the models
The output of GALFITM is aFITSfile with 15 layers (3×5 bands): the image, the model and the residual as seen in the example in Fig.2. GALFITM converged for 4492 of 5282 barred galaxies, or 85 per cent of the initial galaxies. In most of the cases where it failed, GALFITM either failed to converge for one of the parameters6– for example, the bar or bulge axis ratio being too small – or the low S/N made it impossible to extract a magnitude in one of the five bands.
To have a reliable sample of fitted galaxies, we selected only the fits with the following physical constraints: discs, bars and bulges havingre<200 pixels, as all the components of disc galaxies should have effective radii smaller than 1.20 arcmin (corresponding to ∼10 kpc at the lowest redshift of the sample). We also selected only bulges withnbulge<7.8 and axis ratios>0.3 and bars withnbar<7.8 to avoid components converging to a constraint, as discussed in the previous subsection. Finally, one of the authors (SK) visually inspected all the fits and compared the two component (disc+bar) to the three component fit (disc+bar+bulge), by looking at the image, model and residuals. Even though GALFITM returns a goodness-of-fit reducedχ2value,χ2
ν, this is an indicator if one model is favoured
compared to another, but not if the model has a physical meaning. In general, because of the complex morphology of galaxies, adding a further component always decreases theχ2
ν of the model, as the
number of degrees of freedom is increased. In our fits, 98 per cent of theχ2
ν values varied between 1 and 2, with a medianχν2∼1.2.
The models with two or three components need to be inspected to check if they are physically relevant for the galaxy in the images.
For 1246 galaxies, the two component (disc+bar) fit proved to be a better fit (when judged by eye), given the lack of a signif-icant third component (a bulge) in the galaxy images and in the residuals. There were 1692 galaxies with good three component (disc+bar+bulge) fits. For 523 galaxies, the second stage of the fitting process (disc+bar model) converged to a disc+bulge model
6One of the parameters was problematic, marked by *...* in the G ALFITM
Figure 2. Example outputs from GALFITM of a two component (disc+bar) fit (left) and a three component (disc+bar+bulge) fit (right), with anarcsinhstretch.
The first column shows the image in five bands,ugriz, with theuandzbands having lower S/N compared to the rest. The second column shows the model fit from GALFITM with two and three components, respectively. The third column shows the residual (the model subtracted from the image). All panels have the
same scale and their sizes are 40 arcsec×40 arcsec, a zoom-in of the actual fitting regions to show greater detail. The disc, bar and bulgere(in arcsec) andn
are shown at the top of the image, the Bar/T and B/T luminosity ratios are shown at the bottom right of each model. The (g−i) colours for each component, corrected for Galactic extinction are shown at the top of thez-band residual. The reducedχ2
νis also shown.
instead (the axis ratio of the second component wasb/a> 0.6, which is larger than the typical axis ratio of a bar). Since a bar was present in the galaxy images, we refitted these galaxies with three components, adding a bar, with the same initial parameters as in the second step of the fitting procedure. Furthermore, there were 1031 galaxies for which GALFITM converged, but were dis-carded because the models were unphysical and did not represent a suitable disc+bar+bulge nor disc+bar model: in some cases a spiral arm, brighter star formation knot (clump) or overlapping star was fitted instead of one of the components. In other cases, nearby stars or galaxies had not been masked out and one of the components converged to their position, rather than to the galaxy which we tried to fit. Finally, 3461 barred galaxies have meaningful fits out of the initial 5282 (66 per cent), which is a significantly large sample to study the properties of barred galaxies.
The magnitude-redshift distribution of the initial and successfully fitted sample of barred galaxies can be seen in Fig.3. We will refer to the 1246 galaxies with disc and bar components as the DISC -DOMINATEDsample, and to the 2215 galaxies with discs, bars and bulges as the OBVIOUS BULGEsample. We only take the most suitable model for each galaxy (disc+bar or disc+bar+bulge); therefore, the two samples of DISC DOMINATEDand OBVIOUS BULGESdo not overlap. From this large sample of successfully fitted barred galaxies, we
Figure 3. Ther-band Petrosian absolute magnitudes versus redshift of all barred galaxies in our sample and the barred galaxies that were successfully fitted. The curved line corresponds to the GZ2 completeness limit ofr=17 magnitudes, at a particular redshift. The rectangle indicates the limit of our volume-limited barred sample, containing a total of 2435 successfully fitted barred galaxies.
select aVOLUME-LIMITEDsubsample of 2435BARREDgalaxies, brighter thanMr<−20.15.
It is important to note that only 315 out of the 1401 (22 per cent) low-mass barred galaxies (M < 1010.25M
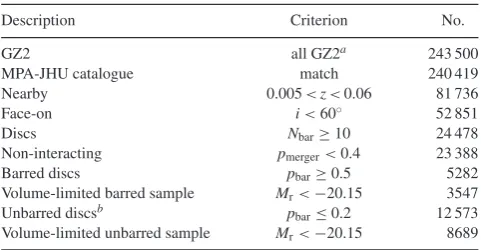
[image:6.595.326.528.482.613.2]Figure 4. We have chosen to fit disc-dominated barred galaxies with two components (disc+bar) and barred galaxies with obvious bulges with three components (disc+bar+bulge), using visual inspection of the fits and residuals. This correlates well with the GZ volunteers classifica-tion of the bulges into NOBULGE, JUST NOTICEABLE, OBVIOUS, DOMINANT. In this plot, we compare our B/T with the volunteers classification which was split into pdisc dominated = pNo Bulge + pJust noticeable and
pobvious bulge=pObvious+pDominant.
component to achieve a good fit. The growth of inner stellar concen-trations (bulges) is thought to occur around the mass of∼1010.5M
,
noticed by Kauffmann et al. (2003b), who showed that the proper-ties of galaxies in the low-redshift universe change significantly at this mass.
In Galaxy Zoo, citizen scientists were asked to visually clas-sify the prominence of bulges of galaxies into four categories: NO-BULGE,JUST-NOTICEABLE, OBVIOUS, DOMINANT(further description in Willett et al.2013 and Simmons et al.2013). We can com-pare our structural classification with the GZ classification debi-ased vote fractions. Bdebi-ased on the bulge question, we divide the sample into: ‘DISC DOMINATED’ (having debiased likelihoods no-bulge+just-noticeable>obvious+dominant) and ‘OBVIOUS BULGES’ (having no-bulge+just-noticeable < obvious+dominant). The fraction of galaxies differing between our visual classification of bulges, based on the structural decomposition of the fits and resid-uals, and the Galaxy Zoo volunteers’ classification of the bulge prominence is only 15 per cent. This is mostly due to galaxies fit-ted with disc+bar+bulge components being classified as being disc dominated (10 per cent) and 5 per cent of galaxies fitted with two components being identified as having obvious bulges. In Fig.4, we plot the B/T luminosity ratio versus the GZ vote fractions for bulge prominence. There is a significant correlation between the vol-unteers’ classification, our inspection and the decomposition; there-fore, we proceed using our split into disc+bar and disc+bar+bulge fits in the following section.
2.6 Tests
2.6.1 Fitting theugrizbands independently
[image:7.595.52.280.57.202.2]We tested the reliability of the multiband fitting compared to single-band fitting, by decomposing all the fitted barred galaxies with two (disc+bar) and three components (disc+bar+bulge) independently in the five (ugriz) SDSS bands. For this, we used the parameters from the multiband fitting as initial guesses for all bands and refitted the five bands by allowing there,nand the centre to vary freely with band. We kept the axis ratio and position angle to be constant with band in all fits to prevent the components from interchanging. In this case of fitting five single bands independently, the fits to
Figure 5. The dependence of the bulge and bar parameters with waveband for six randomly selected galaxies, fitted independently in theugrizbands. For comparison, we also plotted the parameters in the multiband fitting, denoted bym, where there’s andn’s were kept constant with wavelength.
Thus, there is a single value forreandnfor all the bands.
only 3102 galaxies converged to meaningful values, showing that constraining parameters in multiband fitting increases the number of reliable fits.
As shown in Fig.5for 6 randomly selected galaxies out of the 3102 fitted galaxies, the structural parameters for the bars and for the bulges of the fitted galaxies vary slightly with wavelength, but do not change significantly (typically much less than a factor of 2). For the six galaxies, we also compare the parameters in the single-band fitting to the multisingle-band fitting, denoted withmin Fig.5, the multiband parameters agreeing well with the parameters fitted in individual bands. Theχ2minimization in
GALFTIMuses the measured pixel-by-pixel noise as a weight, so although individual bands are not given different weights, those which are noisier (u,z) will have lower weights. This is seen clearly in Fig.5, where the multiband parameters trace theg,r,ifeatures closer thanuandz. In particular, the converged values are more similar to the values in theiband, which is the deepest image in SDSS data and, hence, the band in which the decompositions are most reliable.
A similar multiband fitting procedure was applied to bulge– disc decompositions of 163 artificially redshifted nearby galaxies and shown to improve the measurements of structural parameters (Vika et al.2014). Fig. 1 in Vika et al. (2014) shows a similar trend for the measured parameters of a two-component fit with wavelength.
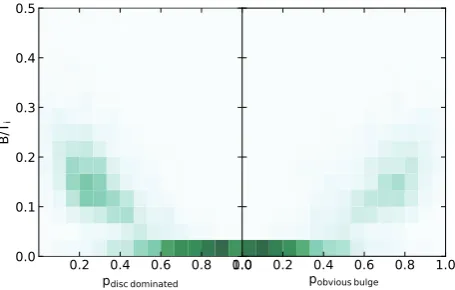
Figure 6. The correlation of (g−i) colours for the disc, bar and bulge components with the bands fitted independently (y-axis) against the same colours in multiband fitting (x-axis). The Spearmanrs-coefficient is shown
at the top and the 1–1 line is drawn. The two values are clearly correlated and lie on the 1–1 line, with the bar component showing the largest spread.
2.6.2 MONTAGEversus single frames
We next check the effect of usingMONTAGEto co-add the images. Us-ingMONTAGEand multiple fields has some obvious advantages: being able to create images of galaxies close to the edges of the fields, with sufficient background around them, while also increasing the S/N. It also has some disadvantages, such as combining PSFs from different observations when co-adding the frames. To test the effect of using MONTAGEto create the images, we fit three components, using the same method as before, to∼1500 barred galaxies with obvious bulges that were not situated at field edges. There is a higher failure rate for the galaxies whereMONTAGEis not used compared to the stacked images, because of the lower S/N of the images in the overlap region. We compared all the fitted parameters between the single frames and multi frames and find a clear correlation and no systematics in most parameters. The only parameters for which we notice a systematic change between the single band andMONTAGE are for the bulges, which might be due to the modified PSFs: (1) the bulge S´ersic indices,nbulge, in the single frames are 1.3 times higher than in theMONTAGEframes; (2) the bulge effective radii,re,bulgeare ∼10 per cent smaller in the single frames. However, this is the same effect observed for the two parameters. Thenandreare related for a component with fixed flux; therefore, we expect that a change in one
parameter to result in a change for the other. The median colours of the three components change insignificantly: (u−r)=0.04, (g−i)=0.02, (r−z)=0.01. We expect these small effects to occur in both barred and unbarred galaxies.
Therefore, it is advantageous to useMONTAGEto recover the param-eters of a higher fraction of galaxies, with the expense of smoothing the data to a small extent, having the main effect of possibly esti-mating 1.3 times smaller bulge S´ersic indices.
2.6.3 Uncertainties
GALFITM computes statistical errors (typically of ∼few per cent) internally based on the covariance matrix produced during the least-squares minimization by the Levenberg–Marquardt algorithm. They are known to underestimate the true error because it assumes that the only source of error is Poisson noise (H¨aussler et al.2007). In reality, uncertainties are underestimated because they do not take into account the errors due to sky measurements, improper masking, correctness of the PSF, the assumed models for the galaxy and parameter degeneracy. Uncertainties in the background level are one of the main sources of errors, especially for components with high S´ersic indices, as these have extended wings (Peng et al.2010). Vika et al. (2013) showed that the uncertainties in a single S´ersic fit with GALFITM of images similarly created withMONTAGEin the ugrizbands are typically: formagnitude(±0.13,±0.09,±0.10, ±0.11,±0.12 mag),re (±12 per cent,±11 per cent,±12 per cent, ±14 per cent,±15 per cent) and n (±9 per cent,±11 per cent, ±14 per cent,±15 per cent,±17 per cent). These were based on the uncertainties in estimating the sky flux, which dominates the error budget. The uncertainties on fitting multiple components are more complex, Vika et al. (2014) shows that the bulgenandrecan vary by up to 25 per cent, while the uncertainties in the disc components in the disc+bulge decompositions are similar to the uncertainties in the single S´ersic fits. Since we used the same software and images of the same quality, we believe our uncertainties in the disc, bar and bulge parameters are similar to those found by Vika et al. (2014) in disc+bulge decompositions. Even though the individual fits can have substantial scatter, the median values for the entire population are robust.
3 D I S C , B A R A N D B U L G E P R O P E RT I E S
First, in Section 3.1, we study the colour distribution of discs, bars and bulges of barred galaxies, the differences in component colours within individual galaxies, and trends with stellar mass. Then, in Section 3.2, we look at the properties of bars and how they vary with different galaxy properties. Furthermore, in each subsection, we compare our findings with other published studies on barred galaxies. The structural parameters, luminosity ratios and colours of the discs, bars and bulges for the successfully fitted 3461 galaxies are given in Tables2and3.
3.1 Component colours
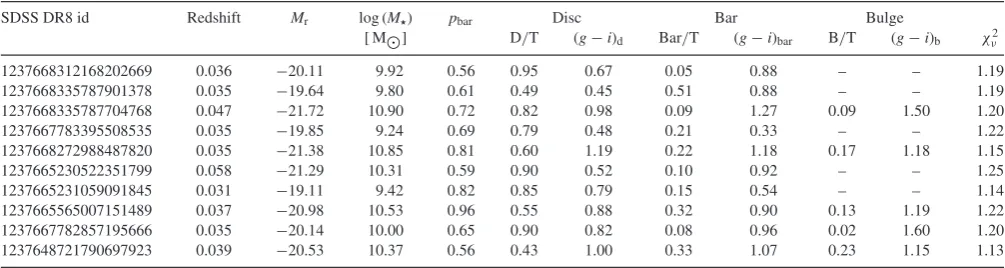
Table 2. Structural parameters of discs, bars and bulges for 10 randomly selected barred galaxies out of the 3461 galaxies fitted with disc+bar or disc+bar+bulge components. Columns (3), (7), (11) show the integratedi-band magnitudes (from the fits, not corrected for Galactic extinction), columns (4), (8), (12) show the S´ersic indices, columns (5), (9), (13) the effective radii in pixels and columns (6), (10), (14) the axis ratios from the multiband fits of the three components. We remind the reader that the measured bulge S´ersic indices in the co-added frames are∼1.3 times smaller than those in single frames, as discussed in Section 2.6.2. The magnitudes in theu,g,r,zbands are also available. Full table is available in the electronic version of the paper.
SDSS DR8 id Fit components Disc Bar Bulge
mag n re b/a mag n re b/a mag n re b/a
1237668312168202669 disc+bar 15.57 1.0 26.96 0.84 18.68 0.33 3.84 0.38 – – – –
1237668335787901378 disc+bar 16.78 1.0 11.28 0.86 16.76 1.01 2.86 0.60 – – – –
1237668335787704768 disc+bar+bulge 14.75 1.0 19.48 0.98 17.17 0.39 5.29 0.33 17.15 0.63 1.48 0.83
1237667783395508535 disc+bar 15.81 1.0 24.59 0.87 17.24 1.05 9.47 0.33 – – – –
1237668272988487820 disc+bar+bulge 14.69 1.0 28.37 0.79 15.78 0.43 13.58 0.43 16.05 1.13 3.35 0.68
1237665230522351799 disc+bar 15.59 1.0 21.92 0.72 17.95 1.90 4.81 0.19 – – – –
1237665231059091845 disc+bar 16.58 1.0 13.09 0.75 18.44 0.38 7.28 0.31 – – – –
1237665565007151489 disc+bar+bulge 15.44 1.0 20.92 0.86 16.03 0.38 11.76 0.29 17.02 1.25 3.35 0.49 1237667782857195666 disc+bar+bulge 15.65 1.0 21.04 0.68 18.27 0.10 14.42 0.17 19.63 0.30 1.22 0.34 1237648721790697923 disc+bar+bulge 16.29 1.0 16.25 0.94 16.57 0.74 7.53 0.47 16.96 0.66 1.43 0.69
Table 3. Properties of the same 10 galaxies as in Table2, fitted with disc+bar or disc+bar+bulge components. Redshifts andr-band Petrosian absolute magnitudes (Mr) are drawn from SDSS DR7 and the stellar masses are drawn from average values in the MPA-JHU catalogue (Kauffmann et al.2003a).
Column (5) shows the debiased bar likelihood of the galaxies from the GZ2 catalogue (Willett et al.2013), based on the volunteers’ visual inspection. Disc-to-total, bar-to-total and bulge-to-total luminosity ratios in theiband are given in columns (6), (8), (10). Columns (7), (9), (11) show the (g−i) colours of the three components, corrected for Galactic reddening and extinction using the maps from Schlegel, Finkbeiner & Davis (1998) andk-corrected (Blanton & Roweis2007). Finally, column (12) shows the reduced-χ2value of the fits. Full table is available in the electronic version of the paper. Luminosity
ratios in theu,g,r,zbands, as well as other colours (u−randr−z) are available in the online table.
SDSS DR8 id Redshift Mr log (M) pbar Disc Bar Bulge
[ M] D/T (g−i)d Bar/T (g−i)bar B/T (g−i)b χν2
1237668312168202669 0.036 −20.11 9.92 0.56 0.95 0.67 0.05 0.88 – – 1.19
1237668335787901378 0.035 −19.64 9.80 0.61 0.49 0.45 0.51 0.88 – – 1.19
1237668335787704768 0.047 −21.72 10.90 0.72 0.82 0.98 0.09 1.27 0.09 1.50 1.20
1237667783395508535 0.035 −19.85 9.24 0.69 0.79 0.48 0.21 0.33 – – 1.22
1237668272988487820 0.035 −21.38 10.85 0.81 0.60 1.19 0.22 1.18 0.17 1.18 1.15
1237665230522351799 0.058 −21.29 10.31 0.59 0.90 0.52 0.10 0.92 – – 1.25
1237665231059091845 0.031 −19.11 9.42 0.82 0.85 0.79 0.15 0.54 – – 1.14
1237665565007151489 0.037 −20.98 10.53 0.96 0.55 0.88 0.32 0.90 0.13 1.19 1.22
1237667782857195666 0.035 −20.14 10.00 0.65 0.90 0.82 0.08 0.96 0.02 1.60 1.20
1237648721790697923 0.039 −20.53 10.37 0.56 0.43 1.00 0.33 1.07 0.23 1.15 1.13
et al. (1998).7 The magnitudes were k-corrected (Blanton & Roweis2007); these corrections are small given the proximity of our sample.
As seen in Fig.7, there is a clear difference between the colours of the three components of barred galaxies. The discs are clearly bluer than the bars, which in turn are slightly bluer than the bulges, in (u−r), (g−i) and (r−z) colours. In what follows, we will focus on the (g−i) colours because they are less prone to dust extinction, while the bands are sufficiently separated in wavelength to probe both star forming and quiescent stellar populations.
In (g− i) colours, the median difference between bulges and discs is (g − i)b,d = 0.33 and between the bars and discs (g−i)bar,d=0.20. Our sample of barred galaxies contains galax-ies of stellar masses between 108M
and 1011.5M
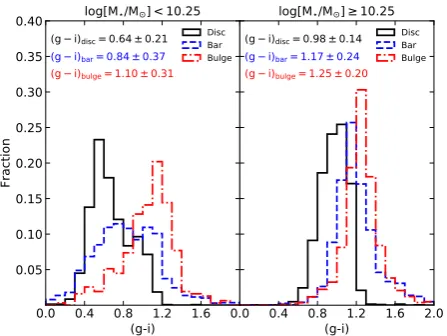
. Since the colours and properties of galaxies are dependent on mass, we split the sample by galaxy stellar mass into low-massM<1010.25M
(1401 galaxies) and high-massM ≥1010.25M
(2060 galaxies), and we plot the distribution of component (g−i) colours in Fig.8. As expected, the colours of the components of lower mass galax-ies, especially the discs and bars, are bluer compared to high-mass
7Usinghttps://github.com/rjsmethurst/ebvpy.
galaxies. The shift in colours is less significant for the bulges, which still appear red in colour, but their (g−i) colour spread increases, although there are only 315 low-mass galaxies fitted with a bulge. At high masses, the discs and bar components appear to be much redder compared to the lower mass counterparts. For high-mass galaxies, the colours of bars and bulges are more similar, suggesting that they host similar, old stellar populations.
Another study using disc+bar+bulge decomposition with avail-able (g−i) colours from fits is the work by Gadotti (2009,2010) who fitted 291 face-on (with axial ratiob/a≥0.9) barred galax-ies with masses M > 1010M
[image:9.595.46.549.333.467.2]Figure 7. The (u−r), (g−i) and (r−z) colours of the different galaxy components for all the fitted barred galaxies (3461 galaxies). The discs are bluer than the bars, which in turn are slightly bluer than the bulge. The median colours and their corresponding 1σspreads are represented for each component, since the median is less sensitive than the mean to outliers.
Figure 8. Normalised histograms of the (g−i) colours of the different galaxy components, split by galaxy mass. There were 1086 low-mass galax-ies fitted with disc+bar, 315 with disc+bar+bulge. Similarly, there were 1900 high-mass galaxies fitted with disc+bar+bulge and 160 with disc+bar. The discs and bars of lower mass galaxies are significantly bluer than those of high-mass galaxies, while the bulges are only moderately bluer compared to their high-mass counterparts. The median colours and their corresponding 1σspreads are represented for each component.
larger, the slight difference in the sample selection (the galaxies in Gadotti (2009) have lower inclinations, thus being less affected by internal dust extinction), different PSFs or the different fitting softwares used (as discussed further in Section 4.1) might account for the differences in the bulge colours and other bulge parameters. Other authors have reported similar differences in colour between bulges and discs in disc+bulge decompositions. For example, in a multiband bulge+disc decomposition of 163 galaxies, Vika et al. (2014) found a difference in the colours of discs and bulges of (g−i)b,d∼0.3 for all late-type Sa-Sm galaxies, well in agree-ment with our study. Furthermore, Kennedy et al. (2016) using bulge+disc decompositions on galaxies from the GAMA survey also found that regardless of morphology, bulges are consistently
redder than their corresponding discs. Finally, Head et al. (2014) found a bulge–disc colour difference of (g − i) = 0.09 for S0 galaxies. Nevertheless, our observations that bulges are, in the vast majority of cases (91 per cent for both barred and unbarred galax-ies), redder than their discs seems to be in contradiction with the spectroscopic observations of Johnston, Arag´on-Salamanca & Mer-rifield (2014), who found that bulges of S0 galaxies are consistently younger and more metal rich than their corresponding discs. Al-though differences might arise because our sample contains a mix of Hubble types.
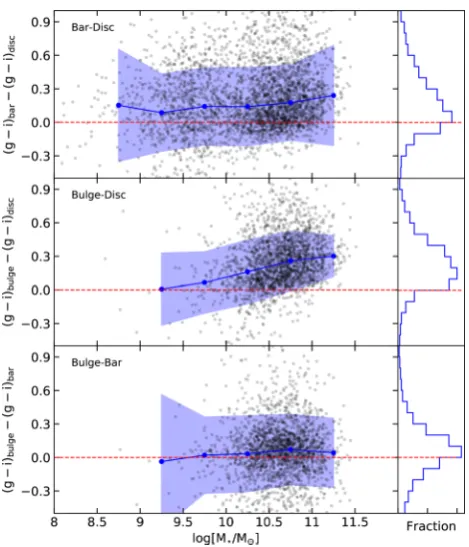
Next, instead of looking at the distributions of component colours for the entire population of barred galaxies, we can look at the com-ponent colours for individual galaxies. This should show in more detail how the colours of components are related. As shown above, galaxy colours depend strongly on total stellar mass. Therefore, we plot the colour difference between each two of the three fitted com-ponents against the stellar mass (drawn from average values in the MPA-JHU catalogue; Kauffmann et al.2003a) in Fig.9. First, we notice that the bars are consistently redder than their accompanying discs (top panel) by (g−i)∼0.2. There is a slight trend with stel-lar mass, higher mass galaxies having the reddest bars compared to their corresponding discs. Secondly, bulges are almost always redder than their associated discs, as suggested by Fig.9(middle panel), by (g−i)∼0.25 on average, but appear to become more similar in colour to discs in lower mass galaxies, where they are much less common. Thirdly, we have already seen in Fig.7that bars are bluer than bulges when comparing the fitted sample of barred galaxies; however, Fig.9(bottom panel) shows that within the same galaxy they have similar colours. Disc-dominated galaxies have bluer bars compared to the bars in galaxies fitted with a bulge component, therefore shifting the histogram corresponding to the bar component in Fig.7to bluer colours. The trend in Fig.9 (bot-tom panel) is relatively flat with stellar mass, suggesting a common evolution for the stellar populations of bars and bulges.
[image:10.595.52.276.321.489.2]Figure 9. The differences in (g−i) colours of the three galaxy components, showing the change in colour for each individual galaxy. This plot contains all the successfully fitted barred galaxies (3461) with disc+bar (1246 galax-ies) and disc+bar+bulge (2215 galaxgalax-ies) components. The median (g−i) colour is plotted with blue in stellar mass bins of log (M
M)=0.5 (excluding
>10σoutliers) and the shaded band represents the 1σscatter.
simple model for a single stellar population with solar metallicity, an initial burst of star formation and optical colours predicted by the Bruzual & Charlot (2003) stellar population synthesis code we find that most of the stellar populations in bulges are consistent with being formed atz∼2 (10 Gyr ago) with no significant rejuvena-tion. Only a small proportion of bulges extend to bluer colours, and hence having stellar population ages<5 Gyr. Discs have stellar population ages of a few Gyrs, while bars host, in general, older stellar populations, having similar ages as the bulges. The ages discussed in this paragraph are the average ages of the stellar popu-lations that dominate the light of the components, not the dynamical ages of the disc, bars or bulges. To study the stellar populations of barred galaxies in greater detail and to break the observed colour degeneracy, one has to use spatially resolved spectroscopy. Luck-ily, large-scale IFU surveys such as MaNGA (SDSS Collaboration et al.2016) are in progress, which will allow us to better model the stellar populations in these galaxies. Disentangling stellar popula-tion ages and metallicities directly with MaNGA data and using 2D image decomposition will be the subject of future work. One such step in separating the spectra of bulges and discs using GALFITM and MaNGA data was achieved by Johnston et al. (2017).
Furthermore, the effect of internal dust reddening should be con-sidered when comparing the colours of different galaxy compo-nents. Masters et al. (2010) showed that the dust effects are system-atic with the inclination of spiral galaxies, finding a total extinction from face-on (i=0◦) to edge-on (i=90◦) galaxies of 0.7, 0.6, 0.5, 0.4 and 0.3 mag for theugrizpassbands. The extinction is much smaller from completely face-on (i= 0◦) to moderately face-on (i=60◦) (0.17, 0.12, 0.07, 0.04 for theugribands, using equation (3) in Masters et al. (2010) and assuming no extinction in thez
band). The galaxies in our sample were selected to be moderately face-on (i60◦), thus we do not expect the effect of dust to be significant.
We also checked for systematic trends with inclination in our sample, by assuming that the fittedb/adisccan be easily translated
to an inclination (cos2i= b/a2disc−q2
1−q2 , whereq=0.2, the intrinsic thickness of an edge-on disc, Unterborn & Ryden2008). We find only a small trend of colours with inclination, such that ati∼60◦, the (g−i) colours of the bulges, bars and discs given by the lines of best fit are 1.29, 1.10 and 0.83, while for completely face-on galaxies (i∼0◦) they are 1.19, 1.04 and 0.87, respectively. Hence, the colour excesses between 60◦and 0◦are (g−i)bulge ∼ 0.1, (g−i)bar∼0.06 and (g−i)disc∼ −0.04. We find that bulges suffer from more attenuation with inclination than discs, as also shown by Pierini et al. (2004) and Tuffs et al. (2004). Perhaps counter-intuitive we find a negative dust attenuation for the discs, such that the face-on discs are redder compared to the slightly in-clined ones. This can be an optical depth effect – for the more inclined galaxies we can better observe the outer stellar popula-tions which are likely bluer, while for the face-on galaxies we better observe the inner disc which is intrinsically redder. Gadotti, Baes & Falony (2010) also found that the dust attenuation in the discs at low inclinations can be negative, suggesting that this is probably due to scattering of photons propagating parallel to the plane of the galaxy into the line of sight.
Our sample contains both late and early-type galaxies, which contain different amounts of dust. Ideally, one should correct for the internal dust extinction; however, even the different components of galaxies (discs, bars and bulges) contain different amounts of dust and hence suffer different dust extinctions (Driver et al.2008). Considering the diversity of our sample, as well as the large range of masses in our study 108–1011.5M
, it is impossible to correct for internal dust extinction using a simple relation. Therefore, the colours discussed in this paper were corrected only for Galactic extinction.
Dust might also affect the measured parameters of the com-ponents, as discussed in more detail by Pastrav et al. (2013a,b), especially at lower wavelengths. However, considering the face-on sample chosen for the decompositiface-on and the multiwavelengths used in this study (ugriz), its effects should be minimized.
3.2 Properties of bars
Having identified the bars, we consider their properties in this sub-section.
Figure 10. The scaled bar length,re,bar/re,discin this work, andL/2RPetro90
in Hoyle et al. (2011), as a function of stellar mass (top). The median bar size compared to galaxy size is constant at low masses and reaches a maximum of 0.5 atM∼1010.25M
, then the scaled size declines slightly with mass. In the bottom plot, the scaled bar length re,bar/re,discin this
work split into ‘DISC DOMINATED’ (fitted with disc+bar) and ‘OBVIOUS BULGES’
(fitted with disc+bar+bulge) is shown. Galaxies with significant bulges have consistently larger bar scaled lengths. Median values in stellar mass bins of log (M
M)=0.5 are plotted and the shaded areas represent the 1σ/
√
N
error on the mean per bin.
Across all stellar masses, strong bars identified in Galaxy Zoo are 20–80 per cent of the size of the discs and the bar-scaled sizes are constant with stellar mass, at a first approximation. The median scaled bar size is∼40−50 per cent in both our measurements and those of Hoyle et al. (2011). Both papers observe a peak in the relative bar size of∼50 per cent at 1010.25M
for strong bars, which is similar to the transition mass between disc-dominated galaxies and galaxies with obvious bulges. In the bottom plot of Fig.10, the scaled bar length is plotted for the sample split into disc-dominated galaxies and galaxies with obvious bulges showing that the peak in the relative bar size is due to the increasing prominence of bulges in our sample. Galaxies with obvious bulges have∼25 per cent longer bar-scaled sizes when compared to disc-dominated galaxies. The fact that Hoyle et al. (2011) observe a similar trend using a different measure for the bar length suggests that it is not an artefact of the additional component (+bulge) added to our disc+bar fits around the same galaxy mass. Finally, at masses higher than 1010.25M
,
the bar-scaled size drops to∼0.45.
The measured axis ratio of the bar varies between 0.1 and 0.6, with a median and 1σ scatter ofb/a=0.31±0.12 in good agreement with the expected values of 0.2–0.4 (Kormendy & Kennicutt2004). Our measured axis ratios, in general, correspond well with other studies, but note that alternative measurement methods may lead to minor differences. Our median axis ratio is∼30 per cent higher than the axis ratio found by Hoyle et al. (2011), b/a =0.24±0.07, but in this case the axis ratio was calculated as the ratio of the measured
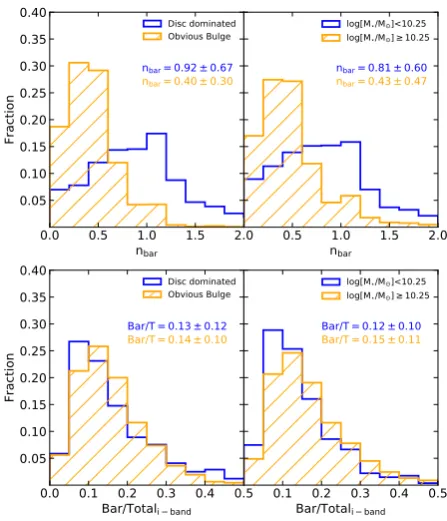
Figure 11. The first two figures (top) show the bar S´ersic indices split into DISC DOMINATED(modelled with disc+bar) and OBVIOUS BULGE(modelled
with disc+bar+bulge) (left) and stellar mass bins (right). Low-mass, disc-dominated barred galaxies have bars with a broad distribution of profiles, with a large fraction of bars having exponential profiles, while high-mass galaxies with prominent bulges have flatter profiles. The median S´ersic indices of the bars are represented in the plot. The bottom plots show the bar-to-total luminosity in thei-band. The bar-to-total luminosity ratio is consistent for DISC-DOMINATEDand OBVIOUS BULGEgalaxies (left), as well as
for low- and high-mass galaxies.
bar width to bar length. Gadotti (2011) found a higher axis ratio of b/a =0.37±0.10, using a boxy fit, which is closer to the real shape of bars (Athanassoula et al.1990).
We now turn to the radial light profile of bars, as measured by their S´ersic index. We notice a significant difference (Kolmogorov– Smirnov testk=0.52,pKS<10−15) when the sample is split into ‘DISC DOMINATED’ (disc+bar fit) and ‘OBVIOUS BULGE’ (disc+bar+bulge fit), as shown in the top left-hand panel of Fig.11. A similar dif-ference, but less pronounced (KS testk= 0.36,pKS <10−15) is seen when the sample is split into low mass and high mass (top right-hand panel of Fig. 11). We remind the reader that there is a significant overlap between the ‘DISC-DOMINATED’ and low-mass samples (and ‘OBVIOUS BULGE’ and high mass, respectively) as more disc-dominated galaxies tend to have lower masses. We find that disc-dominated, low-mass galaxies have stellar bars with a S´ersic index ofnbar=0.92±0.67. On the other hand, high-mass galaxies, many with obvious bulges, have bars with shallower, Gaussian, light profiles withnbar=0.40±0.30. We notice that 80 per cent of the galaxies withnbar>0.8 and almost all withnbarbetween 1 and 2 are disc dominated, suggesting that the presence of a significant bulge is the most important factor in the bar light profile. Alternatively it might be possible that a faint bulge is not separable from the bar, but its presence acts to steepen the apparent bar profile. However, we find only a very weak correlation betweennbarand B/T (Spearman rs-correlation testrs=0.09,p=0.0001).
[image:12.595.53.271.54.323.2](1996), who noticed that bars in early-type galaxies have a flatter profile compared to late-type ones, which have exponential profiles. They suggested that flat profiles arise from the overcrowding of old and young stars at the bar ends. Furthermore, Combes & Elmegreen (1993) found in simulations that these differences arise because of a difference in their resonance locations. Kim et al. (2015) found a similar difference in the light profiles of bars, in a sample of 144 nearby galaxies, suggesting that the flatness of the bar profile can be used as a bar age indicator. In their study, galaxies with obvious bulges have a median S´ersic index of nbar ∼ 0.3, while disc-dominated systems have nbar ∼0.85. We agree with these previous findings, albeit using a much larger sample, therefore strengthening the result that bars in late and early-type galaxies have different radial light profiles.
Using the fits, another quantity that can be measured is the bar-to-total luminosity (Bar/T). In Fig.11(bottom panels), the Bar/T luminosity ratio can be seen for theiband. The distribution of Bar/T luminosity is consistent within all the five SDSS bands, hence only one band is shown. The Bar/T ratio appears to be similar (KS test k=0.07,pKS=0.002) for ‘DISC-DOMINATED’ galaxies and galaxies with ‘OBVIOUS BULGES’, as well as for low-mass and high-mass barred galaxies (Bar/T∼0.14). There is only a∼10 per cent difference in the median B/T value for galaxies withM<1010.25M
, compared to higher mass galaxies, implying a mostly mass-independent bar growth. Hence, the Bar/T luminosity ratio does not correlate with the bulge prominence or the mass of the galaxy.
For galaxies withM>1010M
, Gadotti (2011) found a median Bar/T∼0.10, 40 per cent smaller than in this study. We find a better agreement with Weinzirl et al. (2009), who also used a similar decomposition method, although their sample comprised of only 80 barred galaxies and the images were in theHband.
4 C O M PA R I S O N O F B A R R E D A N D U N B A R R E D G A L A X I E S
Another aim of this paper is to compare the properties of barred and unbarred galaxies to infer the effect the bar has on its host galaxy. In order to have a statistically meaningful comparison, we selected a VOLUME-LIMITED subsample of BARRED galaxies, and a similarVOLUME-LIMITED UNBARREDsample, based on the Galaxy Zoo users’ classifications, as described in Section 2.
There are 8689 galaxies in aVOLUME-LIMITED UNBARREDsample, selected with pbar ≤ 0.2. There are 4692 (57 per cent) unbarred galaxies with negligible bulges (disc-dominated galaxies) and 3587 (43 per cent) unbarred galaxies with obvious bulges, according to the Galaxy Zoo volunteers’ classification described in Section 2.5. We have fitted all the galaxies in theVOLUME-LIMITED UNBARRED sample with two (disc+bulge) components, which converged for 6314 galaxies. Furthermore, as for the barred galaxies, we excluded bulges with low-axis ratiosb/abulge<0.3, yielding a total of 5080 successful fits (a 58 per cent success rate). This sample contains both disc-dominated and unbarred galaxies with obvious bulges, in proportions of 44 per cent and 56 per cent, respectively. Therefore, a higher fraction of disc-dominated galaxies failed the two component fits, which is expected. We have one component fits available for these galaxies, but we used the two component fits (disc+bulge) in our analysis of unbarred galaxies so that we do not bias the comparison with single versus multicomponent fits.
[image:13.595.318.539.58.198.2]The mass distribution of the two successfully fitted, VOLUME -LIMITEDsamples can be seen in Fig.12. The distribution of masses of the two samples are clearly different (KS testk=0.19,pKS<10−15); galaxies with strong bars have significantly higher masses compared to unbarred galaxies.
Figure 12. The distribution of masses of the successfully fittedVOLUME -LIMITED SAMPLESofBARREDversusUNBARREDgalaxies. Barred galaxies, al-though lower in number, have, on average, higher masses. From this distri-bution, we selected a mass-matched sample of unbarred galaxies.
Figure 13. Colour–mass diagram of the mass-matchedVOLUME LIMITED SAM
-PLESofBARREDandUNBARREDgalaxies. Instead of overlaying the two distri-bution, they were subtracted and normalized by the total number of galaxies in each bin. A darker red colour suggests an excess of barred galaxies, while dark blue colour an excess of unbarred ones. It is clear that the barred galaxies tend to be redder, while unbarred ones tend to be bluer, at the same stellar masses. Although mass is thought to drive most of the evolution of a galaxy, the main physical difference between the two populations in this plot is the presence of a strong bar. The two lines show the definition of the ‘green valley’ from Schawinski et al. (2014).
Most of the differences between the barred and unbarred galaxies are driven by stellar mass. Thus, to study mass independent effects, we selected a mass-matched subsample of 2435 unbarred galaxies (matched in bins of log ( M
M)=0.1). The mass-matched sample of unbarred galaxies contains 1570 (64 per cent) galaxies with ob-vious bulges and 868 (36 per cent) disc-dominated galaxies. This is different from the distribution of bulges in theVOLUME-LIMITED subsample ofBARREDgalaxies, according to the Galaxy Zoo volun-teers: 74 per cent strongly barred galaxies with obvious bulges and 26 per cent galaxies with negligible bulges.
[image:13.595.310.549.260.425.2]