The Just-Noticeable Difference
in Speech-to-Noise Ratio
David McShefferty
1, William M. Whitmer
1, and
Michael A. Akeroyd
1Abstract
Just-noticeable differences (JNDs) have been measured for various features of sounds, but despite its importance to com-munication, there is no benchmark for what is a just-noticeable—and possibly meaningful—difference in speech-to-noise ratio (SNR). SNR plays a crucial role in speech communication for normal-hearing and hearing-impaired listeners. Difficulty hearing speech in background noise—a poor SNR—often leads to dissatisfaction with hearing-assistance devices. While such devices attempt through various strategies to address this problem, it is not currently known how much improvement in SNR is needed to provide a noticeable benefit. To investigate what is a noticeable benefit, we measured the JND in SNR for both normal-hearing and hearing-impaired listeners. Here, we report the SNR JNDs of 69 participants of varying hearing ability, estimated using either an adaptive or fixed-level procedure. The task was to judge which of the two intervals containing a sentence in speech-spectrum noise presented over headphones was clearer. The level of each interval was roved to reduce the influence of absolute level cues. The results of both procedures showed an average SNR JND of 3 dB that was independent of hearing ability. Further experiments using a subset of normal-hearing listeners showed that level roving does elevate threshold. These results suggest that noise reduction schemes may need to achieve a benefit greater than 3 dB to be reliably discriminable.
Keywords
just-noticeable difference, speech-to-noise ratio, hearing impairment, auditory perception, psychophysics
The most important parameter that affects the ability to hear and understand speech in the presence of back-ground noise is the speech-to-noise ratio (SNR)—the level of the speech relative to the level of the background. In general, hearing-impaired (HI) listeners need a higher SNR than for normal-hearing (NH) listeners to achieve the same amount of speech intelligibility; equivalently, their thresholds for speech identification are generally higher than their NH peers (e.g., Plomp & Mimpen, 1979; Smoorenburg, 1992). The standard medical inter-vention for most forms of hearing impairment is provi-sion of a hearing aid, yet the amplification provided by a typical hearing aid does not increase SNR, as it amplifies the combined speech and background mixture (Naylor & Johannesson, 2009). Some features of hearing aids do improve SNR; for instance, directional microphones have repeatedly been shown to create more favorable SNRs and give correspondingly improved intelligibility (Hawkins & Yacullo, 1984; Ricketts, 2001; Valente, Fabry, & Potts, 1995; Wouters, Litiere, & van Wieringen, 1999). The amount of improvement in SNR is dependent on factors such as the distance and spatial
location of the noise in relation to the speech signal, the type and number of noise sources, and the amount of reverberation in the environment; the improvement can vary from as little as 0.8 to as much as þ8.2 dB (Amlani, 2001).
Although SNR improvements measured under ideal laboratory conditions are rarely achieved in practice (e.g., Dittberner & Bentler, 2003, demonstrated that a theoretical directional benefit of 6 dB is reduced to 3 dB when measured on a mannequin), one would expect these improvements to provide noticeable real-world benefit. Yet, it has been shown that (a) there is minimal directional benefit in the absence of strictly controlled noise conditions (Walden, Surr, Cord, & Pavlovic, 2000),
1
MRC/CSO Institute of Hearing Research—Scottish Section, Glasgow Royal Infirmary, Glasgow, UK
Corresponding author:
David McShefferty, MRC/CSO Institute of Hearing Research—Scottish Section, Glasgow Royal Infirmary, 10-16 Alexandra Parade, Glasgow, G31 2ER, UK.
Email: [email protected]
Creative Commons CC-BY-NC: This article is distributed under the terms of the Creative Commons Attribution-NonCommercial 3.0 License (http://www.creativecommons.org/licenses/by-nc/3.0/) which permits non-commercial use, reproduction and distribution of the work without further permission provided the original work is attributed as specified on the SAGE and Open Access page (http://www.uk.sagepub.com/aboutus/openaccess.htm).
Trends in Amplification 2015, Vol. 19: 1–9 !The Author(s) 2014 Reprints and permissions:
(b) about 30% of consumers surveyed have cited lack of perceived benefit as a reason for not wearing their hearing aids (Kochkin, 2000), and (c) problems with speech in noise remain a consistent complaint and reason for the common nonuse of hearing devices (McCormack & Fortnum, 2013). As benefit may come from a positive change in SNR, we suggest that nonuse may be linked to the (in)ability to detect a change in SNR. If hearing aids provide an improvement in SNR which is smaller than the smallest change in SNR that a listener can reliably detect, then the person would not notice the improvement and would likely not use or be dissatisfied with the device. It is therefore crucial to know what is the just-noticeable difference (JND) for SNR, and if it varies with the degree of hearing impairment. Accurate measurements of the JND are fundamental to understanding what hearing aids can do for listeners.
Relevant data are scarce. We have identified only one study that measured the ability to detect changes in SNR (Killion, 2004). In that experiment, 16 hearing-aid wear-ers made paired comparisons between different SNRs, using values from 6 dB to þ6 dB in 2 dB steps. The results showed that subjects performed at chance level with a 2-dB difference but achieved about 90% correct with a 4-dB difference and 100% for both a 6-dB and an 8-dB difference. Killion concluded that while a 2-dB change in SNR could bring benefit, such benefit was unlikely to be noticed in a real-world setting. However, the hearing losses of the participants were not specified in the report, and it was not specified whether the overall level of the stimuli was roved or not. Level roving is necessary to ensure that listeners actually use SNR to detect differences in SNR. For example, if a 2-dB versus 4-dB comparison in SNR is presented experimen-tally as a 72-dB speech signal in a 70-dB noise signal versus a 74-dB speech signal in a 70-dB noise signal, then the task can be done using the level of the speech signal. But if the experimental presentation is, for exam-ple, a 72-dB speech signal in a 70-dB noise signal versus a 68-dB speech signal in a 64-dB noise, then the only reli-able method across trials is to use SNR. The four experi-ments of the present study were therefore designed to determine the JND in SNR while controlling for these issues, thereby creating reference data for what is a detectable difference in SNR.
Experiment 1 measured the JND for a change in SNR, using a corpus of short sentences partially masked by a speech-shaped noise, for both normal and HI participants with known hearing losses. The proced-ure was a two-alternative, two-interval forced-choice adaptive procedure in which participants compared the SNR of a reference interval (SNRR¼either 0 orþ6 dB)
with the SNR of a test interval (SNRT¼SNRR
þSNR), with the value of the change (SNR) varied
adaptively. In Experiment 2, the results of Experiment 1 were verified by measurements of the full psychometric function for changes in SNR. In Experiment 3, the effect of using nonroved stimuli was investigated in a small group of NH participants, and in Experiment 4, the same group undertook a conventional level-discrimination task for comparison.
Methods
Participants
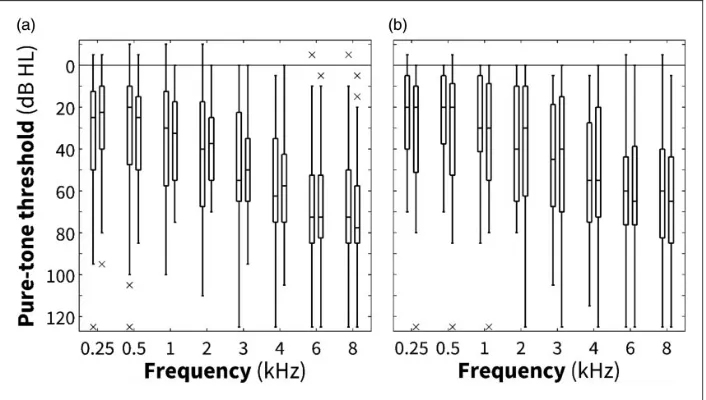
In Experiment 1, 44 participants (22 females) were recruited from local hearing clinics (n¼39) and employ-ees of the MRC/CSO Institute of Hearing Research (n¼5). Pure-tone thresholds were measured using the modified Hughson-Westlake method (British Society of Audiology, 1981). Figure 1 (left panel) shows the average pure-tone audiometric thresholds of all 44 participants who successfully completed the experiment. A wide range of hearing losses is evident from Figure 1; the better-ear four-frequency pure-tone average hearing losses (BE4FA; calculated as the average hearing loss at 0.5, 1, 2, and 4 kHz) ranged from 2 to 71 dB HL (hearing level). The average age of the participants was 6510.4 standard deviation (SD) years and the median age was 69 years. Fourteen of the 44 participants were classified as NH on the basis of a BE4FA less than 25 dB HL (cf. Clark, 1981). Of the 30 HI participants, 23 had a sensorineural hearing loss, three had a mixed (sensori-neural/conductive) hearing loss, and four had a conduct-ive hearing loss, based on air-bone threshold differences (British Society of Audiology & British Academy of Audiology Guidelines, 2007).
In Experiment 2, 25 participants (12 females) were recruited, again from local hearing clinics (n¼22) and employees of the MRC/CSO Institute of Hearing Research (n¼3, two of whom had taken part in Experiment 1). Their BE4FA hearing losses ranged from 1 to 70 dB HL (see Figure 1, right panel). The average age of these participants was 60 years (SD 15 years), and the median age was 65 years. Twelve of the 25 participants were classified as NH. Eleven of the 13 HI participants had a sensorineural hearing loss and two had a conductive hearing loss, based on air-bone threshold differences (British Society of Audiology & British Academy of Audiology Guidelines, 2007).
This study was approved by the West of Scotland research ethics service (WoS REC(4) 09/S0704/12). Informed written consent was obtained from all partici-pants prior to commencing experimentation.
Stimuli
In Experiments 1 to 3, the stimuli were male-talker IEEE sentences (Rothauser et al., 1969) embedded in a speech-shaped noise. The speech corpus consisted of 720 differ-ent sdiffer-entences of durations from 1360 to 2997 ms. The sentences were originally recorded at University College London using a native speaker of British English at a sampling rate of 48 kHz (Smith & Faulkner, 2006). Each sentence was then filtered to match the SII standard (American National Standards Institute 3.5, 1997) speech spectrum for normal vocal effort (i.e., flat response to 500 Hz then 9 dB/octave). Random (white) noise was generated in MATLAB (ver-sion 7.0.4, The Mathworks Inc.) and filtered using coef-ficients obtained from the average spectrum of the entire equalized male-talker sentence set. Both the speech and the noise were resampled to 32 kHz for playback. For simultaneous presentation, the duration of the noise was set to equal that of the particular sentence chosen for a trial, and then raised-cosine gates of 20-ms were applied to the onset and offset of the composite speech-and-noise stimulus.
In Experiments 1 to 3, in each trial, a sentence was chosen at random and presented in noise in two inter-vals: a reference interval with one value of speech-to-noise ratio (SNRR) and a target interval at a different
speech-to-noise ratio (SNRT¼SNRRþSNR). The
two values of SNRR were used in different blocks of
trials: 0 and þ6 dB (only 0 dB reference SNR was used in Experiment 2). In Experiment 1, the value of SNR was varied adaptively according to the participants’ per-formance using a three-down/one-up rule: the SNR was divided by the current step size after three correct responses or multiplied by the current step size after one incorrect response. The step sizes wereˇ3 for the first two reversals, ˇ2 for the next two reversals, andˇ1.5 for the last four reversals. Each block started with a
SNR of 12 dB. The geometric mean of SNR at
each of the last four reversals was taken as the JND. The actual presentation levels of the speech and noise were derived from the SNRs using a three-stage method. First, in the reference interval, the speech was presented at an A-weighted level of 75 dB SPL plus ½ of SNRRand the noise presented at an A-weighted level of
75 dB SPL minus ½ of SNRR, while in the target
inter-val, the speech was presented at 75 dB (A) plus ½ of SNRR plus ½ of SNR and the noise at 75 dB (A)
minus ½ of SNRR minus ½ of SNR. Second, the
[image:3.612.137.490.66.266.2]combined speech-plus-noise stimulus was then attenu-ated slightly to give an overall level of 75 dB (A) SPL (note that for the seven participants with hearing losses 565 dB HL, 85 dB (A) was used instead of 75 dB (A) to maintain overall audibility). Third, to reduce the possi-bility that participants could use the level of either the speech or the noise as a level cue, the overall levels of the combined stimuli forming the two intervals were roved independently by a maximum of 2 dB in randomized (rectangular distribution) increments of 0.1 dB.
Experiments 2 to 4 differed from Experiment 1 in the following ways. In Experiment 2, only a 0 dB reference SNR was used, and the values of SNR were chosen from a predefined set of values (0.5, 1, 2, 3, 4, 6, and 8 dB) rather than being calculated adaptively. Experiment 3 included nonroved conditions. In Experiment 4, the stimuli only consisted of 1-s duration noises—the speech was not used—with their level differ-ence set adaptively, starting at 6 dB.
Apparatus
For all experiments, participants were seated in a sound-proof audiometric booth, and the stimuli were presented diotically via a PC and soundcard (RME DIGI-96/8 PAD) and routed through an audio amplifier (Arcam A80) to circumaural headphones (AKG K702). Sound levels were calibrated with a 94-dB 1-kHz tone (Bruel & Kjaer 4230), and the headphones’ frequency response was verified with an artificial ear (Bruel & Kjaer 4152). A touch screen monitor was used to record participant responses.
Procedures
In all experiments, a two-interval, two-alternative forced-choice task was used. For each trial in Experiments 1 to 3, participants heard two presentations of speech-shaped noise, both containing the same sen-tence, separated by a 500-ms silent gap. Participants were instructed to listen carefully to the relative levels of both sentence and noise in each interval and then to decide, “Which sentence was clearer?” Participants responded by pressing a button on the touch screen to indicate theFirstorSecondinterval. In Experiment 4, a conventional level-discrimination task for comparison to the nonroved conditions in Experiment 3, participants were instructed to listen carefully to the level of the noise in each interval, decide which was quieter, and respond accordingly.
In Experiment 1, a practice condition in which SNRR
was 6 dB andSNR was 12 dB was used to introduce the task. A threshold was not recorded, and the run was ended as soon as participants had demonstrated their ability to perform the task. The conditions were then run in a pseudo-random order (one instance of each con-dition, randomly ordered, then a further two instances of each condition, randomly ordered). Three separate adap-tive tracks were run for each condition. We had initially planned to interleave tracks but rejected this, as it elon-gated the duration of each condition to the point where participant fatigue affected the results, causing a notice-able lack of convergence in pilot tests using experienced participants. In Experiment 2, a practice condition of six trials withSNR of 8 dB was used to introduce the task.
After practice, participants completed four blocks of 70 trials each, 10 trials at each of the seven values ofSNR, presented in randomized order (one participant com-pleted only three blocks of trials due to time constraints; however, the resultant JND in SNR was well within the range of all other participants). In Experiment 3, each participant completed three runs at SNRR¼0 dB and
SNRR¼ þ6 dB in three alternating roving and
nonrov-ing sessions on separate days (i.e., six runs per session over six sessions, resulting in nine threshold estimates per level-rove/reference-SNR condition). In Experiment 4, every participant completed three sessions of three adap-tive tracks each.
The JNDs results reported below are the geometric mean of the best two of the three measurements for each condition. Alternative methods of calculating the JND were assessed (namely the geometric mean of all three measurements, the second and third measurements, or the single best measurement), but none of these alter-native calculations produced substantially different results from those reported above. Throughout the Results section, geometric means are reported for Experiments 1, 3, and 4; arithmetic means are reported for Experiment 2.
Results
In Experiment 1, across both values of SNRRand all 44
participants, the JND (i.e., threshold) for a change in SNR was 3.2 dB, 95% CI [2.9, 3.5]. NH participants (n¼14) gave a JND of 2.6 dB, 95% CI [1.8, 3.4] in the 0 dB SNR condition and 3.3 dB, 95% CI [2.4, 4.2] in the þ6 dB SNR condition; HI participants (n¼30) gave a JND of 3.1 dB, 95% CI [2.6, 3.6] in the 0 dB SNR con-dition and 3.6 dB, 95% CI [3.1, 4.2] in theþ6 dB SNR condition (see Table 1). From a mixed-model analysis of variance, there was no significant difference between par-ticipant groups [F(1, 86)¼1.58,p>.05], but there was an effect across SNRR, albeit only 0.6 dB [F(1, 42)¼10.51,
p¼.002; 2¼0.20]. The interaction was not statistically significant [F(1, 42)¼1.15,p>.05]. Of the 30 HI partici-pants, 23 completed the experiment at an A-weighted presentation level of 75 dB SPL, and seven did so at a presentation level of 85 dB SPL. An independent samples
t test revealed no significant difference in mean thresh-olds between these two presentation levels.
Figure 2 shows the JNDs of each participant as a function of their hearing loss (see Methods section for definition). There were no significant correlations between the JNDs and hearing losses (as indicated by BE4FA) for SNRR¼0 or þ6 dB (Pearson
product-moment correlation coefficient r¼.26 and .06, respect-ively; both p>.05). JNDs and age were correlated for SNRR values (r¼.48 and .42; p¼.0049 and .0009,
correlated (r¼.44; p¼.003), so the partial correlation coefficients were also calculated. Controlling for the vari-ance due to age, the correlation between JNDs and hear-ing loss were near zero (r¼.02 and .03, respectively;
p.05). Conversely, age was significantly correlated with JNDs even when controlling for the variance due to hearing loss for SNRR¼0 andþ6 dB (r¼.42 and .36;
p¼.0049 and .0009, respectively).
The results from Experiment 2 are shown in Figure 3. Psychometric functions are shown for each participant (gray lines; mean in bold) for detecting changes in SNR from an SNRR equal to 0 dB. As is generally
found in many areas of psychophysical detection or com-parison (Macpherson & Akeroyd, 2014), the functions show a sigmoidal shape, with performance increasing as the change increases, but with a fair amount of variation across participants. JNDs were derived by fitting a logistic function to each psychometric function, optimized using the maximum log-likelihood method, and then calculating the SNR required to give a pro-portion correct of 0.79 (chosen as it corresponds to the target of the adaptive rule used in Experiment 1). Across all participants, the mean JND was 3.3 dB,
95% CI [2.7, 3.8]; that of the NH participants was 3.0 dB, 95% CI [2.1, 3.9], while that of the HI partici-pants was 3.5 dB, 95% CI [2.8, 4.3]. The difference across groups was not significant [t(23)¼ 0.946, p>.05]. Of the 13 HI participants, 11 completed the experiment at an A-weighted presentation level of 75 dB SPL, and two did so at a presentation level of 85 dB SPL. An inde-pendent samplesttest revealed no significant difference in mean thresholds between these two presentation levels.
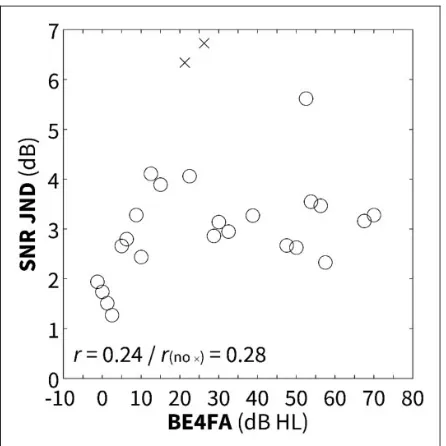
Figure 4 shows the JNDs from each participant as a function of their hearing loss. Two participants (shown as crosses in Figure 4) had much higher thresholds than the others: 6.3 and 6.7 dB, over two SD from the mean. With these data points removed as outliers, the mean JND across participants was 3.0 dB, 95% CI [2.6, 3.4]. This value closely matches that found for the same 0 dB SNRRcondition in Experiment 1. Including all
partici-pants, there was no correlation between hearing loss and JND (r¼.24, p>.05), nor age and JND (r¼.34;
[image:5.612.96.529.104.165.2]p>.05). The removal of the two outliers did not affect either (lack of) correlation when controlling for the vari-ance due to the significant correlation between age and Figure 2. Individual SNR JND results for all 44 (normal-hearing and hearing-impaired) participants of Experiment 1 in 0 dB (left panel)
andþ6 dB (right panel) reference SNR conditions as a function of hearing loss. Neither condition shows a statistically significant correlation
with hearing loss. SNR¼speech-to-noise ratio; JND¼just-noticeable difference; BE4FA¼better-ear four-frequency average. Table 1. Results of Experiment 1: Geometric Speech-to-Noise Ratio (SNR) Just-Noticeable Difference Means and 95% Confidence Intervals for Normal-Hearing (NH), Hearing-Impaired (HI), and all Participants (Rows) and for 0 dB, þ6 dB Reference SNR Conditions, and Averaged Across Reference SNR Conditions (Columns).
0 dBM 0 dB 95% CI þ6 dBM þ6 dB 95% CI BothM Both 95% CI
[image:5.612.126.499.147.384.2]hearing loss (r¼.52;p¼.008). An order effect was found in Experiment 2, where mean proportion correct aver-aged across allSNRs was significantly greater [paired-samplest(24)¼3.901,p¼.00068] when the greater SNR (SNRRþSNR) was in interval 2 than in interval 1
(0.83 and 0.71, respectively, averaged across all participants).
The results of Experiment 3 (see Table 2) showed, through a repeated-measures analysis of variance, a stat-istically significant 0.9 dB difference between the roved and nonroved conditions at SNRR¼ þ6 dB
[F(1, 3)¼26.99,p¼.014], but a nonsignificant difference of 0.2 dB between the roved and nonroved conditions at SNRR¼0 dB [F(1, 3)¼3.58,p>.05]. The mean
thresh-old in Experiment 3 was lower than in Experiment 1, most likely due to the fact that three of the four partici-pants who took part in Experiment 3 were among the best-performing participants from Experiment 1; the mean JND of those three participants across both con-ditions in Experiment 1 was 2.4 dB. The results of Experiment 4 showed that the mean JND for changes in level was 0.7 dB, 95% CI [0.2, 1.6].
Discussion
The JND in SNR of speech in noise was, on average, 3 dB across both normal and HI participants. While much larger than the conventional level JND of 1 dB, we are confident that our data represent an accurate measure of the JND for SNR, at least with the noise masker (a speech-shaped, unmodulated noise) used here. In everyday listening, changes in SNR less than 3 dB could potentially be noticeable by corresponding changes in listening effort or fatigue, particularly in con-tinuous speech with multiple opportunities for detecting a difference in SNR. The results of Experiments 1 and 2 were almost identical despite one using adaptive and the other fixed procedures. Furthermore, two largely inde-pendent groups of participants were employed in each experiment (i.e., only three NH participants took part in both experiments). In the only known prior study (Killion, 2004), listeners performed at chance (50%) for a 2 dB difference in SNR but at approximately 90% cor-rect for a 4 dB difference in SNR. A linear interpolation between these values would suggest 79% correct for a 3.4 dB difference in SNR, consistent with our results. The current results, however, suggest a 50% threshold much lower than 2 dB; the psychometric function estimated here is much shallower than the steep function implied by Killion’s results.
[image:6.612.59.282.65.279.2]A JND in SNR of 3 dB is substantially greater than the values for JND in level of broadband sounds previ-ously reported, for example, 1.4 dB for HI listeners (Whitmer & Akeroyd, 2011) and 0.7–0.9 dB for NH lis-teners (Buus, Florentine, & Zwicker, 1995; Miller, 1947; Figure 4. Just-noticeable difference in speech-to-noise ratio
[image:6.612.60.283.401.624.2](SNR JND) thresholds as a function of better-ear four-frequency average (BE4FA) pure-tone thresholds for all 25 participants of Experiment 2. Outliers are shown as crosses. SNR JND and hearing loss was not correlated including the outliers (r¼.24; p>.05), nor without the outliers when accounting for the variance due to the correlation between hearing loss and age (r¼.28; p>.05).
Montgomery, 1935), and found here in Experiment 4 (0.7 dB). We suggest that this difference between conven-tional level discrimination and SNR discrimination may be related to the added difficulty of estimating SNR, given that SNR discrimination requires monitoring the levels of both the speech and noise in each interval. Less clear, however, is the reason why the JNDs were signifi-cantly lower (better by 0.6 dB) in Experiment 1 for SNRR¼0 dB than for SNRR¼ þ6 dB condition. It is
possible that differences inclearnessare simply perceived more easily when the speech was less intelligible. The JND is not expected to be constant as a function of SNR and will become very large when either the speech or noise is masked by the other, resulting in a U-shaped function when plotting JND as a function of SNR. Theoretically, the JND could be at a minimum at the steepest point on the slope of the psychometric func-tion relating intelligibility to SNR.
After accounting for the significant correlations between age and hearing loss in both Experiment 1 and 2, neither experiment showed a correlation between hear-ing loss and JND. Many previous studies have shown a relationship between speech-in-noise intelligibility and hearing loss (e.g., Plomp & Mimpen, 1979; Smoorenburg, 1992), while fewer studies (e.g. Dirks, Morgan, & Dubno, 1982) have found supra-threshold speech understanding in noise to be independent of hear-ing loss. The lack of correlation here may be due to the basis of judgments being (a) supra-threshold and (b) related to level discrimination performance, which was previously found to not correlate with hearing loss (Whitmer & Akeroyd, 2011). The correlation between age and JND in Experiment 1 may be an indication of (a) the task of comparing speech and noise simultan-eously and sequentially being difficult and increasingly so with age and (b) a relationship to supra-threshold speech-intelligibility deficits.
We have identified limitations of this study indicating that the results may be an over- or underestimate of the SNR JND. The JND of 3 dB may be an overestimate because the sentences and noise maskers used herein were gated on and off together. This would not occur in real-life listening, and it may be easier to detect differ-ences in SNR when the noise begins and ends before and after the speech. Also, ongoing speech in noise may offer multiple looks that allow smaller changes in SNR to be
noticed, or the potential subsequent decreases in effort or fatigue to be noticed.
One potential source of underestimation was inad-equate level roving. The 4-dB level-roving range (2 dB) used in this study was less than the range iden-tified by Green (1988) as well as Fantini and Moore (1994), who derived the smallest threshold that can be obtained from level cues when overall levels are roved over a given range. A broad rule of thumb is that the range used should be a factor of three greater than the JND. Our use of a smaller level-roving range was due to concerns regarding the general audibility of the speech across intervals, but unfortunately it may have been insufficient to completely eliminate the possibility of using the absolute level of the speech as a cue. It is pos-sible therefore that the JND for SNR would be greater than 3 dB had the range of level-roving been greater.
Another potential factor leading to an underestimate of SNR JND was the order of stimuli. Order effects were evident in Experiment 2 in that a significant difference in mean proportion correct was found when the target (the greater SNR) was presented in interval 1 and interval 2. Mean proportion correct was significantly higher for interval 2 by 12%, indicating intelligibility increased on the second presentation of the stimuli. Other studies have found similar effects (e.g., Thwing, 1956), but Pollack (1959) showed that repeated presentations of the same piece of recorded speech show smaller effects and that using the same noise in repeated presentations results in less of an improvement as using different noises. It seems plausible therefore that our results could show a bias toward lower JND SNRs, underestimating the SNR JND based on increased intelligibility in the second interval.
[image:7.612.58.566.104.152.2]It is possible that asking our participants to judge the change inclarityof the sentences in noise—as opposed to judging any feature change—has resulted in a measure of speech intelligibility JND that may depend on the par-ticular speech and noise used. That is, as psychometric function slopes vary with stimuli (Macpherson & Akeroyd, 2014), it is possible that the JND is represen-tative of the percent correct change equivalent to 3-dB change in SNR for IEEE sentences presented in same-spectrum noise. For different stimuli with different psy-chometric function slopes, the SNR JND might change whereas the percent correct JND remains fixed. Table 2. Results of Experiment 3: Geometric Means and 95% Confidence Intervals for Roved- and Nonroved-Level Conditions (Rows) and for 0 dB,þ6 dB Reference SNR Conditions, and Averaged Across Both Reference SNR Conditions (Columns). Rightmost Columns Show the Results of Experiment 4: Mean Level Just-Noticeable Difference (JND) and 95% Confidence Interval.
0 dBM 0 dB 95% CI þ6 dBM þ6 dB 95% CI BothM Both 95% CI Level JND Level 95% CI
Testing with stimuli having different speech intelligibility slopes could clarify this issue. The threshold for perceiv-ing a change in clarity may differ from the threshold for perceiving any difference in itself (e.g., had we used a same/different task with limited instructions on how potential differences would manifest themselves). Our reason for not using a same/different task was that with identical sentences in both intervals of each trial, and at times small differences in SNR, we felt that par-ticipants might default to responding samethereby arti-ficially inflating thresholds.
The noise masker used in this series of experiments was based on the average spectrum of the entire male-talker IEEE corpus without any amplitude modulation applied. In many ways, this masker acts as a reference point for all other potential maskers, and we expect that the JND may change with variations away from it. Alcantara et al. (2003) found that for speech intelligibil-ity, performance was better in modulated noise than in steady noise. However, using modulated noises, such as multi-talker babble, might make the current SNR dis-crimination task more difficult, as the level of the con-current speech signal and masker would vary more than for steady maskers. When fluctuating maskers are used, psychometric functions relating intelligibility to SNR have been found to be shallower than those for steady maskers (Macpherson & Akeroyd, 2014). Furthermore, JNDs might also increase in a real-life scenario with mul-tiple distracters and reverberation present.
The minimal clinically important difference is a meas-ure used to specify the smallest difference in an interven-tion which a patient can perceive (Jaeschke, Singer, & Guyatt, 1989). The SNR JND of 3 dB measured here indicates the lower bound of the minimal clinically important difference for SNR improvement; that is, a change of 3 dB SNR indicates the threshold of the per-ceptual relevance (as opposed to speech intelligibility improvement) of those features of hearing aids designed to increase SNR. Therefore, regardless of the strategy used to achieve it, the data presented here indicate that a noise reduction scheme—or directional microphone or indeed any feature for increasing SNR—in a hearing aid should provide at least 3 dB SNR improvement in order to provide a reliable and consistently noticeable benefit for HI listeners.
Declaration of Conflicting Interests
The authors declared no potential conflicts of interest with respect to the research, authorship, and/or publication of this article.
Funding
The authors disclosed receipt of the following financial support for the research, authorship, and/or publication of this article: The Scottish Section of IHR is supported by intramural
funding from the Medical Research Council (grant number U135097131) and the Chief Scientist Office of the Scottish Government.
Author Contributions
D. M., W. W., and M. A. designed the experiments. Testing and data collection were performed by D. M. D.M. drafted the manuscript. W. W. and M. A. revised the manuscript. All authors approved the final version of the manuscript for submission.
Acknowledgments
We thank Prof. Andrew Oxenham, Prof. Brian Moore, and an anonymous reviewer for comments on this manuscript, Dr. Michael Stone for supplying the stimuli, Dr. W. Owen Brimijoin for comments on the original draft, and Patrick Howell, Kay Foreman, and Jack Holman for helping collect the experimental data.
References
Alcantara, J. L., Moore, B. C. J., Kuhnel, V., & Launer, S. (2003). Evaluation of the noise reduction system in a com-mercial digital hearing aid. International Journal of Audiology,42, 34–42.
American National Standards Institute. (1997). Methods for calculation of the speech intelligibility index (ANSI 3.5-1997). New York, NY: Acoustical Society of America. Amlani, A. M. (2001). Efficacy of directional microphone hear-ing aids: A meta-analytical approach. Journal of the American Academy of Audiology,12, 202–214.
British Society of Audiology. Recommended procedures for pure tone audiometry using a manually operated instru-ment.British Journal of Audiology,15, 213–216.
British Society of Audiology, & British Academy of Audiology. (2007). Guidance on the use of real ear measurements to verify the fitting of digital signal processing hearing aids. Retrieved from http://www.thebsa.org.uk/wp-content/ uploads/2014/04/REM.pdf
Buus, S., Florentine, M., & Zwicker, T. (1995). Psychometric functions for level discrimination in cochlearly impaired and normal listeners with equivalent threshold masking. Journal of the Acoustical Society of America,98, 853–861.
Clark, J. G. (1981). Uses and abuses of hearing loss classifica-tion.ASHA,23, 493–500.
Dirks, D. D., Morgan, D. E., & Dubno, J. R. (1982). A pro-cedure for quantifying the effects of noise on speech recog-nition in noise.Journal of Speech and Hearing Disorders,47, 114–123.
Dittberner, A. B., & Bentler, R. A. (2003). Interpreting the Directivity Index (DI).Hearing Review,10, 16–19. Fantini, D. A., & Moore, B. C. J. (1994). A comparison
of the effectiveness of across-channel cues available in comodulation masking release and profile analysis tasks. Journal of the Acoustical Society of America, 96, 3451–3462.
Hawkins, D. B., & Yacullo, W. S. (1984). Signal-to-noise ratio advantage of binaural hearing aids and directional micro-phones under different levels of reverberation. Journal of Speech and Hearing Disorders,49, 278–286.
Jaeschke, R., Singer, J., & Guyatt, G. H. (1989). Measurement of health status: Ascertaining the minimal clinically import-ant difference.Controlled Clinical Trials,10, 407–415. Killion, M. C. (2004). Myths about hearing in noise and
dir-ectional microphones.Hearing Review,11, 1472–1973. Kochkin, S. (2000). MarkeTrak V: “Why my hearing aids are
in the drawer”: The consumers’ perspective. Hearing Journal,53, 34–41.
Macpherson, A., & Akeroyd, M. A. (2014). Variations in the slope of the psychometric functions for speech intelligibility: A systematic survey.Trends in Hearing,18, 1–26.
McCormack, A., & Fortnum, H. (2013). Why do people with hearing aids not wear them? International Journal of Audiology,52, 360–368.
Miller, G. A. (1947). Sensitivity to changes in the intensity of white noise and its relation to masking and loudness.
Journal of the Acoustical Society of America,19, 609–619. Montgomery, H. C. (1935). Influence of experimental
tech-nique on the measurement of differential sensitivity of the ear.Journal of the Acoustical Society of America,7, 39–43. Naylor, G., & Johannesson, R. B. (2009). Long-term
signal-to-noise ratio at the input and output of amplitude-compression systems. Journal of the American Academy of Audiology,20, 161–171.
Plomp, R., & Mimpen, A. M. (1979). Speech-reception thresh-old for sentences as a function of age and noise level.
Journal of the Acoustical Society of America,66, 1333–1342. Pollack, I. (1959). Message repetition and message reception.
Journal of the Acoustical Society of America,31, 1509–1515.
Ricketts, T. A. (2001). Directional hearing aids. Trends in Amplification,5, 139–176.
Rothauser, E. H., Chapman, W. D., Guttman, N., Hecker, M. H. L., Nordby, K. S., Silbiger, H. R.,. . .;Weinstock, M. (1969). IEEE recommended practice for speech quality measurements. IEEE Transactions on Audio and Electroacoustics,17, 225–246.
Smith, M. W., & Faulkner, A. (2006). Perceptual adaptation by normally hearing listeners to a simulated ‘hole’ in hearing.
Journal of the Acoustical Society of America, 120, 4019–4030.
Smoorenburg, G. F. (1992). Speech reception in quiet and in noisy conditions by individuals with noise-induced hearing loss in relation to their tone audiogram. Journal of the Acoustical Society of America,91, 421–4437.
Thwing, E. J. (1956). Effect of repetition on articulation scores for PB words.Journal of the Acoustical Society of America,
28, 302–303.
Valente, M., Fabry, D., & Potts, L. G. (1995). Recognition of speech in noise with hearing aids using dual microphones.
Journal of the American Academy of Audiology,6, 440–449. Walden, B. E., Surr, R. K., Cord, M. T., & Pavlovic, C. V. (2000). Comparison of benefits provided by different hear-ing aid technologies.Journal of the American Academy of Audiology,11, 540–560.
Whitmer, W. M., & Akeroyd, M. A. (2011). Level discrimin-ation of speech sounds by hearing-impaired individuals with and without hearing amplification. Ear and Hearing, 32, 391–398.