Clinical diagnostic model for sciatica
developed in primary care patients with low
back-related leg pain
Siobha´n Stynes*, Kika Konstantinou, Reuben Ogollah, Elaine M. Hay, Kate M. Dunn
Arthritis Research UK Primary Care Centre, Research Institute for Primary Care & Health Sciences, Keele University, Keele, Staffordshire, United Kingdom
Abstract
Background
Identification of sciatica may assist timely management but can be challenging in clinical practice. Diagnostic models to identify sciatica have mainly been developed in secondary care settings with conflicting reference standard selection. This study explores the chal-lenges of reference standard selection and aims to ascertain which combination of clinical assessment items best identify sciatica in people seeking primary healthcare.
Methods
Data on 394 low back-related leg pain consulters were analysed. Potential sciatica indica-tors were seven clinical assessment items. Two reference standards were used: (i) high confidence sciatica clinical diagnosis; (ii) high confidence sciatica clinical diagnosis with confirmatory magnetic resonance imaging findings. Multivariable logistic regression models were produced for both reference standards. A tool predicting sciatica diagnosis in low back-related leg pain was derived. Latent class modelling explored the validity of the refer-ence standard.
Results
Model (i) retained five items; model (ii) retained six items. Four items remained in both mod-els: below knee pain, leg pain worse than back pain, positive neural tension tests and neuro-logical deficit. Model (i) was well calibrated (p = 0.18), discrimination was area under the receiver operating characteristic curve (AUC) 0.95 (95% CI 0.93, 0.98). Model (ii) showed good discrimination (AUC 0.82; 0.78, 0.86) but poor calibration (p = 0.004). Bootstrapping revealed minimal overfitting in both models. Agreement between the two latent classes and clinical diagnosis groups defined by model (i) was substantial, and fair for model (ii).
Conclusion
Four clinical assessment items were common in both reference standard definitions of sciat-ica. A simple scoring tool for identifying sciatica was developed. These criteria could be a1111111111
a1111111111 a1111111111 a1111111111 a1111111111
OPEN ACCESS
Citation: Stynes S, Konstantinou K, Ogollah R, Hay EM, Dunn KM (2018) Clinical diagnostic model for sciatica developed in primary care patients with low back-related leg pain. PLoS ONE 13(4): e0191852.
https://doi.org/10.1371/journal.pone.0191852
Editor: Mikko Juhani Lammi, University of Umeå, SWEDEN
Received: January 23, 2017
Accepted: January 12, 2018
Published: April 5, 2018
Copyright:©2018 Stynes et al. This is an open access article distributed under the terms of the
Creative Commons Attribution License, which permits unrestricted use, distribution, and reproduction in any medium, provided the original author and source are credited.
Data Availability Statement: The anonymised data underlying this study are available in the paper and its Supporting Information files. The data used in this analysis are owned by The Arthritis Research UK Primary Care Centre, to which further queries related to data access may be submitted. The Arthritis Research UK Primary Care Centre has established data sharing arrangements to support joint publications and other research
used clinically and in research to improve accuracy of identification of this subgroup of back pain patients.
Introduction
Approximately two thirds of patients with low back pain (LBP) also report leg pain [1,2]. Once the possibility of serious spinal pathology (‘red flags’) or other non-spinal reasons for the leg pain are ruled out, the differential diagnosis is between leg pain due to nerve root involvement (sciatica) or non-specific referred pain from other structures in the low back. Making this diag-nostic decision is recognised as difficult [3] and clinicians can disagree on diagnosis[4]. It is not always feasible or necessary to make specific diagnoses in a primary care setting (disc her-niation, spinal stenosis) but early identification and differentiation of symptoms of low back-related leg pain (LBLP) (sciatica versus referred leg pain) are important for communicating likely diagnosis and prognosis to patients, formulating treatment plans and guiding the need for timely referrals to specialist services.
There is no universally agreed definition or clinical description of sciatica [5–7]. This has led to variability, limiting the generalisability of study findings in this subgroup of LBP patients, as the same disease entity may not be evaluated across studies. Individual items from history [8] and physical examination [9–11] have mostly shown poor diagnostic performance for identifying sciatica when compared to findings from MRI or surgery. Combining clinical assessment items is recommended to improve diagnostic performance [9,12]. In primary care, and other settings, clinicians assessing LBP patients integrate several patient characteristics and symptoms to form a diagnosis. Diagnosis in this case is therefore inherently multivariable [13]. Diagnostic models are tools that combine predictors to estimate the probability that a condition of interest is present in an individual with a certain predictor profile [14].
Previously published diagnostic models for LBLP [15–20] have variable methods of refer-ence standard, predictor selection, and patient settings (primary care versus secondary care). Magnetic resonance imaging (MRI) is often used as the reference standard, but can result in misclassification, as positive MRI findings are found in asymptomatic individuals [21], and patients with nerve root symptoms may have normal MRIs [10]. In the absence of a well-accepted reference standard, expert clinical opinion may be an appropriate reference standard for diagnosis, providing it is reasonably reliable [22]. When clinicians diagnose LBLP with high levels of diagnostic confidence, reliability indexes are high (4).
To date, there is no consensus on what cluster of items best identify sciatica and there is no agreed gold standard for diagnosing sciatica. This study aims to identify the combination of items from clinical assessment that best identify sciatica in primary care consulters with LBLP, and to develop a diagnostic prediction model. To explore the challenges of reference standard selection for the diagnosis of sciatica, two reference standards (clinical diagnosis +/- MRI) were compared. Guidelines for Transparent Reporting of a multivariable model for Individual Prognosis or Diagnosis (The Tripod statement) [23] were followed.
Materials and methods
Ethics statement
All participants in the ATLAS study provided written consent to take part in the study, by sign-ing a consent form in the presence of a trained research nurse, at the ATLAS research clinics. Ethical approval for the ATLAS study, including the consent procedure, was granted by the South Birmingham Research Ethics committee, reference number 10/H1207/82.
decision regarding access to the data is made subject to the National Research Ethics Service ethical approval first provided for the study and to new analysis being proposed. Further information on our data sharing procedures can be found on the Centre’s website (http://www.keele.ac.uk/pchs/ publications/datasharingresources/) or by emailing the Centre’s data manager (primarycare. [email protected]).
Funding: SS was supported by an National Institute for Health Research/Chief Nursing Officer Clinical Doctoral Research Fellowship (CDRF-2010-055). KK was supported by a Higher Education Funding Council for England/National Institute for Health Research Senior Clinical Lectureship. EMH is an National Institute for Health Research Senior Investigator. The funders had no role in study design, data collection and analysis, decision to publish, or preparation of the manuscript.
Source of data and participants
Data from primary care consulters with LBLP taking part in the ATLAS (Assessment and
Treatment of Leg pain Associated with the Spine) observational cohort study [24] was
ana-lysed. Ethical approval for the ATLAS study was granted by the South Birmingham Research Ethics committee, reference number 10/H1207/82.
As part of the ATLAS study, patients completed questionnaires, underwent a standardised clinical assessment by one of seven musculoskeletal physiotherapists, and had a lumbar spine MRI within two weeks of their assessment (providing there were no clinical contraindications to the procedure). At the end of the clinical assessment, physiotherapists documented (i) a diagnosis of either sciatica or referred leg pain (ii) confidence (0–100%) in their diagnosis. Cli-nicians made their diagnosis based on information from history and physical examination findings only, the MRI findings were not part of the diagnostic process. For the purposes of the study, the term sciatica signifies spinal nerve root involvement. The MRI scans were scored by a senior consultant musculoskeletal radiologist, blind to any clinical information about the patient other than that the patient had LBLP (not specifying which leg). The radiologist pro-vided a clinical report indicating definite, possible or absence of nerve root compression.
Outcome
The outcome of interest in this study was a diagnosis of sciatica. Two reference standards were chosen for the diagnostic model:
Model (i): High confidence (80%) sciatica clinical diagnosis
Diagnosis of sciatica for model (i) reference standard was when the clinician documented the presence of leg pain was due to sciatica and they were80% confident in their diagnosis. A cut off point of80% diagnostic confidence was used because at this criterion, reliability among clinicians diagnosing LBLP improves considerably [4].
Model (ii): High confidence (80%) sciatica clinical diagnosis with confirmatory MRI findings The second reference standard combined the clinician’s diagnosis with MRI findings (pos-sible/definite) of nerve root compression. Using clinical diagnosis alone as a reference stan-dard may leave diagnosis open to incorporation bias as the reference stanstan-dard is not blind to knowledge of the predictors under consideration [25].
Predictors
Nine candidate predictors were a priori chosen for potential inclusion in the diagnostic model from the larger set of available self-report and clinical assessment findings. Predictor selection was guided by (a) expert consensus from a Delphi study on items from clinical assessment considered most important for distinguishing sciatica from non-specific leg pain in LBLP patients [26] and (b) items used in other multivariable diagnostic models shown to have acceptable diagnostic accuracy for identifying sciatica [15–20].
Small or zero frequencies identified within 2x2 table cells made logistic regression using one variable unfeasible (myotomes). The three tests of myotomes, reflexes and sensation were therefore combined in a clinically acceptable way [27] to one variable: ‘any deficit on neurolog-ical testing’. Seven predictors remained for selection in the multivariable model (S1 Tablefor predictor selection and their measurement level).
Sample size
sample size was adequate to satisfy the recommended guide of 10 events per predictor [28] with nine initial predictors and 100 patients in the smallest outcome category (patients diag-nosed with referred pain for model (i)).
Statistical analysis
Univariable logistic regression analysis quantified the relationship between each individual predictor variable and the presence of sciatica based on both reference standards. Multiple logistic regression with backwards stepwise selection (p = 0.05) was performed using all a pri-ori selected predictor variables. Complete case analysis was planned because all but one of the baseline predictors had no missing data. Contribution of each predictor variable within the final model was presented as beta coefficients and odds ratios (ORs) with 95% confidence intervals (CI).
Measures of calibration and discrimination assessed predictive performance of the models. Calibration was assessed graphically using the observed outcome plotted against the predicted probability of the outcome obtained from the fitted logistic regression model using the Lowess smoothing curve technique [29]. Perfect calibration shows a slope on the 45 degree line, hence deviation of the line from the diagonal indicates lack of calibration. The plot was supplemented with the Hosmer and Lemeshow goodness-of-fit test [27]. P0.05 supports the goodness-of-fit.
Discrimination (the ability of the model to distinguish between those who do and do not have the sciatica diagnosis) was summarised using the area under the curve (AUC) of the receiver operating characteristic (ROC) curve. An AUC of 0.5 indicates no discrimination whereas AUC of 1.0 indicates perfect discrimination [27].
Internal validity of the final model was assessed using 1000 bias corrected bootstrap sam-ples. An adjusted AUC was calculated for the bootstrapped model to reflect the discriminative performance of the internally validated model.
Characteristics of the population used in diagnostic modelling were compared to those excluded from analyses due to application of high confidence in diagnosis criteria, using descriptive statistics.
To address the issue of an imperfect reference standard, a probabilistic statistical alternative using latent class (LC) modelling was used [30]. This method specifies a model so that
response probabilities of clinical assessment items used to model the classes can be derived without knowing the patient’s true classification (diagnosis) [31]. The technique identifies latent or underlying groups of patients based on their response to clinical assessment items, and circumvents the need for a reference standard. It is therefore a useful comparator to the other analyses. Each patient was reclassified according to a two solution latent class model. It is assumed that the two latent classes correspond to one class of patients in which the target con-dition is present and one class in which the target concon-dition is absent [31]. Concordance between the clinical diagnosis (+/- MRI) groups and the two latent classes was calculated using percentage agreement and a kappa statistic.
MPlus v5 was used for LC modelling. SPSS v21 and Stata v13 were used for the diagnostic model and descriptive analyses.
Scoring tool
Sensitivity analysis
An additional multivariable logistic regression model was performed using MRI only as the reference standard so as to compare to models published in the literature that have used MRI findings only as reference standard. The log ORs, corresponding CIs and AUCs of this addi-tional model was compared to the original two models.
Results
Participants
Of the 609 LBLP consulters who participated in the ATLAS study, 395 participants were included in the diagnostic model development analysis and LC modelling. Reasons for exclud-ing patients from the diagnostic model analysis were (i) if clinician confidence in diagnosis (for either referred leg pain or sciatica)<80% (n = 173), (ii) patients did not have an MRI scan (an additional 41 patients).
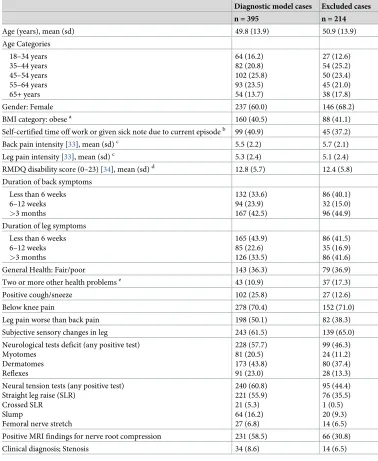
Table 1displays characteristics of patients in the diagnostic model development sample (n = 395) and those not included in model building analyses (n = 214). The excluded group had a greater proportion of patients aged over 65 years (18% v 14%), higher proportion of females (68% v 60%), more patients with leg symptoms for over 3-months (42% v 33%) and more comorbidity (17%2 comorbidities v 11%). Comparing clinical characteristics, a greater proportion of patients in the diagnostic model group had a positive cough/sneeze (25.8% v 12 .6%), leg pain worse than back pain (50.1% v 38.3%), neurological deficits (57.7% v 46.3%) and positive neural tension tests (60.8% v 44.4%).
Of the 395 patients included in the analysis, 75% (n = 295) were diagnosed with sciatica using model (i) reference standard. Using model (ii) reference standard, where clinical diagno-sis was corroborated by positive MRI findings, 51% (n = 200) were diagnosed with sciatica.
Class one identified by LC modelling had 244 patients, class two had 151 patients. The over-all percentage agreement between the clinical diagnosis groups defined by model (i) and the two latent classes was 83%, with a kappa coefficient of 0.62 (95% CI 0.54, 0.70) indicating sub-stantial agreement [35]. This suggests the clinical diagnosis reference standard was adequate. Comparing the two latent classes to groups diagnosed using high confidence clinical diagnosis and confirmatory MRI findings (model ii), showed agreement of 72% and kappa 0.43 (95% CI 0.35, 0.52) indicating moderate agreement.
Model development
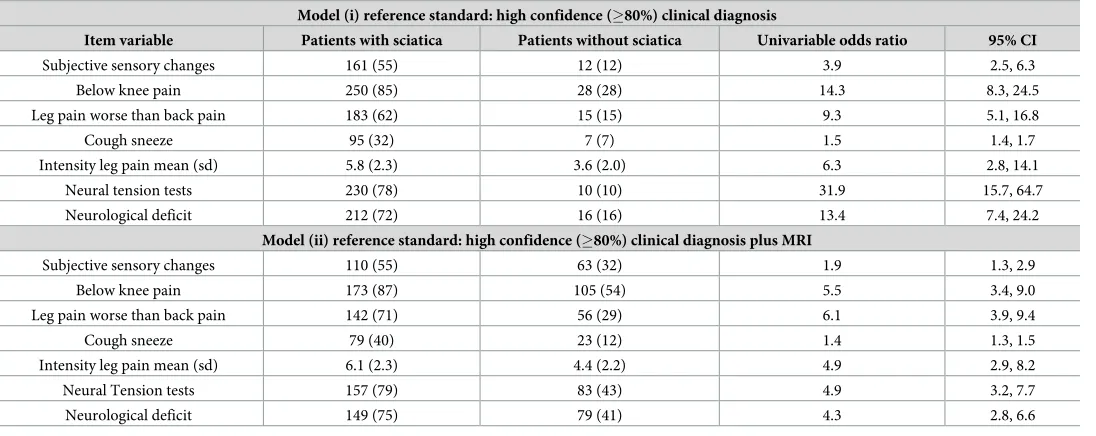
Following univariable analysis, all predictor variables were significantly associated with both reference standard outcomes (p<0.001) (Table 2). The ORs for model (i) were all higher than model (ii). The greatest strength of association with model (i) diagnosis was ‘positive neural tension tests’ with very high ORs of 31.9. For model (ii), ‘leg pain worse than back pain’ had the highest association with the diagnosis (6.1; 3.9, 9.4).
Model specification
Table 1. Characteristics of patients eligible and ineligible for diagnostic model development data.
Diagnostic model cases Excluded cases
n = 395 n = 214
Age (years), mean (sd) 49.8 (13.9) 50.9 (13.9)
Age Categories 18–34 years 35–44 years 45–54 years 55–64 years 65+ years 64 (16.2) 82 (20.8) 102 (25.8) 93 (23.5) 54 (13.7) 27 (12.6) 54 (25.2) 50 (23.4) 45 (21.0) 38 (17.8)
Gender: Female 237 (60.0) 146 (68.2)
BMI category: obesea 160 (40.5) 88 (41.1)
Self-certified time off work or given sick note due to current episodeb 99 (40.9) 45 (37.2)
Back pain intensity [33], mean (sd)c 5.5 (2.2) 5.7 (2.1)
Leg pain intensity [33], mean (sd)c 5.3 (2.4) 5.1 (2.4)
RMDQ disability score (0–23) [34], mean (sd)d 12.8 (5.7) 12.4 (5.8)
Duration of back symptoms
Less than 6 weeks 6–12 weeks >3 months
132 (33.6) 94 (23.9) 167 (42.5) 86 (40.1) 32 (15.0) 96 (44.9)
Duration of leg symptoms
Less than 6 weeks 6–12 weeks >3 months
165 (43.9) 85 (22.6) 126 (33.5) 86 (41.5) 35 (16.9) 86 (41.6)
General Health: Fair/poor 143 (36.3) 79 (36.9)
Two or more other health problemse 43 (10.9) 37 (17.3)
Positive cough/sneeze 102 (25.8) 27 (12.6)
Below knee pain 278 (70.4) 152 (71.0)
Leg pain worse than back pain 198 (50.1) 82 (38.3)
Subjective sensory changes in leg 243 (61.5) 139 (65.0)
Neurological tests deficit (any positive test) Myotomes Dermatomes Reflexes 228 (57.7) 81 (20.5) 173 (43.8) 91 (23.0) 99 (46.3) 24 (11.2) 80 (37.4) 28 (13.3)
Neural tension tests (any positive test) Straight leg raise (SLR)
Crossed SLR Slump
Femoral nerve stretch
240 (60.8) 221 (55.9) 21 (5.3) 64 (16.2) 27 (6.8) 95 (44.4) 76 (35.5) 1 (0.5) 20 (9.3) 14 (6.5)
Positive MRI findings for nerve root compression 231 (58.5) 66 (30.8)
Clinical diagnosis; Stenosis 34 (8.6) 14 (6.5)
Abbreviations: sd, standard deviation; BMI, body mass index; RMDQ, Roland Morris Disability Questionnaire; MRI, magnetic resonance imaging.
All figures are frequencies (percentages) unless stated otherwise as mean (sd). a
BMI obese category = 30 to 40+kg/m2 b
Applicable to only those working n = 365 c
Pain intensity measured using the mean of three 0 to 10 numerical rating scales for least and usual back pain over the previous 2 weeks and current back pain intensity
d
Roland Morris Disability Questionnaire leg pain version with scores from 0–23 with higher scores indicating higher disability
e
The comorbidity health problems included chest problems, heart problems, raised blood pressure, diabetes, circulation problems in the legs
Table 2. Univariable associations between predictor variables and outcomes.
Model (i) reference standard: high confidence (80%) clinical diagnosis
Item variable Patients with sciatica Patients without sciatica Univariable odds ratio 95% CI
Subjective sensory changes 161 (55) 12 (12) 3.9 2.5, 6.3
Below knee pain 250 (85) 28 (28) 14.3 8.3, 24.5
Leg pain worse than back pain 183 (62) 15 (15) 9.3 5.1, 16.8
Cough sneeze 95 (32) 7 (7) 1.5 1.4, 1.7
Intensity leg pain mean (sd) 5.8 (2.3) 3.6 (2.0) 6.3 2.8, 14.1
Neural tension tests 230 (78) 10 (10) 31.9 15.7, 64.7
Neurological deficit 212 (72) 16 (16) 13.4 7.4, 24.2
Model (ii) reference standard: high confidence (80%) clinical diagnosis plus MRI
Subjective sensory changes 110 (55) 63 (32) 1.9 1.3, 2.9
Below knee pain 173 (87) 105 (54) 5.5 3.4, 9.0
Leg pain worse than back pain 142 (71) 56 (29) 6.1 3.9, 9.4
Cough sneeze 79 (40) 23 (12) 1.4 1.3, 1.5
Intensity leg pain mean (sd) 6.1 (2.3) 4.4 (2.2) 4.9 2.9, 8.2
Neural Tension tests 157 (79) 83 (43) 4.9 3.2, 7.7
Neurological deficit 149 (75) 79 (41) 4.3 2.8, 6.6
Abbreviations: CI, confidence intervals; sd, standard deviation; NS, non-significant at p0.05; MRI, magnetic resonance imaging
https://doi.org/10.1371/journal.pone.0191852.t002
Table 3. Multivariable associations between the clinical assessment items and sciatica for model (i) and model (ii).
Item variable Model (i) Model (ii)
Beta OR (95% CI) Beta OR (95% CI)
Subjective sensory changes 0.98 2.66 (1.20, 5.90) NS NS
Below knee pain 1.83 6.25 (2.80, 13.94) 0.76 2.13 (1.19, 3.83)
Leg pain worse than back pain 1.52 4.55 (1.89, 10.99) 1.08 2.94 (1.77, 4.89)
Leg pain intensity NS NS 0.14 1.15 (1.03, 1.29)
Positive cough / sneeze NS NS 0.92 2.50 (1.34, 4.65)
Neural Tension tests 3.07 21.63
(9.00,51.97)
0.56 1.76 (1.03, 3.00)
Neurological deficit 2.14 8.50 (3.80,19.01) 1.04 2.81 (1.69, 4.69)
Intercept -3.25 -2.98
AUC 0.95 (0.93, 0.98) 0.82 (0.78, 0.86)
Abbreviations: OR, odds ratios; CI, confidence intervals; AUC, area under the receiver operating characteristic curve; NS, non-significant at p0.05
Model (i): Confidence80% sciatica clinical diagnosis
Model (ii): Confidence80% sciatica clinical diagnosis plus confirmatory magnetic resonance imaging (MRI) findings
The predicted probability of sciatica can be calculated using the following formulae
Model (i): Probability (sciatica+) = 1/ 1+exp -[-3.25 + (subjective sensory changes x 0.98) + (below knee pain x 1.83) + (leg pain worse than back pain x 1.52) + (neural tension x 3.07) + (neurological deficit x 2.14)].
Model (ii): Probability (sciatica+) = 1/ 1+exp -[-2.98 + (below knee pain x0.76) + (leg pain worse than back pain x 1.08) + (intensity leg pain x 0.14) + (positive cough/sneeze x 0.92) + (neural tension x 0.56) + (neurological deficit x 1.04)]
[image:7.612.200.577.407.557.2]Model performance
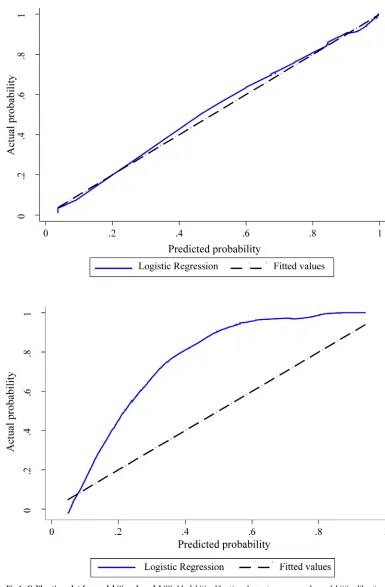
The shape of the slope on the calibration plots show that model (i) is well calibrated and model (ii) less well calibrated (Fig 1). The Hosmer and Lemeshow statistical test for the observed data for model (i) supported the goodness-of-fit of the model (χ2= 11.4, p = 0.18) whereas model (ii) showed poor calibration (χ2= 22.4 p = 0.004).
Discrimination was almost perfect for model (i) (AUC 0.95, 95% CI 0.93, 0.98) and excel-lent for model (ii) (AUC 0.82, CI 0.78, 0.86). Adjusted AUCs for both models were unaltered following bootstrapping.
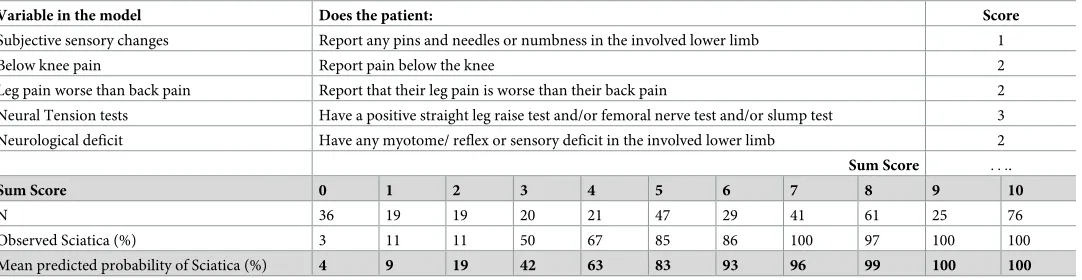
A simple scoring method, for the better performing model (i), was developed by converting the beta coefficient values into whole numbers. A total score of 10 could be achieved (Table 4). The corresponding predicted probability of sciatica for each sum score was calculated. Using this clinical diagnostic model (with high confidence clinical diagnosis as the reference stan-dard), a threshold score of 5 or above suggests high likelihood of being diagnosed with sciatica (at least 83%). Using coordinates from the ROC curve, at this threshold, the model has sensi-tivity of 0.85 and specificity of 0.88.
Sensitivity analyses
When MRI only was the reference standard, the predictors remaining in the model were leg pain worse than back pain (OR 2.4, CI 1.6, 3.4), intensity of leg pain (OR 1.1, CI 1.0, 1.2), posi-tive cough/sneeze (OR 2.0, CI 1.3, 3.2) and neurological deficit (OR 1.7, CI 1.2, 2.4). Posiposi-tive neural tension tests, below knee pain and subjective sensory changes were not in the final model. This model had the lowest AUC (0.70, CI 0.65, 0.74).
Discussion
This study ascertained the items from clinical assessment that best identify sciatica in primary care consulters with LBLP. In the absence of a gold standard for diagnosing sciatica, two refer-ence standards were compared. Model (i), using high confidrefer-ence in clinical diagnosis as a ref-erence standard, retained five items and had almost perfect calibration and discrimination. Model (ii), with the addition of confirmatory MRI in the reference standard, retained six items and showed good discrimination but poor calibration. Bootstrapping revealed minimal over-fitting in both models.
The predictors that were retained in both models are unsurprising from a clinical perspec-tive. “Pain below the knee” is commonly considered a proxy for sciatica [36] and other diagnos-tic models report its association with nerve root involvement defined by either clinical
Fig 1. Calibration plot for model (i) and model (ii). Model (i) calibration shown in upper graph, model (ii) calibration shown in lower graph. The solid line is a smoothed curve that represents an estimate of the relation between the predicted and the observed probability of sciatica diagnosis. Ideally this line fits the dotted line that represents perfect calibration.
MRI as the reference standard [16]. Clinically and in the literature it is recognised as a diagnos-tic criterion for sciadiagnos-tica [6]. It is suggested that neural tension tests may cause pain due to chem-ical mediators irritating the nerve root but not generating detectable signal on MRI [19].
Different choice of patient population and reference standards (MRI versus clinical diagno-sis) limits readers’ ability to compare diagnostic models for sciatica. Four models in the litera-ture have used MRI as reference standard [15,16,18,19]; two of these included only self-report items as predictors [15,19]. One model used clinical diagnosis as the reference standard [17] and the oldest published model used mylegrophy [20]. Three of the six models are based on patients in secondary care settings [15,19,20], with potentially more severe presentations than those from primary care settings [16–18].
Performance measures are not always reported [18–20] which makes it difficult to compare models. In a model that used nerve root compression on MRI as a reference standard; gender and sensory loss remained significant predictors, but performance was poor (AUC 0.65) [15]. History items alone were used to develop the model and the population was a highly selected group with severe sciatica. Items identified by Vroomen et al. [16], to be associated with nerve root compression defined by MRI, performed well (AUC 0.80) for demographic (age and gen-der) and history domains (spasmodic pain, pain worse in leg than back, pain in a dermatomal distribution, positive cough/sneeze). Their model performance improved slightly (AUC 0.83) when physical examination items were added (restricted forward bending, myotome weak-ness). External validation of the history items in a different data set resulted in a much lower AUC of 0.58 [15]. Using a similar reference standard and population setting to the study in this report, Konstantinou et al. [17] also found pain below knee, leg pain worse than back pain and feeling of numbness or pins and needles to be associated with the clinical diagnosis of sci-atica. The authors acknowledge that not including clinical examination items may explain their models’ performance (AUC 0.72 for only definite cases of sciatica; AUC 0.74 for definite and possible cases of sciatica indicated by clinical diagnosis).
Limitations
[image:10.612.38.579.88.228.2]As there is no gold standard for diagnosing sciatica, selection of a reference standard is always a challenge. In this study, for Model (i), expert clinical opinion was chosen as a reference stan-dard, which is considered in some circumstances appropriate in the development of diagnostic criteria in the absence of a gold standard [22]. It also reflects current practice in primary care when in the majority of cases, diagnosis and initial management plans are put into place with-out access to imaging, at least initially. Patients excluded from the analysis were cases where Table 4. Scoring tool based on model (i) for clinical assessment items and corresponding predicted probability of sciatica.
Variable in the model Does the patient: Score
Subjective sensory changes Report any pins and needles or numbness in the involved lower limb 1
Below knee pain Report pain below the knee 2
Leg pain worse than back pain Report that their leg pain is worse than their back pain 2
Neural Tension tests Have a positive straight leg raise test and/or femoral nerve test and/or slump test 3 Neurological deficit Have any myotome/ reflex or sensory deficit in the involved lower limb 2
Sum Score . . ..
Sum Score 0 1 2 3 4 5 6 7 8 9 10
N 36 19 19 20 21 47 29 41 61 25 76
Observed Sciatica (%) 3 11 11 50 67 85 86 100 97 100 100
Mean predicted probability of Sciatica (%) 4 9 19 42 63 83 93 96 99 100 100
clinicians indicated low diagnostic confidence, irrespective of either a referred leg pain or sci-atica diagnosis. A reliability study, nested in this cohort, showed good reliability on diagnosis of LBLP when clinician confidence is high (at least 80%) [4]. Diagnostic uncertainty is a clini-cal reality as sometimes a return visit from the patient is needed to further confirm or explore diagnosis. All patients received an MRI scan as part of this research study and patients were not selected for inclusion in the study based on the results of this scan.
The clinicians unavoidably used information from the assessment predictor variables to make their diagnosis; this contributes to incorporation bias and potentially inflates accuracy estimates [38,39]. Ideally the reference standard and the predictors should be independent of one another to avoid inflation of accuracy estimates [38,39].
A second reference standard was chosen which combined confirmatory MRI findings with the high confidence clinical diagnosis, in order to address to some extent the issue of incorpo-ration bias.
Alternative approaches to deal with an “imperfect reference standard” include using a com-bination of reference standards in a sequential manner to diagnose patients [38]. For example firstly interpreting clinical information, then, if needed, combining this information with fur-ther diagnostic tests (e.g. MRI). Anofur-ther recommended means of limiting bias with reference standard selection is the use of consensus so more than two assessors agree on a diagnosis [38]. However, both these methods can result in selection bias as the “easier to identify” cases are selected therefore losing the heterogeneity of patients seen in normal clinical life.
Using MRI only as a reference standard, which allows the reference standard and predictors to be independent of each other, produced the lowest performance index (AUC 0.70) and did not retain the predictors “pain below the knee” and “positive neural tension tests”. Excluding these variables is at odds with clinical opinion and evidence in the literature, and reflects the mismatch seen in studies between clinical presentation and MRI findings [40].
The latent class analysis was performed to classify patients into two groups without the need for a reference standard. The two class solution showed good concordance with the groups defined as referred pain and sciatica according to clinical diagnosis reference standard, supporting the validity of clinical diagnosis for use as a reference standard.
Stepwise regression is an automated process and using too many variables and removal of variables that may be important are some of the recognised limitations of the technique [13]. For this model the number of predictors was not excessive in relation to the sample size [28] and the backwards approach to predictor selection allows the model to be assessed as the vari-ables are removed sequentially.
The choice of predictor selection for this model was primarily based on previous consensus work on items from clinical assessment that contribute most to the diagnosis of LBLP due to sciat-ica [26]. The primary care setting of this study helps to limit the issue of selection bias seen in other diagnostic studies where patients are selected from secondary care settings and have more severe symptoms. Assessors who participated in this study were all experienced physiotherapists and underwent training to enhance standardisation of the data collection and diagnostic decisions. It could be argued that diagnostic accuracy may be better among other healthcare professionals or medically trained clinicians. However previous work showed that agreement among clinicians is similar between physiotherapists and other healthcare professionals when diagnosing sciatica [4].
Conclusion
selection in identifying sciatica, and to compare models with different reference standards. A clear cluster of items was found which consistently identified sciatica: pain below the knee, leg pain worse than back pain, positive neural tension and neurological deficit. A simple scoring tool was developed which could prove useful to clinicians and researchers wishing to support their clinical judgement regarding the probability of whether a patient’s leg pain is sciatica. In research settings, the tool could enable more optimum identification of a homogenous group.
Supporting information
S1 Table. Predictor selection and their measurement level. (DOCX)
S1 Dataset. (XLSX)
Author Contributions
Conceptualization: Siobha´n Stynes, Kika Konstantinou, Elaine M. Hay, Kate M. Dunn.
Formal analysis: Siobha´n Stynes, Reuben Ogollah.
Investigation: Siobha´n Stynes.
Methodology: Siobha´n Stynes, Kika Konstantinou, Reuben Ogollah, Kate M. Dunn.
Writing – original draft: Siobha´n Stynes.
Writing – review & editing: Siobha´n Stynes, Kika Konstantinou, Reuben Ogollah, Elaine M. Hay, Kate M. Dunn.
References
1. Kongsted A, Kent P, Jensen TS, Albert H, Manniche C (2013) Prognostic implications of the Quebec Task Force classification of back-related leg pain: an analysis of longitudinal routine clinical data. BMC Musculoskeletal Disord 14: 171.https://doi.org/10.1186/1471-2474-14-171PMID:23705775
2. Hill JC, Konstantinou K, Egbewale BE, Dunn KM, Lewis M, et al. (2011) Clinical outcomes among low back pain consulters with referred leg pain in primary care. Spine 36: 2168–2175.https://doi.org/10. 1097/BRS.0b013e31820712bbPMID:21358478
3. Bogduk N (2009) On the definitions and physiology of back pain, referred pain, and radicular pain. Pain 147: 17–19.https://doi.org/10.1016/j.pain.2009.08.020PMID:19762151
4. Stynes S, Konstantinou K, Dunn KM, Lewis M, Hay EM (2016) Reliability among clinicians diagnosing low back-related leg pain. Eur Spine J. 25: 2734–2740.https://doi.org/10.1007/s00586-015-4359-2
PMID:26703790
5. Lin CW, Verwoerd AJ, Maher CG, Verhagen AP, Pinto RZ, Luijsterburg P, et al. (2014) How is radiating leg pain defined in randomized controlled trials of conservative treatments in primary care? A systematic review. Eur J Pain 18: 455–464.https://doi.org/10.1002/j.1532-2149.2013.00384.xPMID:23939653
6. Stynes S, Konstantinou K, Dunn KM (2016) Classification of patients with low back-related leg pain: a systematic review. BMC Musculoskelet Disord 17: 1.https://doi.org/10.1186/s12891-015-0856-z
7. Genevay S, Atlas SJ, Katz JN (2010) Variation in eligibility criteria from studies of radiculopathy due to a herniated disc and of neurogenic claudication due to lumbar spinal stenosis: a structured literature review. Spine 35: 803–811.https://doi.org/10.1097/BRS.0b013e3181bc9454PMID:20228710
8. Vroomen P, de Krom M, Knottnerus JA (1999) Diagnostic value of history and physical examination in patients suspected of sciatica due to disc herniation: a systematic review. J Neurol 246: 899–906. PMID:10552236
10. Iversen T, Solberg TK, Romner B, Wilsgaard T, Nygaard O, Waterloo K, et al. (2013) Accuracy of physi-cal examination for chronic lumbar radiculopathy. BMC Musculoskelet Disord 14: 206.https://doi.org/ 10.1186/1471-2474-14-206PMID:23837886
11. Al Nezari NH, Schneiders AG, Hendrick PA (2013) Neurological examination of the peripheral nervous system to diagnose lumbar spinal disc herniation with suspected radiculopathy: a systematic review and meta-analysis. Spine J 13: 657–674.https://doi.org/10.1016/j.spinee.2013.02.007PMID:
23499340
12. Shultz S, Averell K, Eickelman A, Sanker H, Donaldson MB (2015) Diagnostic accuracy of self-report and subjective history in the diagnosis of low back pain with non-specific lower extremity symptoms: A systematic review. Man Ther 20: 18–27.https://doi.org/10.1016/j.math.2014.08.002PMID:25231775
13. Steyerberg EW (2009) Clinical prediction models: a practical approach to development, validation, and updating. New York: Springer.
14. Moons KG, Kengne AP, Woodward M, Royston P, Vergouwe Y, Altman D, et al. (2012) Risk prediction models: I. Development, internal validation, and assessing the incremental value of a new (bio)marker. Heart 98: 683–690.https://doi.org/10.1136/heartjnl-2011-301246PMID:22397945
15. Verwoerd AJ, Peul WC, Willemsen SP, Koes BW, Vleggeert-Lankamp CL, El Barzouhi A, et al. (2013) Diagnostic accuracy of history taking to assess lumbosacral nerve root compression. Spine J 14: 2028–2037https://doi.org/10.1016/j.spinee.2013.11.049PMID:24325881
16. Vroomen PC, de Krom MC, Wilmink JT, Kester AD, Knottnerus JA (2002) Diagnostic value of history and physical examination in patients suspected of lumbosacral nerve root compression. J Neurol, Neu-rosurg Psychiatry 72: 630–4.
17. Konstantinou K, Lewis M, Dunn K (2012) Agreement of self-reported items and clinically assessed nerve root involvement (or sciatica) in a primary care setting. Eur Spine Jo 21: 2306–15.
18. Coster S, de Bruijn SF, Tavy DL (2010) Diagnostic value of history, physical examination and needle electromyography in diagnosing lumbosacral radiculopathy. J Neurol 257: 332–337.https://doi.org/10. 1007/s00415-009-5316-yPMID:19763381
19. Beattie PF, Meyers SP, Stratford P, Millard RW, Hollenberg GM (2000) Associations between patient report of symptoms and anatomic impairment visible on lumbar magnetic resonance imaging. Spine 25: 819–828. PMID:10751293
20. Vucetic N, Astrand P, Guntner P, Svensson O (1999) Diagnosis and prognosis in lumbar disc hernia-tion. Clin Orthop Relat Res: 116–122.
21. Jensen MC, Kelly AP, Brant-Zawadzki MN (1994) MRI of degenerative disease of the lumbar spine. Magn Reson Q 10: 173–190. PMID:7811610
22. Coggon D, Martyn C, Palmer KT, Evanoff B (2005) Assessing case definitions in the absence of a diag-nostic gold standard. Int J Epidemiol 34: 949–952.https://doi.org/10.1093/ije/dyi012PMID:16076861
23. Moons KG, Altman DG, Reitsma JB, Ioannidis JP, Macaskill P, Steyerberg EW, et al. (2015) Transpar-ent Reporting of a multivariable prediction model for Individual Prognosis or Diagnosis (TRIPOD): expla-nation and elaboration. Ann Intern Med 162: W1–73.https://doi.org/10.7326/M14-0698PMID:
25560730
24. Konstantinou K, Beardmore R, Dunn KM, Lewis M, Hider SL, Sanders T, et al. (2012) Clinical course, characteristics and prognostic indicators in patients presenting with back and leg pain in primary care. The ATLAS study protocol. BMC Musculoskel Disord 13: 4.
25. Knottnerus JA (2002) The evidence base of clinical diagnosis. London: BMJ Books.
26. Konstantinou K, Hider S, Vogel S, Beardmore R, Somerville S (2012) Development of an assessment schedule for patients with low back-associated leg pain in primary care: a Delphi consensus study. Eur Spine J 21: 1241–9.https://doi.org/10.1007/s00586-011-2057-2PMID:22052453
27. Hosmer DW, Lemeshow S. (2000) Applied Logistic Regression 2nded. New York Wiley.
28. Peduzzi P, Concato J, Kemper E, Holford TR, Feinstein AR (1996) A simulation study of the number of events per variable in logistic regression analysis. J Clin Epidemiol 49: 1373–1379. PMID:8970487
29. Austin PC, Steyerberg EW (2014) Graphical assessment of internal and external calibration of logistic regression models by using loess smoothers. Stat Med 33: 517–535.https://doi.org/10.1002/sim.5941
PMID:24002997
30. van Smeden M, Naaktgeboren CA, Reitsma JB, Moons KG, de Groot JA (2014) Latent class models in diagnostic studies when there is no reference standard- a systematic review. Am J Epidemiol 179: 423–431.https://doi.org/10.1093/aje/kwt286PMID:24272278
32. Suarthana E, Vergouwe Y, Moons KG, de Monchy J, Grobbee D, Heederik D, et al. (2010) A diagnostic model for the detection of sensitization to wheat allergens was developed and validated in bakery work-ers. J Clin Epidemiol 63: 1011–1019.https://doi.org/10.1016/j.jclinepi.2009.10.008PMID:20189762
33. Dunn KM, Jordan KP, Croft PR (2010) Recall of medication use, self-care activities and pain intensity: a comparison of daily diaries and self-report questionnaires among low back pain patients. Primary Health Care Research and Development 11: 93–102.
34. Patrick DL, Deyo RA, Atlas SJ, Singer DE, Chapin A, Keller RB (1995) Assessing health-related quality of life in patients with sciatica. Spine 20: 1899–1908. PMID:8560339
35. Landis JR, Koch GG (1977) The measurement of observer agreement for categorical data. Biometrics 33: 159–174. PMID:843571
36. Dionne CE, Dunn KM, Croft PR, Nachemson AL, Buchbinder R, Walker BF, et al. (2008) A consensus approach toward the standardization of back pain definitions for use in prevalence studies. Spine 33: 95–103.https://doi.org/10.1097/BRS.0b013e31815e7f94PMID:18165754
37. Mathieson S, Maher CG, McLachlan AJ, Latimer J, Koes BW, Hancock M, et al. (2013) PRECISE— pregabalin in addition to usual care for sciatica: study protocol for a randomised controlled trial. Trials 14: 213.https://doi.org/10.1186/1745-6215-14-213PMID:23845078
38. Reitsma JB, Rutjes AWS, Khan KS, Coomarasamy A, Bossuyt PM (2009) A review of solutions for diag-nostic accuracy studies with an imperfect or missing reference standard. J Clin Epidemiol 62: 797–806.
https://doi.org/10.1016/j.jclinepi.2009.02.005PMID:19447581
39. Worster A, Carpenter C (2008) Incorporation bias in studies of diagnostic tests: how to avoid being biased about bias. CJEM 10: 174–175. PMID:18371254