POLYPLOID COMPLEX
Lynn Taylor
A Thesis Submitted for the Degree of PhD
at the
University of St Andrews
1985
Full metadata for this item is available in
St Andrews Research Repository
at:
http://research-repository.st-andrews.ac.uk/
Please use this identifier to cite or link to this item:
http://hdl.handle.net/10023/14207
THE POTENTIAL FOR INTROGRESSION IN A BRITISH POLYPLOID COMPLEX.
by
Lynn Taylor
A thesis submitted to the University of St. Andrews for the degree of Doctor of Philosophy
Department of Plant Biology and Ecology,
University of St. Andrews. September 1984
All rights reserved
INFORMATION TO ALL USERS
The quality of this reproduction is dependent upon the quality of the copy submitted.
In the unlikely event that the author did not send a com plete manuscript and there are missing pages, these will be noted. Also, if material had to be removed,
a note will indicate the deletion.
uest
ProQuest 10166415
Published by ProQuest LLO (2017). Copyright of the Dissertation is held by the Author.
All rights reserved.
This work is protected against unauthorized copying under Title 17, United States C ode Microform Edition © ProQuest LLO.
ProQuest LLO.
789 East Eisenhower Parkway P.Q. Box 1346
I declare that this thesis is a record of my own work
and that it has not been previously presented in
application for a higher degree.
CERTIFICATE
I certify that Lynn Taylor has spent 12 terms of research under my direction, and that she has fulfilled the conditions of Ordinance General No. 12 and Resolution of the University Court 1967 No. 1, and that she is qualified to submit the accompanying thesis in application for the degree of Doctor of Philosophy.
ABSTRACT
The potential for introgression in the British Senecio
polyploid complex was investigated using numerical
taxonomic methods. It has been suggested that
introgression of the introduced Mediterranean diploid S. squalidus L. into the native British tetraploid species S. vulgaris var, vulgaris {non-radiate) has given rise to the inland radiate morph S. vulgaris var. hibernicus Syme.
The research reported in this thesis falls into three main sections. The first part describes the results of a crossing program to determine the interfertility relation ships of the British Senecio species, S. vulgaris var. vulgaris, S_. vulgaris var. hibernicus, S. vulgaris var. denticulatus , S. viscosus , S.. squal idus, S_. vernal is , and
S. cambrensis. Interspecific hybrids at the diploid,
triploid and tetraploid levels were formed. If was found
that hybrid fertility was largely dependent on genomic balance.
The phenetic similarities of the interspecific hybrids and the parental species were examined by multivariate analysis of 64 morphological charaters, using both cluster
analysis and ordination methods. The results obtained
suggest that radiate S. vulgaris may have arisen via
non-reduction of a S^. squalidus gamete. The backcross
progeny of a tetraploid S. vulgaris var. vulgaris x
S . squalidus hybrid were phenetically close to radiate S.
vulgaris. However, F^ progeny of naturally occuring
diploid F2 hybrids were morphologically indistinguish able from S. squalidus.
The third part of the thesis describes the results of a morphometric analysis of the geographic variation in radiate and non-radiate S. vulgaris, and S. squalidus in central Scotland. It was found that the interpopulation
differentiation in both radiate and non-radiate S.
vulgaris was correlated with both the geographic
distribution of radiate S. vulgaris and the longitude.
In conclusion it is suggested that, although S. vulgaris var. hibernicus may have originated by introgres-
ion of S. squalidus into S_. vulgaris var. vulgaris, the
current potential for introgression would appear to be in other directions, from the tetraploids S.. vulgaris and S. viscosus into the diploid S.. squalidus. The greatest extent of gene flow, however, was found to be from radiate S_. vulgaris into non-radiate S. vulgaris.
CONTENTS.
1. INTRODUCTION 1
2. THE GENUS SENECIO IN BRITIAIN 5
2.1 Taxonomy and distribution. 5
2.2 The origin of S. vulgaris var. hibernicus. 8
2.3 The origin of S. vulgaris var. denticulatus. 13
2.4 The origin of S. cambrensis. 15
2.5 Introgression of S. squalidus into S. viscosus. 16
2.6 Hybridization between the tetraploid species. 17
2.7 Summary 18
3. THE AIMS AND EXTENT OF THE PROJECT. 20
4. THE USE OF NUMERICAL METHODS IN PLANT SYSTEMATICS. 21
5. THE CHOICE OF A CHARACTER SET. 28
5.1 The formulation and definition of the
characters. 28
5.2 Materials and methods. 31
5.3 The character set. 33
5.4 Assessment of the character set. 44
5.4.1 Univariate analysis of the character set. 45
5.4.2 Character correlation 49
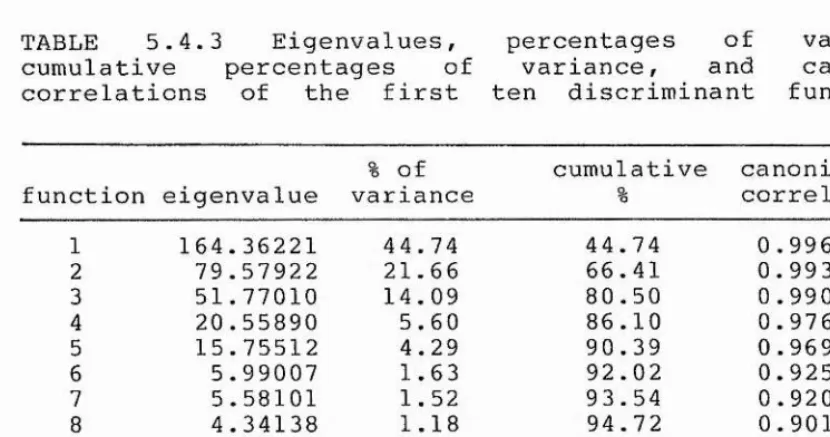
5.4.3 Discriminant function analysis 54
5.5 The final character set. 61
6. THE RESULTS OF THE CROSSING PROGRAM. 62
7. NUMERICAL ANALYSIS OF INTERSPECIFIC HYBRIDS. 6 7
7.1 Material and methods 67
7.2 Discriminant function analysis. 69
7.3 Principal components analysis. 77
7.4 Cluster analysis. 80
9.1 Materials and methods. 105
9.2 Interspecific variation 108
9.3 Geographic variation in S. vulgaris var. 116
vulgaris.
9.4 Geographic variation in S_. vulgaris var. 123
hibernicus.
9.5 Geographic variation in S. squalidus. 128
9.6 Comparison of geographic variation patterns. 130
9.7 Geographic variation in leaf shape in S. 132
vulgaris.
9.8 Conclusion 142
10. DISCUSSION. 144
11. CONCLUSION. 157
12. BIBLIOGRAPHY 160
13. APPENDIX 1 170
OTU nunbers, line numbers, locations of the
original populations, generation numbers, and the number of replicates of the species and hybrid 1ines.
14. APPENDIX 2 175
Means, standard deviations, variances, and number of replicates of each lines for the 63 continuous characters COl to C63.
15. APPENDIX 3 237
Means, standard deviations, variances and number of replicates of non-radiate and radiate S_. vulgaris,
and squalidus at the 21 populatons A to U in
1. INTRODUCTION.
Although the literature on hybridization and
introgression between plant species is extensive, and has recently been reviewed by Levin (1979) and Grant (1981), few authors are prepared to assess the relative importance of these phenomena in the evolution of plant species. Levin (1979) has stated that,
"Our difficulty in assessing the role of
interspecific gene exchange in evolution is
principally attributable to our inability to detect and quantify gene exchange."
Gottlieb (1972) argues that although morphological intermediacy of a number of characters is the primary criterion of hybridity, other criteria such as additive inheritance of biochemical characters which are present in one parent but not in both, excessive interpopulation
variability due to segregation, ecological and
physiological intermediacy, the occurrence of partially
fertile hybrids, and the experimental synthesis of the
hybrid taxon, are necessary to determine the level of confidence that can be placed in the analysis.
Reiser (1973) suggests that although some cases of introgression have been well established, in many other cases an alternative explanation cannot be ruled out. Reiser lists a number of situations which may be mistaken for introgression but which are not, either because the initial hybridization has not occurred, or because there
has not been repeated backcrossing. Examples of
misleading cases are mutation, remnants of ancestral
involve recombination rather than hybridization. Examples of the cases in which no recombination has occurred are hybrids, hybrid swarms, and recorobinational spéciation,
where apparently introgressant forms result from
inbreeding and selection after an initial hybridization. Equally, as pointed out by Levin (1979) it is also possible to make the reverse mistake, to fail to detect introgression because of the absence of morphological variation. Lee (1975) found that although the F^ hybrids
of Typha anqustifolia x T. latifolia were
intermediate, the backcross hybrids were not
distinguishable morphologically from T. anqustifolia.
Raven & Raven (1976) found that F^ interspecific hybrids of Epilobium could not be distinguished morphologically from one of the parent species.
It has been suggested that both hybridization and
introgression have occurred between various British
species of Senecio. The hybridization of a number of Senecio species has been confirmed cytologically (Crisp, 1972; Benoit, Crisp & Jones, 1975; Ingram, 1977, 1978; Weir & Ingram, 1980). However, the possible introgressant forms (Crisp, 1972; Richards, 1975; Monaghan & Hull, 1976; Hull, 1976) have also been attributed to mutation (Stace, 1977) and recombinational spéciation (Oxford & Andrews, 1977; Marshall & Abbott, 1980).
The evidence for introgression in the British
univariate analysis of fitness characters such as germination rate, growth rate, and reproductive capacity in S. vulgaris (Richards, 1975; Oxford & Andrews, 1977), although backcross progeny of interspecific hybrids have been synthesized (Ingram, 1978; Ingram, Weir & Abbott,
1980).
The aim of this project was to re-examine the potential for interspecific gene transfer in British
Senecio species using numerical taxonomic methods.
Multivariate morphometric methods, although they sample the phenotype rather than the genotype, and therefore may be influenced by environmental variation, have been shown
to be extremely powerful. It has been shown that
morphometric analyses are superior to analyses of gene frequencies in both distiguishing genetic strains and
sublines of mice, and discriminating between
electrophoretically indistinguishable karyotipic races of mice (Thorpe, 1981; Thorpe, Corti, & Capanna, 1982).
Lewontin (1984) has shown that it is statistically much more difficult to demonstrate differences between gene frequencies than differences between the means of metric traits, and that this difficulty is independent of the gene frequencies or the variances of the metric
characters. Lewontin argues that because of the a
priori. differences in the statistical probabilities, a random set of loci cannot validly be compared with a quantitative trait, irrespective of whether or not the loci influence the trait.
biometrical divergence in 17 skull length and width characters in six genetic strains of rat. They found that the estimated narrow-sense heritabilities of the canonical vectors showed that the among-groups covariance patterns
were highly heritable, and that there was a high
correlation between the phenotypic and genetic distances in both males (r = 0.90) and females (0.85).
Multivariate analyses of morphological variation , in
that they are statistically powerful methods, are
extremely useful in investigating possible hybridization and introgression (Neff & Smith, 1979; Pimentel, 1981;
Adams, 1982). A major part of this project is the
2. THE GENUS SENECIO IN BRITAIN.
2.1 Taxonomy and Distribution.
The genus Senecio (Asteraceae) is one of the largest known genera, comprising approximately 3000 species, and is cosmopolitan in its distribution. Chater & Walters (1976) in Flora Europea list nine species of Senecio as native to Britain: S. paludosus L . , S. smithii DC., S. inteqrifolius (L.) Clairv., S. jacobaea L . , S. aquaticus
Hill, S. erucifolius L . , S. cambrensis Rosser, S.
sy 1vaticus L . , and S. vulqaris L . ; five species as naturalized: S. doria L . , S. mikanioides Ctto ex Walpers, S . bicolor (Willd.) Tod., S^. f luviatal is Wallr., and S. squalidus L .; and one species S. viscosus L. as probably
native to Britain. Crisp (1972) additionally lists S.
tanquticus Maxim, as established in Britain, and a further 22 species of Senecio, including S. vernal is Waldst. &
Kit., which have been recorded as occasional
introductions.
Only six of these 38 species commonly occur in wild
populations, the native tetraploids S. jacobaea, S.
aquaticus, S . viscosus, S . syIvaticus, and S . vulqaris, and the introduced diploid S. squalidus. Chater & Walters
(1976) placed S. squalidus in the section JACOBAEA
(Miller) Dumort. with S. jacobaea and S_. aquaticus on the
basis of perennial habit, large capitula, and well
developed ray florets. The annuals, S. vulqaris, S.
svlvaticus) in the section SENECIO. Alexander (197 6) treats all these species as belonging to sect. SENECIO on
the basis of overall similarity and interfertility.
However, the interfertility between these two groups in Britain would appear to be based on the ability of S. S. squalidus to form hybrids with S. vulqaris and S. viscosus. The hybrids S. jacobaea x S. squalidus and S. jacobaea x S. vulqaris have been recorded, but the records are doubtful, and the putative hybrids were probably depauperate S. squalidus plants (Benoit, Crisp & Jones, 1975) .
The interfertility of S. squalidus with S. vulqaris
and S_, viscosus appears to have been responsible for the
formation of a polyploid complex comprising interspecific hybrids, introgressant varieties, and an allohexaploid species, S. cambrensis Rosser.
For the purpose of this study the Senecio polyploid complex was defined as S. squalidus, S. sylvaticus, S. viscosus r S. cambrensis, S. vernalis, and S. vulqaris. The three varieties of S. vulqaris, S. vulqaris var.
vulqaris, S. vulqaris var. hibernicus Syme, and S.
vulqaris var. denticulatus O.F. Muell. were included.
S. squalidus is a perennial diploid (2n=20) ruderal of Mediterranean origin which is believed to have become
established in Britain, having escaped from Oxford
Scotland.
The two common varieties of S. vulqaris, the
non-radiate morph var. vulqaris and the inland radiate morph var. hibernicus, are annual tetraploid (2n=40) ephemerals. These varieties are colonizers of open and
disturbed habitats, and are capable of considerable
phenotypic plasticity (Abbott, 1976a, 1976b). The third
variant of S. vulqaris, the maritime radiate
morph, S. vulqaris var. denticulatus, is a winter annual
found only on sand dunes. The non-radiate morph var.
vulqaris is common throughout Britain. The radiate
morph var. hibernicus is broadly similar in distribution to S_. squalidus, the northern limit of its distribution
also being central Scotland. The maritime radiate
morph var. denticulatus is only found in Lancashire and the Channel Is.
The other two tetraploid species, S. viscosus and S. syIvaticus are widespread in Britain. S. viscosus is commonly found on railway lines and open gravelly ground. S_. sylvaticus is more commonly found at woodland margins, particularly on sandy soils. However, both species may be also found growing with S. squalidus and S. vulqaris on waste ground.
The hexaploid S. cambrensis (2n=60) is an annual or biennial ruderal found in roadsides and waste ground. It occurs only in a limited area of North Wales, although it has recently been found in Edinburgh (Abbott, Ingram, & Noltie, 1983).
introduction.
2.2 The origin of S^. vulqaris var. hibernicus.
The evidence for the hypothesis that the inland
radiate form of S_. vulqaris has arisen by introgression of
the introduced Mediterranean diploid S_. squalidus into
the native non-radiate S. vulqaris is based on three
lines of evidence.
1. The apparently parallel spread of S. squalidus and S. vulqaris var. hibernicus in Britain over the past 150 years.
2. Studies which have suggested that the S. vulqaris var, hibernicus is intermediate between S^. squalidus and S. vulqaris var. vulqaris for a number of characters.
3. Studies of synthesized hybrids and backcrosses of S.
vulqaris var. vulqaris x S,. squalidus.
1. S. squalidus was first recorded outside Oxford
(1977), however, points out that in many areas there is no obvious parallel colonization. In particular, in London and south-eastern England S. squalidus has been well established since 1900, but radiate S. vulgaris is still uncommon.
2. Richards (1975) compared germination, growth
(plant height, number of leaves, time to flower, and longest leaf length), generation time, and reproductive potential (mean number of seeds per plant) in radiate and
non-radiate plants from a British population with
non-radiate plants from a Yugoslavian population. He found that the radiate plants had slower germination and growth, but a much higher reproductive capacity, than the non-radiate plants from the British population.
Oxford & Andrews (1977) examined the relative
fitness of the radiate and non-radiate morphs in
eight polymorphic natural populations in terms of the mean number of cypselae per capitulum and the mean number of
capitula per plant. They found a highly significant
genotype effect, the radiate form having having more
capitula per plant, and more seeds per capitula, in six of the eight populations.
Monaghan and Hull (1976) compared leaf size (length and width) and shape (length to width ratio) in radiate
and non-radiate S. vulgaris with S. squalidus from
populations in Edinburgh and Glasgow. They found that
radiate S. vulqaris was intermediate in leaf length
between non-radiate S. vulqaris and squa1idus leaf
squalidus was more frequent, both radiate and non-radiate plants had relatively broader leaves than in the Glasgow population S. vulqaris plants.
In reviewing this work, Stace (1977) argues that the evidence for the intermediacy of the radiate form of S. vulqaris is equivocal in that Richards (1975) found the Yugoslavian non-radiate S. vulqaris to be more like the radiate S. vulqaris from the British population with
respect to growth than the British non-radiate S.
vulqaris. Secondly, he argues that the leaf characters used by Monaghan & Hull (1975) are not good discriminators between S. vulqaris and S. squalidus as both species are highly variable in leaf shape and dissection. He further argues that, because of the rarity and almost complete
sterility of the S. vulqaris x S. squalidus hybrid, it
cculd not account for the rapid spread of radiate S. vulqaris.
3. Although some attempts to synthesize S. vulqaris x
11
2n=40 and 2n=44.
The frequency of S. vulqaris x S. squalidus hybrids in natural populations is difficult to assess in that, although many intermediates between the two species have been recorded (summarized in Crisp, 1972), only a few have been confirmed cytologically (Stace, 1977; Brettel &
Leslie, 1978; Valentine, 1979). However, Ingram, Weir &
Abbott (1980) found six triploids on a single visit to two
sites in Edinburgh, and a further one triploid at
Musselburgh. From comparison with synthesized hybrids
they concluded that four of these were S. vulqaris var.
hibernicus x S. squalidus , and three were S. vulqaris
var. vulqaris x squalidus. Marshall & Abbott
(1980) found eight S. vulqaris x S_. squalidus hybrids
from a total of 29,993 S. vulqaris plants at four sites ( two in Edinburgh, one in Leeds, and one in Cardiff)and, from progeny testing of 50 radiate and 50 non-radiate plants from each site, obtained a single hybrid out cf 9469 progeny of radiate plants, and one hybrid from 6392 progeny of non-radiate plants.
The alternative hypothesis to an introgressive origin of the radiate form of S. vulqaris is that it arose by
mutation. The ray floret character in S_. vulqaris var.
hibernicus is controlled by a single gene with incomplete
dominance (Trow, 1912). The non-radiate form is the
condition have occurred (Aster tripolium, Leucanthemum vulqare), and vice versa (Bidens cernua), and points cut that non-radiate variants of Senecio jacobaea and S. squalidus have been recorded. The non-radiate condition in S_. squalidus has also been found to be controlled by a single gene with incomplete dominance (Ingram & Taylor, 1982) .
In a recent series of papers Marshall & Abbott (1979, 1980, 1982, 1984) have shown that the radiate form of S. vulqaris generally has a much higher outcrossing frequency
than the non-radiate form. In wild polymorphic
populations the non-radiate morph is predominately
self-fertilizing, generally outcrossing at a frequency of less than 1%; whereas the radiate morph consistently shows much greater levels of outcrossing, reaching 30% in some populations. Although there were large fluctuations in the frequencies of the Tr_ and Tn alleles between 1978 and
1980, the differences in outcrossing frequency were
maintained.
Theoretical studies on the evolution of mixed mating
systems in plants, i.e., species in which both
self-fertilizaticn and outcrossing occur, generally
conclude that, at least in single locus models, an allele which promotes outcrossing is at a selective disadvantage when compared with an allele which promotes selfing, unless the genetic cost of outcrossing is balanced by some
form cf selective advantage (Fisher, 1941; Mcran, 1962;
Nagylaki, 1979). Inbreeding depression in the selfing
13
the outcrossing variant have been suggested as factors on which selection may act to maintain the frequency of the
outcrossing gene in the population (Charlesworth &
Charleswcrth, 1979; Lloyd, 1979,).
The question of which factors control the spread of the radiate morph is the subject of a research program, currently being carried cut at St. Andrews (Abbott, per s. com.). This project is primarily a study of the origin cf the radiate morphs S. vulgaris var. hibernicus and var. denticulatus.
If the effects associated with the radiate allele are due tc pleictropy, then it is net possible to determine whether it has originated as a result of mutation or
introgression. However, if the effects are due to
linkage, then this would be evidence in favour of an introgressive origin. The pleictropy and linkage can only be distiguished by the presence of recombinants, the frequency of which is dependent on the degree of linkage.
2.3 The origin cf S. vulqaris var. denticulatus.
The maritime radiate form var. denticulatus, has
a limited and disjunct distribution in Britain, being found on sand dunes in only two areas; between Liverpool and Southport on the Lancashire coast, and on the Channel Islands. Although var. vulqaris , var. hibernicus and var. denticulatus are fully interfertile, the maritime
radiate form is morphologically and phenologically
annual with a basal rosette growth habit. The basal leaves are much longer and more spathulate than those cf
var. vulqaris and var. hibernicus. The indumentum is
arachnoid rather than sparsely pubescent. The capitula of var. denticulatus are slightly larger, and the ray florets smaller, than those cf the other two forms.
The similarity of growth habit and leaf shape between S_. vulqaris var. denticulatus and S. vernal is has led tc the suggestion (Crisp, 1972) that var. denticulatus may have arisen either as a result of introgression of S. vernalis into S. vulqaris var. vulqaris, or as a result of autotetraplcidizaticn of S. vernalis (Kadereit, 1984a).
Kadereit (1984) synthesized triploid hybrids of S.
vulqaris var. vulqaris x S. vernal is and S_. vulqaris var. denticulatus x S. vernal is, and tetraploid hybrids between S_. vulqaris var. vulqaris and synthetic autotetraplcids of S^. vernal is. The triploid hybrids had pollen fertilities of 9.5% and 8.0% to 15% respectively, and the tetraploid hybrids had a mean pcllen fertility of 79.9%. Kadereit suggests that S_. vulqaris var. denticulatus arose by autotetraploidizat ion of S^. vernal is, and that subsequent differentiation at the tetraploid level gave rise to the
non-radiate S.. vulqar is var. vulqaris. That is, he
suggests that S. vulqaris is a autctetraplcid rather than an allotetraploid as suggested by Ingram (1978). Kadereit argues that the lower incidence of univalent formation in
the triploid hybrids of S. vulqaris and the annual
diploid species S. qlaucus ssp. qlaucus, S.
15
per cell) as compared with the 7 - 1 0 univalents per cell
in the S_. vulqaris x S_. squalidus triploid (Ingram,
1977) indicates a closer relationship between these
species and S_. vulqaris than between squalidus and S.
vulqaris.
Based on the calculations cf Jackson & Casey (1982) and Jackson & Hauber (1982), nine univalents would be
expected with totally homologous pairing in an
autotriploid if the chiasma frequency is 11.42 + 0.47 chiasmata per cell, as has been recorded in S. squalidus from North Wales (Ingram & Noltie, in prep.).
A higher chiasma frequency would increase multivalent
formation at the expense of univalent formation, and therefore, unless these factors have been taken into account, the number of univalents in a triploid hybrid cannot be used tc indicate gencmic relationships.
2.4 The origin of S. cambrensis.
S. cambrensis was first described by Rosser (1955) who
defined it as a allohexaploid (2n=60) formed by
hybridization of S. squalidus and S. vulqaris. The
allohexaploid has been synthesized by colchicine induced
autopolyploidy of the F^ S. vulqaris x S. squalidus
Until recently it was believed that S. cambrensis had a restricted distribution, occuring only in the Ffrith area cf North Wales where it was originally recorded (Bosser, 1955), but it has now also been found in Edinburgh (Abbott, Ingram & Noltie, 1983). It has been suggested that this may be an example of an alloployploid being formed ^ novo as the triploid S. vulgaris x S. squalidus hybrid has been recorded in the same area
(Ingram, Weir & Abbott, 1980; Marshall & Abbott, 1980).
2.5 Introgression of S. squalidus into S .viscosus.
The triploid hybrid between S. squalidus and S. viscosus is S. x subnebrcdensis Sirak., this name having
been shown to have priority over the better
known S. x londinensis Lousley (Kadereit, 1984b). x
subnebrodensis is fairly common on sites where the two
parental species occur. The hybrid is morphologically
intermediate between the parents, but is more like S. viscosus in its degree of viscidity (Benoit, Crisp & Jones, 1975).
Crisp & Jones (1978), in an investigation of natural and synthesized S. x subnebrodensis, found that the triploid could only be synthesized when S_. squalidus was the female parent. Although they found that controlled self-pollination and attempts to backcross the hybrids to
either parental species were unsuccessful, spontaneous F2
progeny from both natural and synthesized hybrids were
17
or sub-pentaploid to sub-hexaploid (2n=47 to 2n=56), and were all almost sterile, with seed sets cf less than 0.5%. One of the triploid P^s gave rise to a large and vigorous
F2 with 2n=48, which in turn produced F^s with 2n=43 and
2n=44. There was a gradual increase in the pcllen
stainability and seed set from the F^ to the F^
generations.
Crisp & Jones suggest that introgression of the diploid S. squalidus into the tetraploid S. viscosus may occur via aneuploidy of approximately pentaplcid later generation hybrids.
2.6 Hybridization between the tetraploid species.
X viscidulus Scheele, the hybrid of S. sylvaticus
and S. viscosus, has been recorded with reasonable
regularity (Benoit, Crisp & Jones, 1975 ),and has been synthesized with relative ease (Crisp, 1972). However, there are no records of later generation hybrids, and no evidence to suggest that introgression of this hybrid into either parent species occurs.
The hybrid of S. viscosus and S_. vulgaris has been recorded, although these records have net been confirmed
(Benoit, Crisp & Jones, 1975). Attempts to synthesize
this hybrid have failed, and Gibbs (1971) found evidence
of hybrid embryo inviability. There are no confirmed
The pathways of possible interspecific gene transfer which have been suggested as occurring between the British
Senecio species; S. vulgaris var. vulgaris, S. vulgaris
var. hibernicus, vulgar is var. denticulatus, S.
3
3
t o
E c
I
o o
r
= a S 1? t A 3O 1—4 W-t 0) c Q) tr< u ■H M-4 •H U (U 10 (U •Hu Q) Cu to o •r-i u eu Cl. c (0 QJ U en <D 4-1 Æc (0 •H "r4 4J M -l 'r H
o u m (0 PM (U m 5 -M x: 4-j c fO 0)
CL eu 5 eu -p I— I eu X! Xi co u co p
o uCL U
O eu
X o
p p
en no 19 c eu •Hp N co •H eu P en (0 en p co P CD p
eu " ;
eu [—1Xi
r- eu •> OJ fC3
x; J:
H (l;X: D u O •H M X
3. THE AIMS AND EXTENT CF THE PROJECT.
The aim of this project was to re-examine the possible introgression of S. squalidus into S. vulgaris and S. viscosus. This problem was approached in three stages.
The first series of experiments was a crossing program to determine the inter fertility of the species, and to synthesize the interspecific hybrids.
The second series of experiments was a morphometric analysis of the interspecific hybrids, their parental species, and the putative introgressant forms. The aim of this series of experiments was to examine the variability in plants which are known a priori to be hybrids, and therefore to generate a known model of phonetic similarity in the Senecio polyploid complex, which could be compared with the variation found in natural populations.
The third approach was a morphometric analysis of geographic variation in natural populations. The area in central Scotland which was studied extends across the northern limit of the distributions of S. squalidus and radiate S . vulgar is. The aim. of this analysis was to locate naturally ocurring hybrids, and tc compare the pattern of variation in these, and their parental species, with both the geographic distribution of S. squalidus and radiate S.
vulgaris, and with the 'known' model cf the synthesized
21
4. THE USE CF NUMERICAL METHODS IN PLANT SYSTEMATICS
A wide range of numerical taxonomic methods have been
applied to plant systematics, and the literature on
theoretical and general methodological aspects, and on specific methods is extensive (Jardine & Sibson, 1971; Elackith & Reyment, 1971; Sokal & Rohlf, 1981; Wiley, 1981;
Gordon, 1981). However, Duncan & Baum (19 81) have
suggested that the application of these methods appears to be largely ad hoc, in that in many papers the similarity coefficients used are often not specified, or the reaosns why specific methods have been used are not given.
The application of numerical methods can be regarded
as a multistage decision process (Crovello, 1970), the
four main stages cf this process being, 1. The choice of the OTUs.
2. The choice of the characters to describe the OTUs. 3. The methods cf computing the similarity of the OTUs. 4. The method of evaluating the taxonomic structure
within the similarity matrix.
1. The operational taxonomic units or OTUs, may be
either individuals, populations, species, genera or any
higher taxonomic level. The choice of the OTUs is
plants.
2. The choice of the number and type of the
characters, i.e., binary, multistate, or quantitative, is dependent on the number of OTUs to be classified, the taxomonic rank of the OTUs, and the type of data used, i.e., biochemical, morphological, allozyme frequency or
ecological data. This study, as an investigation cf
possible introgression between five closely related
species, used primarily quantitative morphometric data.
Sneath & Sokal (1973) suggested than between 40 and 60 characters was the optimal number of characters for the majority of numerical studies. Baum & Duncan (1981) have argued that there is no a_ priori correct number of
characters, and that the selection of characters is
dependent on detailed understanding of their within- and between-CTU variation. In this study, as the characters were numeric, the variation and the correlation of the characters could be determined statistically.
3. There are three main classes of similarity
coefficients; correlation coefficients, such as the
prcduct-moment correlation coefficient; distance
coefficients, such as euclidean distance, Mahalanobis D (Mahalanobis, 1936), or the Canberra metric (Lance & Williams, 1966), and association coefficients, such as the
general similarity coefficient cf Gower (1971). Duncan &
Baum (1981) have pointed out that the choice of a suitable similarity coefficient requires adequate knowledge cf both
the data and the effect of different coefficients. The
23
criticized by Eades (1965) and Minkoff (1965) who have shewn that the correlation coefficient requires all the characters to have the same directional and dimensional
properties. However, as pointed out by Sneath & Sokal
(1973) the properties of the various coefficients
have, in general been determined empirically (Sokal & Michener, 1967; Boyce, 1969; Schnell, 1970) by comparison with a known model, and therefore, in that the structure of the data is not known in advance in any given study, there can be no a priori best similarity coefficient. Gordon
(1981) states that,
"the author is loath to make any exclusive
recommendations, because of the many different types cf data which can appear in classification studies." Sneath and Sokal (1973) state that,
"Perhaps the only recommendation that we would care to make at this stage in the development of the field is that, of each type of coefficient considered, the simplest one should be chosen cut cf consideration for ease of interpretation."
4. There are two main classes of methods of evaluating
the taxcncmic structure of the similarity or distance
matrix, ordination methods and hierarchical clustering
methods. The unweighted pair group method (CPGKA) of
heirarchical clustering (Sokal & Michener, 1958) is the
most commonly used numerical analysis (Duncan & Baum,
1981). However, in cases where the variation is not of a
hierarchical nature, as for example in studies of
interspecific hybridization and introgression, cr of
intraspecific geographic variation, then ordination
function analysis, and ncn-metric multidimensional scaling are commonly used.
A number of papers have been published comparing the use of various ordination methods in the detection and analysis of hybrids. Neff & Smith (1979) compared the use of discriminant function analysis and principal component analysis in analysing hybrids from two sunfish genera. Le pom, is and Notropis. Pimentel (1981) compared principal component analysis, principal coordinate analysis, and ncn-metric multidimensional scaling, using data from a
hybrid swarm of Abronia. Adams (1982) compared the
ordinations obtained from a hybrid index (Wells, 1980),
principal component analysis, principal coordinates
analysis, and discriminant function analysis using data from Lepomis and from Juniperus.
Both Neff & Smith (1979) and Adams (1982) in
comparing discriminant function analysis with the other ordination methods point out that the necessity of a priori definition of the groups in discriminant function analysis makes this method unsuitable for the initial detection of
hybrids. Neff & Smith (1979) found that where the
25
Neff & Smith (1979) and Adams (1982) further argue
that the requirements of multivariate normality and
equality of variance-covariance matrices in discriminant
function analysis limit its usefulness. Neff & Smith
(1979) found that aberrant specimens gave unpredictable results in the discriminant function analysis, which were
net found in the principal component analysis. Adams
(1982) found that transgressive character states gave similar unpredictable results in discriminant function analysis.
Pimentel (1981) found that principal coordinate
analysis and non-metric multidimensional scaling performed better than principal component analysis. Adams (1982) found that an F-ratio weighted hybrid index and F-ratio weighted principal coordinate analysis performed better than disoriminant function analysis and principal component
analysis. Thorpe (1980) examined the effect of
different types of standardization, similarity
coefficients, and ordination methods on the analysis of racial differentiation in the ringed snake Natrix natrix. He found that discriminant function analysis and principal component analysis of standardized data were preferable to
principal component analysis of unstandardized data,
principal coordinate analysis, and ncn-metric multi
dimensional scaling.
The disadvantage of discriminant function analysis, however, is that it requires equality of the within-group
covariance matrices. Thorpe (1983) argues that when
discriminant function analysis is used to ordinate
homogeneous a priori defined groups based on local
populations, then the within-group covariance matrices are
less likely to be heteroscedastic, than if used to
discriminate between predefined taxa or widespread races. However, these comparisons of the ordinations obtained using different methods are empirical in approach, in that they compared the ordinations obtained with a 'known' taxonomic model. Therfore, unless the taxonomic structure is known in advance, one cannot argue that any method is
the most appropriate for a given data set. Similarly
these arguments apply tc the choice of cluster analysis methods.
The aim. of this project was to examine th pattern of
variation in a possible species-hybrid-introgressant
complex, and therefore, in that the taxa studied were both closely related, and phenotypically plastic, the optimal character set was initially considered to be the maximum number of non-redundant quantitative characters.
As the characters were quantitative, the similarity coefficient used was the euclidean distance, and, given the
different properties and assumptions of the various
■■I
27
sum cf squares (ESS) method (Ward, 1963) were used to assess the phenetic similarities of the interspecific
hybrids and their parental species in this study. The
5. THE CHOICE CF A CHARACTER SET.
5.1 Formulation and definition of the characters.
The Senecio species which form the basis of this study are closely related, and there are few qualitative differences between them. The viscid indumentum which is
characteristic of S.. viscosus may be considered,
for reasons which are discussed later, a quantitative
character. Capitulum morphology in the sect. SENECIO is
generally uniform, and formal taxonomic treatments of the European members of this group (Alexander, 1975; Chater &
Walters, 1976) are largely based on quantiative
differences in capitulum size and shape, and ray floret ï
i development; ond on vegetative characters such as growth
habit and leaf shape.
The character set used in this study comprises 64
characters, of which 63 are meristic or continuous
variables and one is a multistate character. Two of the continuous characters are ratios.
Of the 64 characters, 34 are vegetative characters, 8 of these decribing growth habit, and 26 describing middle cauline leaf shape. Of the 30 capitular characters, 19 are based on the dimensions of the capitulum and its component parts, the involucre and the disc florets; 4 are indumentum characters; and 7 are ray floret characters.
The 26-character subset used to describe middle
cauline leaf shape is based on the architectural character set developed by Blackburn (1978) to classify leaves of
29
Saurauia (Actinidiaceae). The definition of the vein
orders used was that of Hill (1980) whereby secondary and intersecondary veins are distinguished on the basis of rank ordering of the vein length multiplied by the vein width at the point of insertion into the primary vein. Some modification of these systems was necessary for use
with the highly dissected leaves cf Senecio. In
particular, it was necessary to define the point of origin of the apical lobe, the extent of the auricle, and the geometry of the lobes.
In the 30-character subset used tc describe the capitulum, the 4 indumentum characters were based on the relative density of two classes of trichom.es on two parts of the invulucre, the calyculus bracts and the phyllaries. Crisp (1972) characterized the leaf trichom.es cf the
British Senecic species as either glandular or
non-glandular, the non-glandular trichom.es being
subdivided into two types, 'club' trichomes with a bulbous terminal cell, and 'whip' trichom.es with a slender,
sinuous terminal cell. In this study the density of the
glandular trichomes (glands) and the non-glandular
well as number between these of S. viscosus and S. squalidus.
The presence of ray florets is the diasgnostic
character in distinguishing S. vulgaris var. vulgaris
(rayless) from S_, vulgaris var. hibernicus and S_. vulgaris
var. denticulatus (both rayed). As this character is
controlled by a single gene with incomplete dominance the formulation of this character was considered in seme detail.
If the genotype TnTn, the non-radiate condition in S. vulgaris, is characterized as the absence of ray florets, i.e., as a binary character (+/-) or as the meristic character 'Number of ray florets' equals 0, then the other characters based on the ray florets, e.g., length, width,
etc., are conditionally present oharacters. This has the
effect cf giving excessive weighting to the single gene which controls this polymorphism.
Two lines of evidence, however, suggest that the Tn allele controls the presence of disc florets rather than the absence of ray florets. Ingram & Taylor (1982) found that in S. squalidus in which the non-radiate condition is
also controlled by a single gene with incomplete
dominance, there was an inverse correlation between ray floret length, the development of the androecium, and the
degree of fusion of the corolla. That is, the
heterozygotes were intermediate between the ray and the disc florets in morphology as well as length.
31
of ray florets, then one would expect that the number of
of disc florets in non-radiate S. vulgaris would be the
same as the number of disc florets plus the number of ray
florets in S_. vulgaris var. hibernicus.
A t-test was used tc compare the number of disc florets in 15 replicates of non-radiate S,. vulgaris (Line No. 11) with 15 radiate S. vulgaris plants (Line
No. 21). Both cf these lines originally came from the
same population (Appendix 1). The non-radiate plants had a mean of 53.000 disc florets per capitulum, and the radiate plants had a mean of 44.067 disc florets per capitulum, which gave t = 3.87, p = 0.001. If the total number of florets per capitula were compared then t =
-0.06, which gives p = 0.956. That is there was no
statistically significant difference between the total
number of florets in radiate and non-radiate S.
vulgaris. For this reason the ray florets were
considered to be 'outer florets', and measurement of the characters in the non-radiate plants was done on the cuter ring of disc florets.
5.2 Materials and methods.
23 purebred lines of the 8 species and varieties; S.
line, comprising a total of 115 plants, were grown under standardized conditions.
The 571 plants were grown in 3 batches, the first being sown on the 18th. June 1982, the second on the 9th. May 1983, and the third on the 1st. September 1983. All seeds were sown in trays of Levington ocmpost, and pricked
out at 21 days after sowing. The plants in the first
batch were potted on into 5-inch pots of John Innes No. 2 compost. The plants in the second and third batches were
grown in 5-inch pots cf soil mixture. The plants grown
in September 1983 were given supplementary lighting to
maintain a 16 hour photoperiod.
All plants were harvested on the first day of full
anthesis of the apical capitulum. Measurement of the
vegetative characters C02 to C08 (Plant Height,
Inflorescence Length, Number of Internodes, Basal Stem Diameter, Number of Leaves, Proportion of Lateral Shoots with Capitula, and Longest Leaf Length) were made on fresh material. Measurement of the length characters C02, C03,
C05 and CO8 was to the nearest millimetre. The leaf
nearest to the midpoint of the plant height (the midleaf) was removed, placed in a polythene bag, and deep frozen.
The apical capitulum was dissected, characters C35 to C47 plus character C53 were measured or counted during dissection. The calyculus bracts, the outer florets, and a sample of 10 disc florets from the center of the
capitulum, were placed on Sellctape and mounted on
microscope slides. Characters C48 to C52 and C54 to C63
33
an eyepiece graticule. Characters which were single
measurements were made tc the nearest 0.05 mm. Characters which were means cr ranges of multiple measurents were calculated to the nearest 0.01 mm.
After harvesting was complete, characters C09 to C34
were measured on the frozen leaf material. Linear
measurements were to the nearest mm, and angular
measurements were to the nearest degree.
5.3 The character set. COl Days to Flowering.
Defined as the number of days between the seed sowing and full anthesis of the apical capitulum. C02 Plant Height.
The length from the base of the stem, defined as the cotyledon node, to the level of the stigmas of the apical capitulum.
CO3 Inflorescence Length.
The length from the apical stem node, defined as the node subtending the apical capitulum, tc the level of the stigmas of the apical capitulum.
C04 Number of Internodes.
The number of interncdes between the cotyledon node and the apical stem node.
C05 Basal Stem Diameter.
The diameter of the stem at the cotyledon node. C06 Number of Leaves.
G H
K
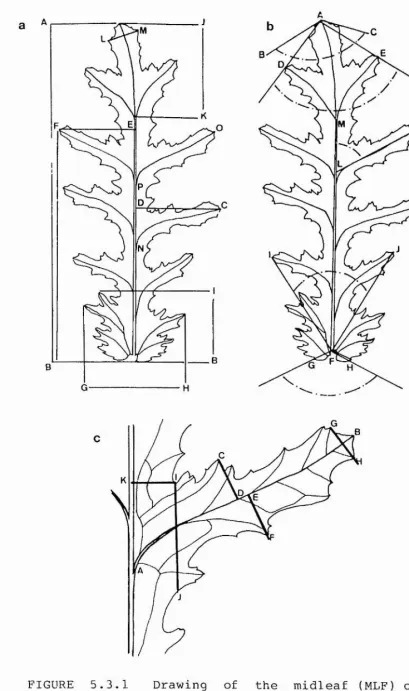
FIGURE 5.3.1 Drawing of the midleaf (MLF) of S.
[image:45.616.122.531.56.747.2]35
C07 Proportion of Laterals with Capitula.
The number of lateral buds and/or branches with capitula divided by the total number of lateral buds and/or branches.
CO8 Longest Leaf Length.
Length of the longest leaf, measured parallel tc the primary vein.
C09 Midleaf Length
Maximum length cf the midleaf (MLF), defined as the leaf attached to the stem nearest tc the the midpoint of the plant height (C02). Measured parallel to the
primary vein, from the base of the auricle to the
apex of the primary vein. Length AB in Figure 5.3.1a. CIO MLF Max Width R.
The maximum width cf the midleaf, measured
perpendicular tc the primary vein on the right-hand side of the primary vein. Length CD in Figure 5.3.1a. Cl1 Mlf Max Width L.
Defined as character CIO, except measured on the
left-hand side of the primary vein. Length EF in Figure 5.3.1a.
Cl2 MLF Base to Max Width R.
Defined as the length from the base of the midleaf to the point at which CIO (MLF Max Width P) intersects with the primary vein. Length BD in Figure 5.3.1a. Cl 3 MLF Base to Max Width L.
C14 MLF Auricle Length,
The maximum length cf the midleaf auricle, measured parallel to the primary vein, the auricle being
defined as that part of the basal lamina in which the 5
veins originate in the stem, i.e., below the base of the primary vein. Length BI in figure 5.3.1a.
C15 MLF Auricle Width.
Maximum width cf the midleaf auricle, measured
perpendicular tc the primary vein. Length GH in Figure 5.3.1a.
Cl6 MLF Kumber of Lcbes.
Defined as the number of secondary veins plus the
apical lobe. The apical lobe is defined as
originating at the point at which the secondary veins are cf equal thickness tc the primary vein. Point M in Figure 5.3.1b.
C17 MLF Apical Lobe Length.
Length cf the apical lobe measured parallel to the primary vein. Length KJ in Figure 5.3.1a.
C18 MLF Apical Lobe Width.
The sum of the maximum widths of the apical lobe cn
both sides of the primary vein. Measured
perpendicular to the primary vein. Length LM in /
Figure 5.3.1a.
Cl9 MLF Longest Lobe Length.
Defined as the length cf the longest secondary vein. Length OP in Figure 5.3.1a.
C20 MLF Mid-Lobe Length.
37
nearest tc the midpoint of the primary vein length. Length AB in Figure 5.3.1c.
C21 MLF Mid-lobe Max Width A.
Defined as the maximum width cf the Mid-lcbe cn the
apical side of the secondary vein, measured
perpendicular to the secondary vein. Length CD in à
Figure 5.3.1c.
C2 2 MLF Mid-Lobe FV to Max Width A.
Defined as the length from the primary vein tc the point at which character C21 (MLF Mid-Lcbe Max Width A) intersects the secondary vein. Measured parallel to the secondary vein. Length AD in Figure 5.3.1c. C23 MLF Mid-lobe Max Width B.
The maximum width cf the Mid-Lcbe cn the basal side of the secondary vein, measured perpendicular to the secondary vein. Length EF in Figure 5.3.1c.
C24 MLF Mid-Lobe PV to Max Width B.
The length from the primary vein to the point at
which character C23 intersects with the secondary t
vein. Measured parallel to the secondary vein. Length AE in Figure 5.3.1c.
C25 MLF Mid-Lobe Apical Width.
Defined as the sum of the lengths from the marginal ends of the tertiary veins adjacent tc the apex cf
the Mid-Lobe secondary vein to the points of
intersection with the secondary vein. Length GH in ^
Figure 5.3.1c.
C26 MLF Mid-Lobe Basal Width.
C27 MLF Mid-Lobe Lamina Width.
The width cf the primary lamina, from the centre of the primary vein tc the point of intersection of C26 (MLF Mid-Lobe basal Width) with the leaf margin. Measured perpendicular tc the primary vein. Length K1 in Figure 5.3.1c.
C28 MLF Intercostal Length A.
Length from the point of intersection of the Mid-Lcbe secondary vein with the primary vein tc the point of insertion of the apically adjacent secondary vein in the primary vein. Length DP in Figure 5.3.1a.
C29 MLF Intercostal Length E.
Defined as C28, except measured to the basally adjacent secondary vein. Length DN in Figure 5.3.1a. C30 MLF Apical Angle A.
Defined as the angle between the apex of the primary vein and the apices cf adjacent marginal tooth sinuses. Angle BAG in Figure 5.3.1b.
C31 MLF Apical Angle B.
Defined as the angle between the apex of the primary vein and the apices of the adjacent secondary veins. Angle DAE in Figure 5.3.1b.
C32 MLF Basal Angle A.
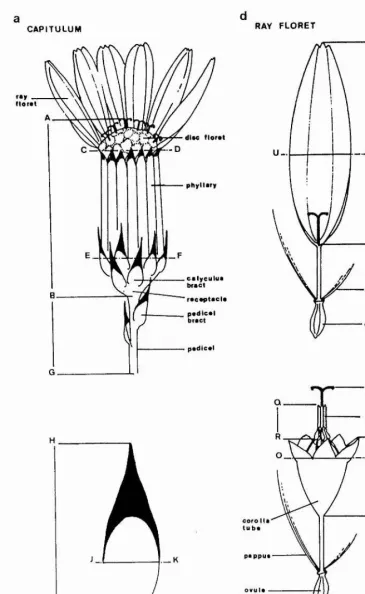
CAPITULUM RAY FLORET
—
tio rat
diac flo ral
,.-D
Ej _ F
— .V U_.
39
H
_ K
CALYCULUS BRACT
all# ma
'L..P
coro lia tuba
c
DISC FL O R E T
FIGURE 5.3.2 Drawing of the apical capitulum of S. vulgar is var. hibernicus showing (a) the capitulum
size and shape characters C35 to C38, (b) the
[image:50.615.124.490.35.630.2]C3 3 KLF Basai Angle E.
The angle between the base cf the primary vein and the apices of the adjacent basal lobes on either side of the primary vein. Angle IFJ in Figure 5.3.1b.
C34 MLF Secondary Vein Angle.
Defined as the angle between the Mid-Lobe secondary vein and the primary vein. Angle KLM in Figure 5.3.1b.
C35 Capitulum Total Length.
Defined as the length from the point at which the pedicel widens into the receptacle tc the stigmatic surface of the central disc floret. Length AB in Figure 5.3.2a.
C36 Capitulum Apex Width.
Diameter of the capitulum, measured at the level of
I
the outermost ring of disc florets. Length CD in
Figure 5.3.2a.
C37 Capitulum Base Width.
Diameter of the capitulum measured at the level of the base of the phyllaries. Length EF in Figure 5.3.2a.
C38 Pedicel Length.
maximum length cf the pedicel from the apical stem node to the point at which the pedicel widens into the receptacle.
C39 Number of Phyllaries. C40 Maximum Fhyllary Length.
41
Defined as the number of phyllaries with black and/or brown tips divided by the total number of phyllaries. C42 Max Phyllary Hair Density.
Defined as the maximum number of non-glandular
trichomes occurring on any single phyllary. C43 Max Phyllary Gland Density.
Defined as the maximum number of glandular trichomes occurring on any any single phyllary,
C44 Number of Calyculus Bracts.
Total number of bracts which are attached to the receptacle, i.e. bracts occuring above point B in Figure 5.3.2a.
C45 Number of Pedicel Bracts.
Total number of bracts which are attached to the pedicel, i.e., bracts occurring belcw between points E and E in Figure 5.3.2a.
C46 Mean Calyculus Bract Hair Density.
Mean number of non-glandular trichomes per calyculus bract, defined as the total number of hairs on the calyculus bracts divided by the number of calyculus bracts.
C47 Mean Calyculus Bract Gland Density.
Defined as C46, except for glandular trichomes
instead cf non-glandular trichomes. C48 Mean Calyculus Bract Length.
Defined as the sum of the lengths of the calyculus bracts, length HI in figure 5.3.2b, divided by the number of calyculus bracts.
Defined as the difference between the maximum and the minimum calyculus bract lengths.
C50 Mean Calyculus Bract Width.
Defined as the sum of the maximum calyculus bract widths {JK in Figure 5.3.2b) divided by the number of calyculus bracts.
C51 Calyculus Bract Max Black Tip Length.
Length cf the longest black tip on the calyculus. Length JH in figure 5.3.2b
C52 Calyculus Bract Max Black Tip Width.
Width of the widest black tip on the calyculus. Length JK in Figure 5.3.2b.
C53 Number of Disc Florets.
C54 Kean Disc Flcret Total Length.
Defined as the length from the base of the ovule to
the apex of the corolla tube lobes. Length ML in
Figure 5.3.2c. Mean of a sample of 10 disc florets from the centre of the capitulum.
C55 Mean Disc Floret Corolla Length.
Length from the base of the corolla, defined as the point of attachment of the stamens, to the apex of the corolla lobes. Length NL in Figure 5.3.2c. Mean of a sample of 10 disc florets used in C54.
C56 Mean Disc Flcret Corolla Width.
Defined as half the circumference of the corolla tube, measured at the base of the corolla lobes. Length OP in figure 5.3.2c. Mean of the sample of 10 florets used in C45 and C55.
[image:53.613.97.505.73.748.2]43
Maximum length from the base of the ''knees ^ to the apex of of the anthers. Length RO in Figure 5.3.2c. C58 Number of Ray Florets.
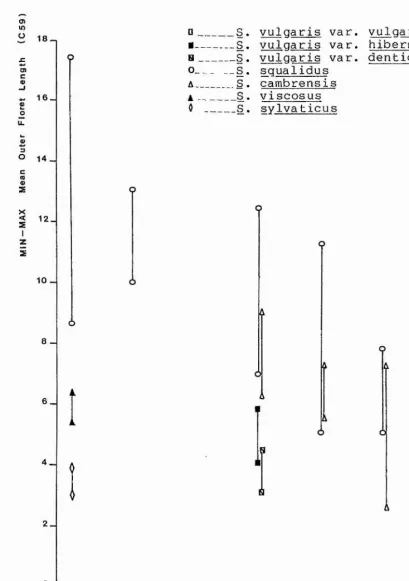
C59 Mean Cuter Floret Length.
Sum of the lengths of the outer florets, defined as
the length from the point of attachment of the
stamens to the apex of the ligule divided by the number of outer florets. Length TS in Figure 5.3.2d. C60 Range of Outer Floret Length.
Defined as being the difference between the maximum and the minimum outer floret lengths.
C61 Mean Cuter Floret Width.
Sum of the maximum widths of the outer florets divided by the number of cuter florets. Length UV in Figure 5.3.2d.
C62 Cuter Floret Ray Gland Density.
Sum. of the number of glandular trichomes above below the point of attachment of the stamens over the number of outer florets.
C63 Cuter Floret Tube Gland Density.
Mean number of glands occurring between the apex of the ovule and the point of attachment of the stamens cn the outer florets.
C64 Cuter Floret Anther Development.
Defined as a multistate character, the states and codes being:
a. complete absence of stamens and filaments. 0
f. 5 normal length filaments plus some develop ment of 3 to 5 anthers.
g . full development cf 5 anthers, anthers fused.
5.4 Assessment of the character set.
c. 3 to 5 short filaments. 2
d. 5 normal length filaments. 3
e. 5 normal length filaments plus seme develop- 4
ment cf 1 or 2 anthers. i
As discussed in section 4, the choice of the character |
set to be used in any numerical study is dependent on the è
purpose of the study. Maximizing the number of ■
f
characters is net necessarily the best strategy (Bisby, %
1970 , 1977), particularly if the characters are ->
incongruent, as is frequently found when different types “■
cf characters, e.g., biochemical and morphological, are J
used. In this study, in that it was an examination of 9
possible introgression between a group cf closely related @
taxa at the population level using only morphometric data,
the choice of the character set was based on maximizing |
the number cf non-redundant characters. Characters were ?
considered tc be redundant if (a) they did not distingish /
at least one of the species or varieties, or (b) they were correlated with other characters such that they cou Id not
be considered independent unit characters. 1
Assessment cf the 64-character set given in section 5.3 was done using the 23 purebred species lines. The
hybrid lines were excluded frcm these initial analyses, in w
45
determine the optimal character set to distinguish
Senecio species.
All computations in this section were carried out using the SPSS statistical package on a VAX 11 computer.
5.4.1 Univariate analysis of the character set.
The results of oneway analysis of variance of each of the 63 continuous characters is given in table 5.4.1, together with the results of 3 tests cf homogeneity of variances; Cochran's C, Bartlett Box F, and the maximum variance : minumum variance ratio.
All 63 characters had F ratios which gave
probabilities (p) of less than 0.0001, that is all 63 characters had F ratios which were statistically highly
significant. The capitular characters in general were
found to have F ratios greater than those cf the
vegetative characters. In particular the indumentum
characters C42 {Max Phyllary Hair Density), C43 (Max
Phyllary Gland Density), C46 (Mean Calyculus Bract Hair Density), and C47 (Mean Calyculus Bract Gland Density) had F ratios much greater than the ether characters
It was also found that the disc floret characters C55
(Mean Disc Floret Corolla Width), C56 Mean Disc Floret
Corolla Length), and C57 (Max Disc Floret Anther Length),
had F ratios greater than those of the outer floret