https://doi.org/10.1007/s11858-017-0899-8
ORIGINAL ARTICLE
Ways to teach modelling—a 50 year study
Hugh Burkhardt1,2
Accepted: 29 October 2017
© The Author(s) 2017. This article is an open access publication
Abstract
This article describes a sequence of design research projects, some exploratory others more formal, on the teaching of mod-elling and the analysis of modmod-elling skills. The initial motivation was the author’s observation that the teaching of applied mathematics in UK high schools and universities involved no active modelling by students, but was entirely focused on their learning standards models of a restricted range of phenomena, largely from Newtonian mechanics. This did not develop the numeracy/mathematical literacy that was so clearly important for future citizens. Early explorations started with modelling workshops with high school teachers and mathematics undergraduates, observed and analysed—in some case using video. The theoretical basis of this work has been essentially heuristic, though the Shell Centre studies included, for example, a detailed analysis of formulation processes that has not, as so often, been directly replicated. Recent work has focused on developing a formative assessment approach to teaching modelling that has proved both successful and popular. Finally, the system-level challenges in trying to establish modelling as an integral part of mathematics curricula are briefly discussed.
Keywords Modelling · Formulation process · Translations skills · Design principles · Numeracy · Mathematical literacy · Strategies for systemic change
1 Initial explorations 1963–1976
My work on the teaching of modelling was stimulated by pure mathematicians; this may be unusual, since I am a theo-retical physicist whose whole working life has been about modelling—applying, modifying and creating mathematical models of situations in the real world, albeit mostly quantum aspects that are very different from everyday life experience. Around 1959 a powerful wave of reform to school math-ematics, led by scientists and mathematicians in The West, was stimulated by the Soviet Union’s success in launching the first satellite, Sputnik. In the University of Birmingham, the drivers were Peter Hilton and Brian Griffiths. Peter, though he had been part of the Bletchley Park decipher-ing effort that ‘cracked’ the Enigma Code in World War II, was a distinguished topologist with an active interest in improving education. They started a weekly afternoon for high school mathematics teachers on the fundamentals of mathematics1; this proved popular but, after a few years,
the course organiser thought it time to have something on applied mathematics which was our responsibility in Math-ematical Physics. I was asked to co-ordinate the course.
In the first year, 1962–1963, I took a deeper look at the section of the Mathematics A-level course on Newtonian Mechanics (a peculiar British tradition, due to Newton and still going!) along with introductory lectures on modern topics from Quantum Mechanics and Relativity to Game Theory. As I worked through the 12 standard problem situ-ations in the mechanics syllabus (ladders against walls, projectiles, pendula, etc), I became outraged at the lack of serious attention to the situations being modelled. On the ladder problem, for example, why was only the ‘slipping instability’ considered? Why was there friction at the floor but not at the wall?
I decided that the course in the following year 1963–1964 should be about modelling. It included a ses-sion “On falling off ladders”, that considered all the ways that could happen, and why the standard situation is,
* Hugh Burkhardt
1 Shell Centre, University of Nottingham, Nottingham, UK 2 UC Berkeley, Berkeley, USA
indeed, particularly dangerous. For that you have to study what happens as a person climbs the ladder—not included in A-level; on the bottom part their weight increases the stability but above half way it’s the reverse, with poten-tially serious consequences! (Hence the practical guidance that another person should always stand on the bottom of the ladder.) The weekly sessions were similar, with analy-ses of a variety of everyday situations by the participants. The workshop pedagogy was a well-intentioned but fairly unsophisticated version of inquiry-based learning, with all the suggestions coming from the group. In fact I made a lot of input by writing the suggestions on the blackboard in a way that injected structure. (On seeing a video of one ses-sion a colleague, the great Paul Black, said unkindly “That was a great interactive lecture you gave there, Hugh”.)
The course notes included an early version of the mod-elling diagram that specifically identified both the usual transition processes and the intervening model states. (The PISA version does this too.)
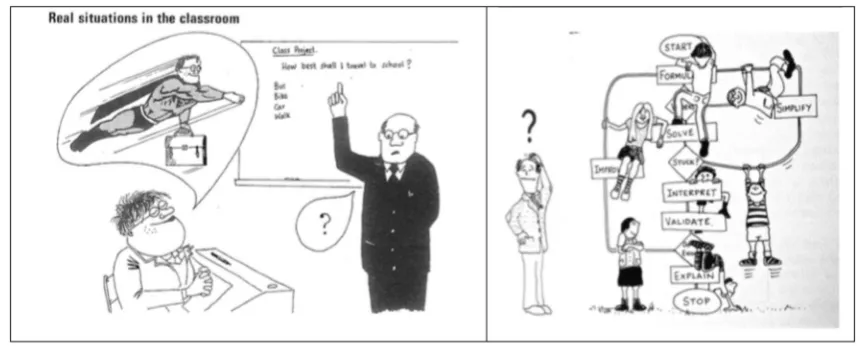
The results of these early explorations formed the basis of The Real World and Mathematics (Burkhardt 1981), written after I moved into mathematics education profes-sionally as Director of the Shell Centre. I had negotiated with the University a revised brief for the Centre, focused on research and development aimed at direct impact on improving practice. Recognizing the importance of cre-ative design in this mission I was able to discover and recruit Malcolm Swan, whose contributions have played such an important role in the Centre’s work. Figure 1
shows his skill, insight and gentle wit.
On modelling, several things had become clear—for example, the need for “translation skills among dif-ferent representations " (see e.g. Janvier 1978) and a deeper understanding of the processes summarized in the
modelling diagram. I found it useful to distinguish, among other things:
• analytic modelling based on the underlying structure of the problem situation from the descriptive modelling
involved in data analysis and curve fitting;
• different levels of ‘reality’ in problems, which I summa-rised as: Action, Believable, Curious, Dubious and Edu-cational. Application problems in most curricula rarely rise above the Dubious, the real context being purely cos-metic; my goal was to include a lot of Believable prob-lems (Educational problems are essentially Dubious but irresistible for concept development).
Since that time there have, of course, been numerous studies of the teaching of modelling—for example in the series of ICTMA books and in volume 38(2) of this jour-nal—which the present volume carries forward. Here, in the spirit of the title, I will focus on the things that I and my col-leagues have studied—the insights we found, and the tools we have developed for teaching, assessment and professional development. The theoretical basis of the work is unapolo-getically heuristic.
2 The elements of formulation
[image:2.595.81.515.56.229.2]report (Treilibs, Burkhardt and Low 1980). Since I believe they are important, and have not been superseded, it is worth describing the key features here.
The research design aimed to compare the performance of individual students on a set of holistic modelling tasks with tasks that tested component skills of model formula-tion, described as:
GV: Generating variables—the ability to generate the vari-ables or factors that might be pertinent to the problem situation.
SV: Selecting variables—the ability to distinguish the rela-tive importance of variables in the building of a good model.
Q: Specifying questions—the ability to identify the specific questions crucial to the, typically illdefined, realistic problem.
GR: Generating relationships—the ability to identify rela-tionships between the variables inherent in the problem situation.
SR: Selecting relationships—the ability to distinguish the applicability of possible relationships to the problem situation.
We chose a group of 118 17-year-old students who were high-performing in Mathematics. Though their course included the models of Newtonian Mechanics,2 they had not
been taught modelling skills—nobody had. (Their teachers
were asked to estimate their likely modelling ability and these estimates were in broad agreement with the test per-formances in the study.)
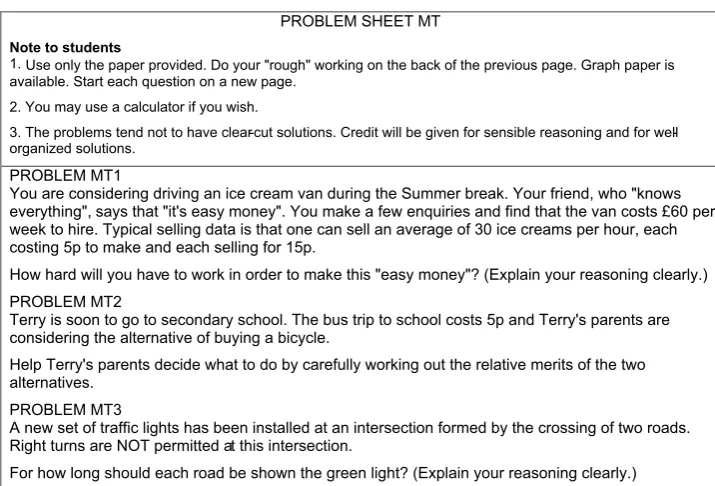
The first challenge was to assess overall modelling skill in a ‘screening test’, Fig. 2. The three tasks used were designed with a ‘ramp’3 of increasing modelling challenge. In the first,
MT1, enough data is given for a straightforward solution, while needing little of the modelling skills that the other two problems require. It was included to provided evidence that the test was not simply measuring conventional math-ematical ability. The modelling questions, MT2 and MT3, were designed to fit the following criteria: that the problems should be real; that the problems pose most of their difficulty in the formulation phase and have relatively simple solution phases; that the problems be amenable to analytic modelling. Performance on these tasks was our measure of overall mod-elling skill.
The detailed scoring schemes gave credit for responses that: showed grasp of the essence of the problem; took into account a greater number of significant aspects; in treating each aspect moved up from discussion through quantification and reasonable calculation to gener-alization (Piloting showed reasonable correspondence between holistic impression and detailed approaches to scoring).
As expected, most of this highly capable group made rea-sonable attempts at the first problem MT1, though a few of the students were unhappy having to tackle problems that Fig. 2 The ‘screening test’ of
overall modelling ability Note to students PROBLEM SHEET MT
1. Use only the paper provided. Do your "rough" working on the back of the previous page. Graph paper is available. Start each question on a new page.
2. You may use a calculator if you wish.
3. The problems tend not to have clear-cut solutions. Credit will be given for sensible reasoning and for well-organized solutions.
PROBLEM MT1
You are considering driving an ice cream van during the Summer break. Your friend, who "knows everything", says that "it's easy money". You make a few enquiries and find that the van costs £60 per week to hire. Typical selling data is that one can sell an average of 30 ice creams per hour, each costing 5p to make and each selling for 15p.
How hard will you have to work in order to make this "easy money"? (Explain your reasoning clearly.) PROBLEM MT2
Terry is soon to go to secondary school. The bus trip to school costs 5p and Terry's parents are considering the alternative of buying a bicycle.
Help Terry's parents decide what to do by carefully working out the relative merits of the two alternatives.
PROBLEM MT3
A new set of traffic lights has been installed at an intersection formed by the crossing of two roads. Right turns are NOT permitted at this intersection.
For how long should each road be shown the green light? (Explain your reasoning clearly.)
2 The UK is one of very few countries that include mechanics in mathematics as well as in physics. Indeed the curriculum is still much as Newton designed it!
[image:3.595.184.542.52.295.2]were not fully specified. Feedback from the students indi-cated that in general they found MT1 “good”, MT2 “vague” and MT3 “difficult”. Furthermore it was clear that they saw little similarity in the two modelling problems and, conse-quently, that the two problems were treated in a dissimilar fashion by the students: in the bus v bicycle problem, MT2, many factors were retained in the analysis, while the traf-fic lights problem, MT3, tended to require a more powerful treatment of a more concentrated nature. Students had little trouble with the underlying economic model of MT2—in this respect the problem was similar to MT1 and the scores correlated at 0.48. However, the improvement of the solu-tion beyond the calculasolu-tion of basic costs for each form of transport proved to be a discriminating task. There was little correlation between the scores on MT2 and MT3, the latter having a much larger variance.
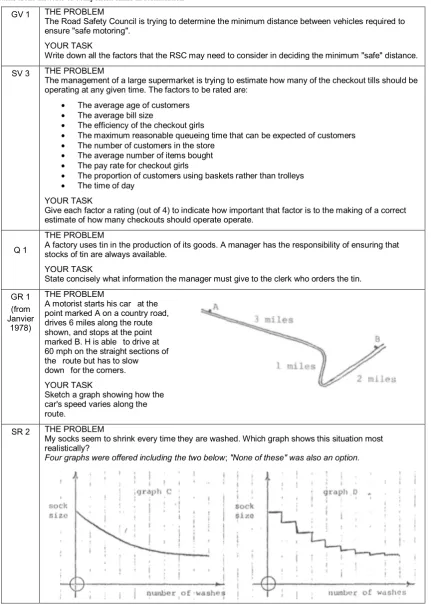
Examples of the tasks for the various sub-skills (there were 3 tasks for each) are shown in Table 1. The correlations between the overall scores and those on the subskills tests are shown in Table 2.
The overall results of this Section make it clear that good modellers, as defined by the screening test, are better than other students of comparable mathematical ability in the modelling subskills:
Q identifying questions, GR generating relationships, and SR Selecting relationships
This is not, in retrospect, a surprising result but the evi-dence is valuable.
The mathematics they chose to use was more broadly interesting. Numerical assumptions and calculations dominated while some students used tables and graphs. These students all had 5 years of successful experience in algebra yet no student used algebra, even though the situations seem ideal for algebraic models. They had a ‘reading knowledge’ of algebra but could not express their thinking algebraically. It was this work that first led me to articulate the concept of The Few Year Gap between the mathematics a student can use in imitative exercises and that they have sufficiently absorbed and connected to use autonomously in non-routine problem solving. This key concept remains too little understood; people still complain that “the mathematics is not up to grade” though that is inevitable if a complex non-routine prob-lem and a routine exercise are to have comparable over-all difficulty (see http://map.mathshell.org/background. php?subpage=summative).
Vern also explored a more detailed diagrammatic analy-sis of the processes within the formulation phase but found there was so much ‘looking back’ and ‘looking forward’ that the ‘grain size’ of the now traditional modelling phases is appropriate. More detail can obscure the key features.
3 The Shell Centre program 1980–1988
The 1980s saw a surge of creative research and development in UK mathematics education, inspired by the government-sponsored Cockcroft Report (1982). Using mathematics to tackle real problems was recognised as an important learning goal and groups around the country and the world shared their developing design expertise. This led David Burghes to organize the first ICTMA conference, in Exeter in 1981. The proceedings of successive ICTMA-conferences have been published since 1984 every second year, initially by Horwood Publishers and since ICTMA13 by Springer; they summarize the developing story of the teaching of mod-elling around the world. Having identified the dominant influence of the tasks in high-stakes examinations on what happens in British classrooms,4 the Shell Centre program
was developed in association with the Joint Matriculation Board (JMB), the largest UK examination provider, under the series title Testing Strategic Skills (TSS). An innovative change model set out a process of gradual improvement, designed to make the pace of change digestible to teachers. The plan was to introduce one new task-type each year to a high-stakes examination, in this case for age 16 students, with well-engineered materials developed to support the new teaching and professional development challenges involved. This engineering research approach has guided Shell Centre work since (see Burkhardt 2006a, 2009).
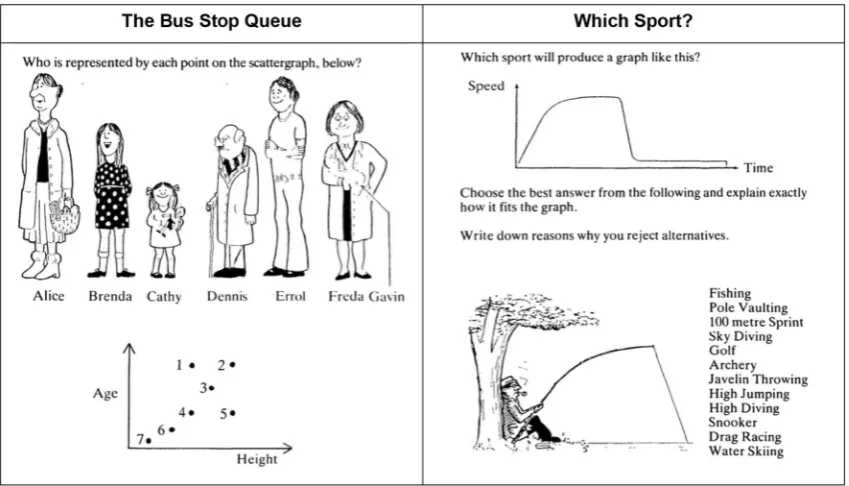
The work on formulation had brought out the importance of ‘translation skills’. This led to the design and develop-ment, led by Malcolm Swan, of The Language of Functions and Graphs (Swan et al. 1985), a module focused on model-ling everyday life situations with line graphs and algebraic functions. Often called “The Red Box”, this module was influential in that this topic area became widely accepted and implemented in curricula and assessment around the world. The Red Box materials influenced many other systems and, 40 years later, are still admired, imitated and used.5
The tasks in Fig. 3 shows something of their liveliness and originality.
The TSS model of gradual change in examination and curriculum proved popular with students and teachers, who: enjoyed the challenge, were glad to back on more famil-iar ground after 3 weeks, and looked forward to next year’s module. The model died after just 2 years because a major reorganization—so often the ‘cause of death’ of improve-ment programs.
4 WYTIWYG (what you test is what you get) was coined at that time. WYSIWYG word processors now dominate.
Table 1 Tasks from the tests of component skills in formulation
GV 1 THE PROBLEM
The Road Safety Council is trying to determine the minimum distance between vehicles required to ensure "safe motoring".
YOUR TASK
Write down all the factors that the RSC may need to consider in deciding the minimum "safe" distance.
SV 3 THE PROBLEM
The management of a large supermarket is trying to estimate how many of the checkout tills should be operating at any given time. The factors to be rated are:
• The average age of customers • The average bill size
• The efficiency of the checkout girls
• The maximum reasonable queueing time that can be expected of customers • The number of customers in the store
• The average number of items bought • The pay rate for checkout girls
• The proportion of customers using baskets rather than trolleys • The time of day
YOUR TASK
Give each factor a rating (out of 4) to indicate how important that factor is to the making of a correct estimate of how many checkouts should operate operate.
Q 1
THE PROBLEM
A factory uses tin in the production of its goods. A manager has the responsibility of ensuring that stocks of tin are always available.
YOUR TASK
State concisely what information the manager must give to the clerk who orders the tin.
GR 1 (from Janvier
1978)
THE PROBLEM
A motorist starts his car at the point marked A on a country road, drives 6 miles along the route shown, and stops at the point marked B. H is able to drive at 60 mph on the straight sections of the route but has to slow down for the corners. YOUR TASK
Sketch a graph showing how the car's speed varies along the route.
SR 2 THE PROBLEM
My socks seem to shrink every time they are washed. Which graph shows this situation most realistically?
[image:5.595.84.516.64.670.2]4 Numeracy through problem solving
1985–1989
Encouraged by the reception of the TSS modules, the Shell Centre and the JMB agreed to develop a curriculum com-ponent focused on mathematical literacy. Designed for stu-dents in the age range 11–16, it took the form of five 3-week modelling projects, each tackling a specific real-world chal-lenge of concern or interest from everyday life. (They have also been used successfully with younger children, and with adults to show what a curriculum focused on mathematical literacy might mean.) The five modules are Design a Board Game, Produce a Quiz Show, Plan a Trip, Be a Paper Engi-neer, Be a Shrewd Chooser (Swan et al. 1987–89).
Each NTPS module provides a theme within which the students take responsibility for planning, organizing and
designing. They are based around the everyday interests of most students. Students work both individually and in groups, choosing which areas of mathematics to deploy in tackling the problem. They also implement the results of their own decisions - a vital educational experience! Each module is designed to take between 10 and 20 h to complete.
The modules work on a group-project basis, and have four stages. The work is primarily guided by a student book-let, with the teacher playing a facilitative consultant role. In Stage 1 students explore the domain by working on and evaluating exemplars provided. Stage 2 is about generating and sifting ideas, which are developed and implemented in detail in Stage 3. In Stage 4, each group evaluates the things that the other groups have produced. These stages take forms which fit the context of the module, illustrated here for Be a Paper Engineer. (http://www.mathshell.com has extracts from each module.)
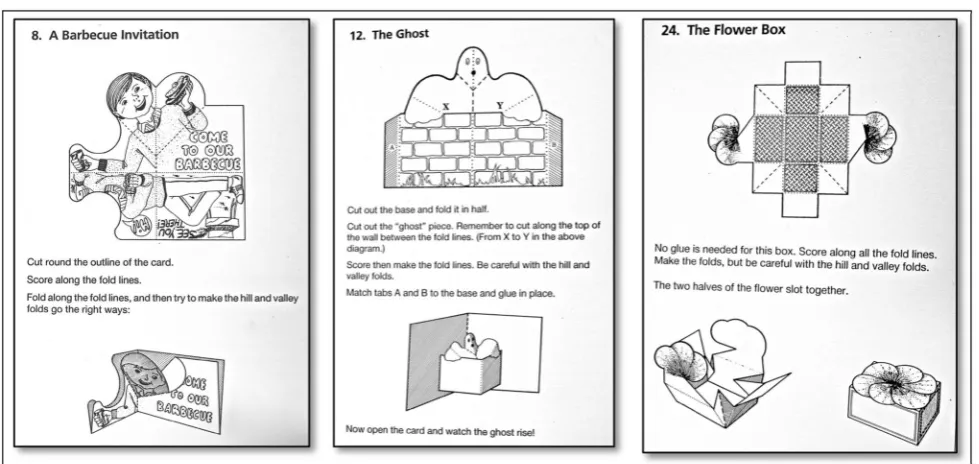
In Be a Paper Engineer, students design, make and evalu-ate 3-dimensional paper products including gift boxes and pop-up greetings cards. In doing this they explore 3-dimen-sional shape-and-space, making generalizations using words and algebra.
Stage 1 In groups, students make a wide variety of pop-up cards, gift boxes and envelopes from nets provided in order to familiarize themselves with the techniques involved. Figure 4 shows three of the 30 examples Malcolm Swan and the team designed. Students classify them according to their perception of the structures involved.
Table 2 Correlations between overall modelling screening test and subskills tests
**Probability of random occurrence is < 0.01 (99% confidence level) Sub-skills v modelling skill MT1 MT2 + MT3
GV (F1) 0.10 0.30**
GV (F2) 0.15 0.24**
SV 0.17 0.08
Q 0.28** 0.37**
SR 0.07 0.35**
GR 0.24** 0.38**
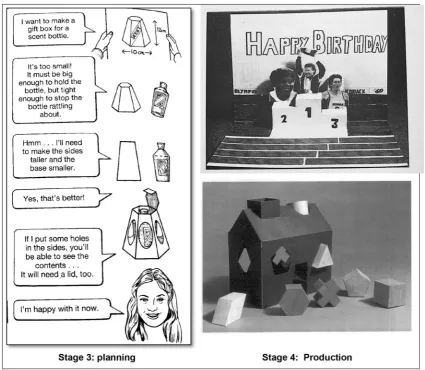
[image:6.595.51.291.82.178.2] [image:6.595.86.511.448.691.2]Stage 2 Students investigate a few techniques. These include a 2-dimensional representation of a 3-dimensional product, explaining design features, making a 3-dimen-sional product etc. Figure 5 shows a simple example—note the emergence of parallelogram theorem results from this investigation. Other examples were more sophisticated.
Stage 3 The group pools ideas for paper products and then, individually, students attempt to design and make an accurate version of one of the products.
Stage 4 Students now attempt to produce ‘kits’ of their designs so that other people can make the products.
Figure 6 shows examples of student creations from the classrooms in which this module was developed.
Fig. 4 Paper products to construct and analyze
[image:7.595.54.544.54.286.2] [image:7.595.55.544.334.584.2]It is worth pointing out the modelling elements in this work, involving as it does both geometry and algebra. These may be summarised as:
Formulating
Identify specific questions:
“How can I make a card that pops out like this..?”
Make simplified drawings:
“Let’s simplify this card so we can see its structure…”
Represent mathematically:
“How can we draw this 3D shape in 2D … ?”
Identify significant variables:
“Which lengths/angles are important here?”
Generate relationships:
What relationship between lengths for the card to work?”
Make a plan
“What shall we design and how?"
Solving
Carry out the plan, monitor progress
“Can we draw before making cuts?”
Select and use appropriate mathematics:
“Can we use some of the principles we discovered?”
Interpreting and Evaluating
Interpreting results:
“Can you interpret John’s instructions for making the box?”
Evaluating the solution: "How well does the plan work?"
“Can you reconstruct the card from John’s instruc-tions?”
The other modules, while designed on the same princi-ples, are in contexts that make them sufficiently different to be worth a brief outline.
[image:8.595.84.510.55.425.2]In Design a Board Game, groups design and produce their own board games. These games are then played and evaluated by other class members. (This involves developing ideas from 2-dimensional shape-and-space, together with basic concepts of probability.)
• Students play a number of games6 that are provided,
dis-covering and classifying the more and less obvious faults and shortcomings built in—unfair, can’t end, etc—and suggesting improvements.
• Students in a group share their ideas, then develop a rough plan for their own board game.
• Each group of students produces a detailed design, makes it, and checks the finished version.
• The groups exchange games and test them. When they are returned, each group re-assesses its own game in the light of another group’s comments.
In Produce a Quiz Show students devise, schedule, run and evaluate their own classroom game shows. This involves preparing, timing and testing questions using number and statistical concepts, planning room layouts, and scoring systems.
• Groups of students take it in turns to act out a number of TV-type quizzes that are provided, identifying and com-menting on faults and shortcomings in the organization, rules, questions, scoring systems and presentation.
• Students in a group share ideas for their own quiz, reach agreement on which to develop, and draw up a plan of action.
• Each group prepares, tests and organizes its questions, scoring systems, rules and final running order. Groups also decide how the furniture and equipment will be arranged during the presentation of the show.
• Groups take it in turns to present their quizzes, with the rest of the class acting as competitors and audience. Afterwards, each quiz is evaluated first by other members of the class, and then by the group who produced it. A further opportunity may be given for a group to enact their quiz with different groups of contestants - perhaps a different class.
In Plan a Trip students plan and undertake a class trip out of school. (This involves costings, scheduling, surveys and everyday arithmetic.)
• In a card game simulation, groups undertake and record imaginary trips, encounter problems and errors of judge-ment, then seek to correct them by better planning.
• Students in a group share ideas of possible places to go and produce a leaflet explaining these ideas. The class then work together to reach a decision on the best desti-nation and look at possible means of transport.
• The class lists, and then shares out and undertakes the preparatory tasks that need to be done before the trip can take place.
• The trip now takes place and, afterwards, the students reflect on what happened, identifying successes and fail-ures.
In Be a Shrewd Chooser, students research and provide expert consumer advice for ‘clients’ in their class.
• Students listen to a radio show on audiotape which con-tains a number of interviews with people who have just bought different products, and an interview with two stu-dents who have been involved in producing a consumer report on choosing orange drinks. As students reflect on and analyse the tape and the report, they begin to con-sider important factors that are taken into account when making a choice and different methods of making con-sumer decisions.
• Students in a group now begin to work on their consumer report. They have to choose a product and decide on their research aims and methods.
• Students develop their plan. They will be involved in conducting surveys, writing questionnaires and carry-ing out experiments in the classroom. They will also be considering how best to present their findings. This could involve posters and oral presentations in addition to writ-ten reports.
• All the written reports are circulated around the other groups, and any group making an oral presentation does so. The reports are evaluated by the rest of the class, and then each group improves its own report taking into account these comments.
In all the modules the class comes together from time to time, to consider issues that arise and in the final evaluation phase. For example, a major early challenge of Plan a Trip
is the class agreeing on the choice of destination.
The assessment of each module was at three levels: Basic, Standard and Extension. The Basic level assessment was carried out by the teacher, based on assessment tasks built into the module materials; it’s main goal was formative—to check that every student was up to speed with the group’s work. Standard and Extension levels were assessed through timed written examinations, administered by the JMB. Their goal was to assess students’ ability to ‘transfer’ the skills they had learned in the context of the module to other con-texts. For Standard level these were closely related (e.g. other board games); for Extension level, less close. This 6 The fact that these badly-designed games “came from the exam
approach has the advantage of ‘controlled transfer distance’, since the module gave each student the same basic experi-ence in solving that kind of problem.
Despite the enthusiasm of the teachers and students of all performance levels in whose classrooms this work was developed, its initial take-up was modest, and mainly confined to low-achieving classes where teachers are more willing to innovate. The roots of the scheme in ‘numeracy’, together with its emphasis on practical activity, made some teachers reluctant to use it with more able students. The time involved for each module, 10–20 h, was too much for many teachers. Teachers also found that NTPS took them outside what they understood to be Mathematics. (In some schools it was adopted as a cross-curricula scheme.) As always with teaching modelling, the pedagogy was very different to what they had been used to in a curriculum dominated by proce-dural learning.
Later, a syllabus for the established GCSE examination for age 16 was built around the modules. This increased the take-up until the introduction of the National Curriculum in 1990 swept aside the many excellent developments of the 1980s—its design, based on detailed content criteria, had the unintended but inevitable consequence (Burkhardt 2009) of reducing ‘mathematics’ to a checklist of short procedures.
These five modules exemplified the modelling process in a form that teachers and students could grasp. The theoreti-cal grain size exemplified in the standard modelling diagram proved digestible to students as supportive insight for their work on the problem7.
5 Bowland mathematics 2006–2010
This collection of teaching and professional development materials was funded by the Bowland Charitable Trust, with contributions from the Department for Education to coincide with a new version of the National Curriculum for England for 11–14 year old students. The project broke new ground in several ways, starting with the approach to commissioning: A clear framework was set out by the funders: the Bowland Trust and the overall director Quentin Thompson, along with an expert advisory committee. Quentin based it on the Har-vard Business School “case study” approach to learning, looking for modules, lasting 4–5 lessons, based on real world contexts in which the need for and form of mathematics
involved would not be clear at the beginning. Rather than the usual practice of requiring tenderers to produce fully developed proposals at their own expense, the commission-ing started with an open invitation to submit 1-page out-lines—resulting in around 200 ideas, of which 40 were each awarded £5,000 funding for the development of full propos-als. In this process the Shell Centre’s original 10 ideas, were reduced to 3, then to the 2 commissioned: Reducing road accidents and How risky is life? Overall, the project com-missioned 26 “case studies” from 14 diverse groups includ-ing university educational research groups, TV/media stu-dios, educational computing suppliers and one enthusiastic teacher. The use of technology varied between “case studies” from materials to download and print, through collections of videos for whole-class use to entirely interactive activities.
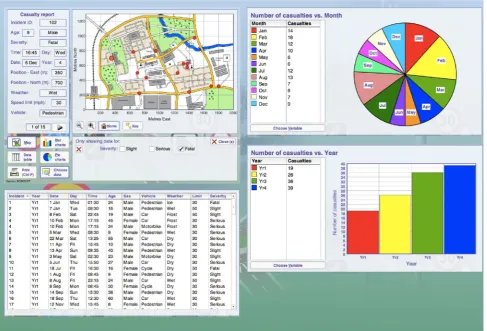
Reducing road accidents (Pead and Swan 2008) was built around a custom-tailored database of 120 reports on the road accidents in a small fictional town. This allowed the students to explore various factors involved in each accident. The data could be selected in terms of these variables and displayed in various ways, see Fig. 7.
The task, working in pairs, was to prepare and justify advice for the town council, given the cost of various improvements, on the best way to reduce accidents within a specified budget. This module was among the most popular in schools. The students clearly engaged in and enjoyed the work, seeing it as relevant to life in the real world—a key goal of the project. Reports were carefully prepared, some-times supported by Powerpoint presentations.
How risky is life? (Burkhardt, Swan and Pead 2008) aimed to confront students with the mismatch between their media-driven impressions of the hazards of every-day life and the facts. Since hazard has two factors, the seriousness of the event and the probability of it happen-ing, we decided to fix the first by confining ourselves to lethal risks: deaths in a year from unnatural causes, then all deaths in a year. Early trials confirmed the well-estab-lished fact8 that probabilities are most easily grasped when
re-expressed in terms of numbers within a defined popula-tion; we chosen the population of England, ~ 50,000,000. The student challenge then came in understanding large numbers. For this Malcolm Swan designed a key presenta-tion: a sheet of paper with 10 rows of 10 ‘large’ squares, each of which was divided into 10 by 10 small squares. Each small square thus represented 5000 people.
In the first lesson students, who had been asked to look at newspapers, were encouraged to suggest various unnat-ural causes of death and to estimate how many people 7 A cautionary note—around this time I worked with Oliver Penrose
and others at the Open University in the design of a modelling unit for the revised introductory mathematics course. The core problem was modelling the changing water level in a plastic container with a hole in the bottom. Typical student feedback was “We could solve the problem OK but had a terrible time relating it to The Six Box Dia-gram”.
die of each in a year—as expected, murder and terror-ism loomed large. The estimates were shared and rank-ordered- on a wall or a line strung across the classroom. In the second lesson they looked at the actual data from national statistics and compared it to their speculations— accidents at work, then on roads, led the field, with terror-ism vanishingly small. Students were then asked to colour in the various numbers on the sheet of squares; the total, typically ~ 10,000, is represented by just two of the small squares. This representation powerfully makes the point that in the UK these risks are very low—in contrast to impressions given in the media. Lesson three goes on to look at health-related deaths: their age dependence, how for the 15–25 age group there are large gender differences, and how these arise.
This module uses technology only in the final lesson where a simulation looks at the expected year-to-year fluc-tuations (~ 100; the √N heuristic is noted). This makes the point that terrorism is not detectable against this back-ground, even in the UK’s worst year, 2005, when about 50 people were killed. It’s not a serious risk—but it does sell newspapers.
6 The Shell Centre‑Berkeley program 1992–
2015
The most recent Shell Centre experiment on teaching model-ling was carried out in the context of formative assessment for learning. The review of research by Paul Black and Dylan Wiliam (1998) had shown the power of this approach, when done well, in forwarding student learning. The Mathemat-ics Assessment Project (2014), a collaboration between the Shell Centre and the University of California at Berkeley, set out to see how far teachers can be supported in the pedagogi-cal and mathematipedagogi-cal challenges inherent in high-quality formative assessment through teaching materials designed for this purpose. (Earlier attempts had worked through a professional development approach. This proved expensive, requiring work with expert leaders over many years.) Of the 20 “Classroom Challenges” for each grade, 6 through 10/11, about a third are on problem solving, mostly modelling (the others focus on concept development). I shall illustrate the design principles and structure (see Swan and Burkhardt
[image:11.595.56.544.59.390.2]The structure of these “Classroom Challenges”9 is as
follows:
In a prior lesson, the problem situation and the task are presented to students, who each tackle the problem unaided. The Matchsticks task is shown in Fig. 8. (The US still uses traditional units, which makes the task more challenging technically, but not conceptually; the metric equivalents we use in other countries are, in order: 25 m, 60 cm, 2, 2, 50 mm.)
The teacher collects and makes an overall assessment of the student work (without scoring it) and prepares qualitative feedback on the reasoning. In this they are supported by the
Common Issues table, which lists the challenges students are likely to have and suggests non-leading questions or prompts—mostly questions—for each. The first few entries for Matchsticks, Table 3, make the point.
The other ‘issues’ in this lesson are: uses an inappropriate formula; works unsystematically; work is poorly presented; has difficulty substituting into a formula.
The main lesson structure is as follows.
• The teacher re-introduces the main task.
• Students respond to the prepared questions by reviewing and revising their individual solutions.
• The students, working in small groups, compare their solutions. From this discussion they produce a poster showing a joint solution—completing the inherent peer assessment.
• The posters are displayed promoting an inter-group dis-cussion. Groups compare approaches, justifying their own and recognising others.
• Each group now analyses and critiques sample student work we provided,10 Fig. 9. This leads them to discuss
approaches they may not have considered. The groups then work to improve their solutions to the problem.
• Whole class discussion follows, seeking to combine a review of what has been learned with discussion of the processes, assumptions and their implications, and alter-native representations, their strengths and weaknesses.
The role of sample student work, another design tactic used in this work, is interesting (Evans and Swan 2014). The two samples in Fig. 9 are chosen to illustrate the range. The first response sees the problem in 2-dimensions; apart from that, there is evidence of an estimation process for areas, albeit with errors. The second response is more powerful, Fig. 8 The task from the
Match-sticks Classroom Challenge
Matchscks are oen made from pine trees – this tree this tree is 80 feet high with a base diameter of 2 feet
Matchscks are rectangular prisms 1/10 inch by 1/10 inch and 2 inches long
Esmate how many matchscks you can make from this tree.
Table 3 Part of the common issues table for Matchsticks
Common issues Suggested questions and prompts
Has difficulty getting started What do you know? What do you need to find out? How could you simplify the problem?
Ignores the units
For example: the student calculates the volume of a matchstick in cubic inches and the volume of the tree trunk in cubic feet
What measurements are given?
Does your answer seem reasonable if you consider the size of a matchstick compared to the size of a pine tree?
Makes incorrect assumptions
For example: the student multiplies the volume of the tree trunk in cubic feet by 12 and assumes this gives the volume of the tree trunk in cubic inches
Can you explain why you have multiplied by 12?
When you figure out a volume how many dimensions do you multiply together? How does this calculation effect how you convert the volume from cubic feet to cubic inches?
Can you describe the dimensions of the tree in inches? What do you notice?
[image:12.595.185.528.60.210.2] [image:12.595.45.545.248.384.2]seeing it as a volume problem, gets the matchstick volume correct, but ignores tapering of the tree, recognises but mis-handles the conversion of cubic feet to cubic inches, and shows no sense of appropriate accuracy (a much neglected issue in many curricula). I go into this detail to illustrate the value, and the challenge, of asking students to analyse sample student work.
The impact of this work has been remarkable—with sup-port from the Bill & Melinda Gates Foundation that funded the project, there have been over 7,000,000 lesson down-loads so far. Evaluations show widespread enthusiasm and suggest a considerable impact on teachers and on learning (Inverness Research Associates 2014; Herman et al. 2014). The concept-development lessons have been more popular than the modelling lessons, though the pedagogical demands are similar. This is not surprising since teachers are already focused on the challenges of teaching concepts and skills.
7 Comments on the theoretical approach
The theoretical approach of this work has been essentially heuristic. Like Polya’s in How to solve it (Polya 1945), it started with my reflections as a professional modeller but these were tested and developed, largely from empirical feedback in the design and development process. I believe that this is the right approach for work whose priority is improving practice rather than building fundamental theory (see Burkhardt 1988). Of course, the work described here
builds on many results of educational research; for example,
as well as those referenced above, the “classroom contract” concept of Brousseau (1997), Hatano and Inagaki’s (1986) “adaptive expertise” as developed in Swan (2006) are central to the work.
A comparison with medicine is useful (Burkhardt and Schoenfeld 2003). A century ago medical practice was largely empirical. Though too often based on the experi-ence of individual physicians or surgeons, analysis of observations had discovered some general principles—for example, that it was better if surgeons washed their hands between patients and wells were not located near sewers. The influence from more fundamental theory got started, notably with Pasteur’s work on the source of infections. Over the last century the growth of our fundamental understand-ing of biology has greatly increased the input from science into medical practice, though much remains empirical; for example, nearly a century after Fleming’s chance observa-tion of the effect of penicilium mould, most new antibiotics are still sought by testing thousands of wild organisms— though this may be beginning to change through the use of DNA engineering techniques like CRISPR. (That this came 65 years after the discover of the structure of DNA is a use-ful reminder of the timescale of turning theoretical advances into practical applications.)
Educational research seems many decades behind research in medicine for a variety of reasons (not exclusively lack of funding, see Burkhardt 2015), so a heuristic approach that complements deeper understanding is important in sup-porting the improvement of practice. If done well, it has substantial theoretical outputs of a phenomenological kind, often expressed as design principles of the kind described above. If such principles are to be useful in design, they need empirical warrants for the generalizability, which requires parallel studies that explore boundaries of validity; unfor-tunately, replication is not highly regarded in the academic Fig. 9 Student responses to the Matchsticks task
[image:13.595.77.516.55.239.2]value system is education, and so is rare. These issues are discussed further in (Burkhardt 2013, 2014).
8 The challenges of systemic improvement
1984–?
As result of research and development over the last half-century (see for example, Muller et al. 2007), I believe it is fair to assert that:
We now know how to enable typical teachers to teach much better mathematics, including modelling, much more effectively.
The importance of mathematical modelling in the school curriculum is clear. It both demonstrates the widespread applicability of mathematics and enhances mathematical understanding through inquiry. It serves as a powerful cor-rective to those who view mathematics as a set of discrete facts and procedures to be taught and learned.
Yet, if an informed observer were to look in at, say, 100 randomly chosen classrooms in any country in the world, I believe they would be unlikely to see in any of them the stu-dents actively modelling situations from the real world (see e.g. Burkhardt with Pollak, 2006b). Why is this so? What might we do about it?
The difficulties of implementing widely-agreed changes seem to be the core barriers to the improvement of our students’ education in mathematics. While modelling, our focus here, is a particularly area for improvement, the dif-ficulty of achieving reform applies more widely. It seems to be a property of school systems and the way ‘this kind of organism’ functions. This still-unsolved problem is too big a subject for detailed discussion here (Burkhardt 2009,
2015) but, as a major barrier to improvement, it should not be overlooked. I shall confine my comments to the follow-ing key factors:
• Making systemic improvement happen is a design and development challenge.
• In many countries education is a ‘hot’ political issue with school system leadership making decisions of a technical kind that they would not contemplate in, for example, medicine. So we must recognize that politicians and other policy makers are part of the system and take their priorities into account if we are to develop models of change that actually improve teaching and learning. While the rhetoric at all levels emphasises teaching and learning, the day-to-day pressures on leaders at all levels are very different; these need to be understood and taken into account in the design and development initiatives.
• To take a key example, in countries with ‘high-stakes’ assessment the range of performance types that are
assessed ensures that these performances are developed in the classroom. (WYTIWYG) In particular, if mod-elling is to happen in most classroom is needs to be assessed in the tests. Yet changes to these tests are always a sensitive issue, with teachers understandably preferring the known to the unknown. The replacement of TIMSS by PISA, with its modelling emphasis, as the focus of politicians’ concerns has been important; but such tests are not ‘high stakes’ for individual teachers or students so have less leverage.
• Explicit design, development and formative research should look at different models of change. Policy makers tend to attempt comprehensive reform - a new national curriculum, for example - which either is largely cos-metic or, if ambitious, places new demands on teachers and other professionals that are not matched with the support needed for them to meet those demands. Thus does a “big bang” become a whimper. The most success-ful improvement models in our experience are based on gradual change - an approach taken for granted in medi-cine, of course.
• Educational research should be rebalanced to be more solution-focused (Burkhardt and Schoenfeld 2003; Bur-khardt 2013, 2015), commanding more public trust - and funding.
What might be done to make some progress with this temic challenge? Currently, working with 10 US school sys-tems in a “network of improvement communities”, we and our US partners have begun to design and develop tools11
(MathNIC 2017) to help system leadership tackle some of these issues. But this is just a beginning; I hope that progress on ways of tackling this kind of challenge may become a major focus of research and development in STEM educa-tion over the coming decade.
The 50 years’ work described here was made possible by the analytic expertise and creative design brilliance of the many designer-researchers that I have been fortunate enough to discover and to work with. Outstanding among them was Malcolm Swan, a lovely man with a touch of genius - this paper is dedicated to him.
Open Access This article is distributed under the terms of the Creative Commons Attribution 4.0 International License ( http://creativecom-mons.org/licenses/by/4.0/), which permits unrestricted use, distribu-tion, and reproduction in any medium, provided you give appropriate credit to the original author(s) and the source, provide a link to the Creative Commons license, and indicate if changes were made.
References
Black, P. J., & Wiliam, D. (1998). Assessment and classroom learning. Assessment in Education, 5, 7–74.
Brousseau, G. (1997). Theory of didactical situations in mathematics, 1970–1990. Dordrecht: Kluwer.
Burkhardt, H. (1981). The Real World and Mathematics. Glasgow: Blackie (revised Nottingham: Shell Centre Publications 2000). Burkhardt, H. (1988). The roles of theory in a “systems” approach
to mathematical education, article in honor of prof. Hans-Georg Steiner’s 60th birthday. ZDM, 5, 174–177.
Burkhardt, H. (2006a). From design research to large-scale impact: Engineering research in education. In J. Van den Akker, K. Grave-meijer, S. McKenney & N. Nieveen (Eds.), Educational design research. London: Routledge.
Burkhardt, H. (2009). On Strategic Design. Educational Designer, 1(3). Retrieved from: http://www.educationaldesigner.org/ed/volume1/ issue3/article9.
Burkhardt, H. (2013). Methodological issues in research and develop-ment. In Y. Li & J. N. Moschkovich (Eds.), Proficiency and beliefs in learning and teaching mathematics—Learning from Alan Sch-oenfeld and Günter Törner. Rotterdam: Sense Publishers. Burkhardt, H. (2014). Curriculum design and systemic change. In Y. Li
& G. Lappan (Eds.), Mathematics curriculum in school education. Heidelberg: Springer.
Burkhardt, H. (2015). Mathematics Education Research: a strategic view. In L. English & D. Kirshner (Eds.), Handbook of Interna-tional Research in Mathematics Education (3rd Edn). London: Taylor and Francis.
Burkhardt, H., & Pollak, H. O. (2006). Modelling in Mathematics Classrooms: reflections on past developments and the future. The International Journal on Mathematics Education. 38 (2), 178–195. Burkhardt, H., & Schoenfeld, A. H. (2003). Improving Educational
Research: towards a more useful, more influential and better funded enterprise. Educational Researcher, 32, 3–14.
Burkhardt, H., Swan, M., & Pead, D. (2008). How risky is life?, Bow-land Maths Case study. Blackburn: BowBow-land Trust/ Department for Education. http://www.bowlandmaths.org.uk.
Cockcroft Report (1982) Mathematics Counts, Report to the UK Gov-ernment of the committee of enquiry. London: HMSO. Evans, S., & Swan, M. (2014). Developing students’ strategies for
prob-lem solving: the role of pre-designed “Sample Student Work”. Educational Designer, 2(7). Retrieved from: http://www.educa-tionaldesigner.org/ed/volume2/issue7/article26.
Hatano, G., & Inagaki, K. (1986). Two courses of expertise. In H. W. Stevenson, H. Azuma & K. Hakuta (Eds.), Child development and education in Japan (pp. 262–272). New York: W H Freeman/ Times Books/ Henry Holt & Co.
Herman, J., Epstein, S., Leon, S., La Torre Matrundola, D., Reber, S., & Choi, K. (2014). Implementation and effects of LDC and MDC
in Kentucky districts (CRESST Policy Brief No. 13). Los Angeles: University of California, National Center for Research on Evalu-ation, Standards, and Student Testing (CRESST).
Inverness Research Associates (2014). MAP Project Portfolio. Down-loaded July 9, 2014, from http://inverness-research.org/mars_map/ index.html.
Janvier, C. (1978). The Interpretation of Complex Cartesian Graphs Representing Situations—Studies and Teaching Experiments. Ph.D. Thesis, University of Nottingham, Shell Centre for Math-ematical Education.
Mathematics Assessment Project (2014) Tools for teaching and assess-ing modellassess-ing. Downloadable from map.mathshell.org. MathNIC (2017) Tools for supporting system leadership in
improve-ment. Downloadable from mathnic.org.
Muller, E. R., Burkhardt, H., Pead, D., Ralph, B., Steen, L. A., Swan, M., & Turner, R. (2007). Applications and Modelling in Math-ematics Education. In W. Blum, P. Galbraith, H.-W. Henn & M. Niss (Eds.) (2007), Modelling and Applications in Mathematics Education. The 14th ICMI Study. New York: Springer.
Pead, D., & Swan, M. (2008). Reducing Road Accidents, Bowland Maths Case study. Blackburn: Bowland Trust/Department for Education. http://www.bowlandmaths.org.uk.
Phillips, R., Burkhardt, H., Fraser, R., Coupland, J., Pimm, D., & Ridg-way, J. (1988). Learning activities & classroom roles with and without the microcomputer. Journal of Mathematical Behavior, 6, 305–338.
Polya, G. (1945). How to solve it. Princeton: Princeton University Press.
Swan, M. (2006). Collaborative Learning in Mathematics: A Chal-lenge to our Beliefs and Practices. London: National Institute for Advanced and Continuing Education (NIACE) for the National Research and Development Centre for Adult Literacy and Numer-acy (NRDC).
Swan, M., Binns, B., Gillespie, J., & Burkhardt, H. With the Shell Centre team (1987–1989) Numeracy Through Problem Solving: five modules for teaching and assessment: Design a Board Game, Produce a Quiz Show, Plan a Trip, Be a Paper Engineer. Be a Shrewd Chooser, Harlow: Longman, downloadable from http:// www.mathshell.com.
Swan, M., & Burkhardt, H. (2014) Lesson design for formative assess-ment. Educational Designer, 2(7). http://www.educationalde-signer.org/ed/volume2/issue7/article24.
Swan, M., with Pitts, J., Fraser, R., & Burkhardt, H. and the Shell Centre team (1985), The Language of Functions and Graphs, Manchester: Joint Matriculation Board and Shell Centre for Math-ematical Education. http://www.mathshell.com.