Modification of perceived beer bitterness intensity, character and temporal profile by hop aroma extract
Olayide Oladokun1, Amparo Tarrega1, Sue James2, Trevor Cowley2, Frieda Dehrmann2, Katherine Smart2, David Cook1, Joanne Hort§1
1International Centre for Brewing Science, Bioenergy and Brewing Science Building, University of Nottingham, School of Biosciences, Division of Food Science, Sutton Bonington Campus, Loughborough, LE12 5RD, UK.
2SABMiller Plc, SABMiller House, Church Street West, Woking, Surrey, GU21 6HS.
§ Corresponding author
Highlights:
Aroma modified intensity, character and temporal profile of bitterness in beer. Hop aroma modified perceived bitterness by taste-aroma interactions.
Hop aroma evoked trigeminal sensations in the oral cavity.
Abstract
represent a significant step forward in terms of understanding bitterness flavour perception and the wider impact of hop compounds on sensory perception.
Keyword: Beer, bitterness intensity, bitterness character, taste-aroma interactions, trigeminal
1. Introduction
The flavour of food and beverages is multifaceted - involving taste, smell, texture, visual appearance, sound and trigeminal sensations; all of which are key for consumer satisfaction (Sørensen, Møller, Flint, Martens, & Raben, 2003). Of the four main brewing ingredients (water, malted barley, yeast and hops) hops (Humulus lupulus L.) re-main an essential flavour ingredient in beer (Schönberger &Kostelecky, 2011). Hop resins and essential oils, located within the lupulin glands of the female hop flowers are the sources of bitterness and aroma characters in beer, respectively (De Keukeleire, 2000; Van Opstaele, Goiris, De Rouck, Aerts, & De Cooman, 2012b). For bitterness, hop α-acids found within hop resins are thermally isomerised to bitter tasting iso-α-acids during the boiling stage of the brewing process (De Keukeleire, 2000). Bitterness units (BUs) are used as an analytical estimate of bitterness intensity by brewers, with 1 mg/L of iso-α-acids ap-proximately equalling 1 BU (Oliver & Colicchio, 2011). Generally the higher the level of iso-α-acids the higher the perceived bitterness inten-sity. Lager beers today are reported to typically range from 6–30 BU al-though much more bitter beers (>35 BU) are also widely available commercially (Schönberger & Kostelecky, 2011).
Opstaele et al., 2012b). The ‘spicy’ fraction of hop essential oils is currently the subject of intense re-search to identify the compounds responsible for this particular hop character in beer (Van Opstaele, Praet, Aerts, & De Cooman, 2013). Significantly, the use of the descriptive term ‘spicy’ to describe certain hop flavour impressions in beer may indicate the activation of trigeminal receptors in the oral and nasal cavities by aroma compounds present within this fraction of hop essential oil.
congruent odours and tastants (Dalton, Doolittle, Nagata, & Breslin, 2000; Murphy, Cain, & Bartoshuk, 1977; Pfeiffer et al., 2005). Other examples, based on detection threshold experiments (controlled for physiochemical interactions) between taste and odour compound pairs have revealed that subthreshold concentrations of odour compounds are more easily detected orthonasally when presented together with a sub-threshold concentration of a taste compound, than when it is presented alone (Dalton et al., 2000). The role of congruency on the observed level of taste-aroma interactions is inconsistent; some researchers only observed additivity in congruent taste-aroma pairs (Dalton et al., 2000; Labbe, Damevin, Vaccher, Morgenegg, & Martin, 2006), while others have reported additivity in taste-aroma pair irrespective of congruency (Delwiche & Heffelfinger, 2005). Although both taste and trigeminal sensations are sensed by distinct sensory systems, interactions exist between them which can also affect the perception of flavour in foods (Hewson, Hollowood, Chandra, & Hort, 2009). Trigeminal sensations involve the perception of texture, pungency and temperature within the oral cavity, nasal cavity or on the tongue (Cullen & Leopold, 1999). Oral irritation can reduce perceived intensity of taste and odour (Prescott, Allen, & Stephens, 1993), Lawless, Rozin, and Shenker (1985) also demonstrated the masking of both olfactory and gustatory sensations by oral capsaicin (Lawless et al., 1985).
2. Materials and methods
To investigate the impact of hop aroma compounds on bitterness perception, an unhopped base lager beer was brewed, to which pre-isomerised iso-α-acid and hop aroma extracts were added, to produce a two factorial design of samples at different BU levels and hop aroma concentrations. Various aspects of perceived sample bitterness were then assessed by a trained sensory panel using a combination of descriptive, discrimination and time-intensity techniques. Notably, to enable the effects of olfactory components of perception to be decoupled from oral (taste and mouthfeel) components, sensory tests were per-formed with and without nose clips.
2.1. Base beer production
The unhopped lager base beer used for this study was prepared at the 10 hL SABMiller research brewery at the Sutton Bonington campus of the University of Nottingham. The standard brew (5% ABV) was pre-pared from a grist composition of 70% pilsner malt and 30% dextrose adjunct. Mash-in temperature was 48 °C with addition of CaCl2 at a rate of 100 mg/L. This was followed by wort boiling for 60 min (5% evaporation) and a 15 min trub stand time. The wort was cooled and fermented with a standard SABMiller lager yeast for 10 days, and maturation followed for 4 days. The beers were packaged in 330 mL brown bottles and stored at 3 °C until their preparation for sensory appraisal. The original gravity and pH of the beer were 1.044 and 4.23, respectively.
2.2. Pre-isomerised iso-α-acid extract (Isohop)
2.3. Hop aroma extract product
A commercial pure hop aroma extract of the Hersbrucker hop variety (60% w/w, density = 1.020 g/mL) was used to add and vary the level of hop aroma compounds in the base beer, by addition at the following levels – L0, L1 and L2, corresponding to 0, 245, 490 mg/L of beer respectively. The hop aroma extract was supplied as a food grade solution, and was kindly provided by Botanix Ltd. (Kent, UK). These commercial products contain hop aroma compounds blended into propylene glycol for easy dissolution into beer. They are acquired by a combination of CO2 extraction and distillation, and do not contain hop acids or other bitter-tasting congeners known to contribute to beer bitterness.
2.4. Sample preparation
Beer samples were prepared from the base beer 48 h in advance of sensory evaluation. Preparation involved uncapping the bottled base beer, followed by the addition of the respective level of Isohop (for bitterness) and hop aroma extract (for aroma). For 13, 25 and 42 BU levels, Isohop was added at 13, 26 and 43 μL per 330 mL of beer. For the three hop aroma levels (L0, L1 and L2) hop aroma extract was added at 0, 132 and 264 μL per 330 mL of beer, respectively. Both solutions were accurately added to the beer using Rainin pipettes fitted with sterilised graduated pipette tips (Mettler Toledo, US). After addition, the bottles were recapped with sterilised bottle caps and gently mixed by inverting the bottle at a rate of one inversion per second for 10 s. The beers were immediately transferred to cold storage (3 °C) until sensory testing.
2.5. Sensory evaluation
2.5.1. Subjects
Experienced subjects (5 male, 2 female, mean age 45 years) from the University of Nottingham trained beer panel took part in each element of this study. They attended 12 sessions each lasting 2 h per session. A further 8 assessors (1 male, 7 female, mean age 40 years) also experienced in sensory testing of beer participated in the triangle test.
2.5.2. Sensory properties of the hop aroma extract
To determine the sensory character of the hop extract itself, a solution of the hop aroma extract was prepared at a concentration of 490 mg/L (L2) in water (Evian, Danone, Paris). The panel were instructed to cleanse their palate with mineral water (Evian, Danone, Paris) before smelling and tasting the hop aroma extract solution and describing its sensory properties.
To determine if the hop aroma extract possessed any taste or mouth-feel properties, a triangle test (ISO 4120, 2004) (ISO) comparing the hop extract solution sample with water was carried out whereby subjects wore nose clips to prevent any olfactory stimulation. Subjects were presented with three 10 mL solutions, according to a randomised partially balanced design and asked to pick out the different sample. They were also asked to indicate why they thought it was different. They were instructed to use a palate cleanser of mineral water (Evian, Danone, Paris) and crackers (Rakusen's, UK) prior to assessing each sample.
2.5.3. Perceived bitterness intensity and character
could be discriminated from each other from the ranking data, and a measure of the magnitude of the difference, if it exists, from the intensity rating scores. The selected bitterness character attributes, ‘round’, ‘harsh’ and ‘linger’, were previously determined by the panel in a related study (Oladokun, Tarrega, et al., 2016) and were defined as follows: ‘harsh’ - bitterness perceived to be ‘tingly’, ‘painful’, ‘irritating’ and ‘raspy’. ‘Round’ - a pleasant and smooth bitterness; ‘lingering’ - the persistence of the bitterness in the mouth.
Subjects were trained to use the rank-rating technique for each attribute. No training was needed for ranking per se other than the instruction to rank the samples presented from low to high intensity of the attribute in question. For rating, subjects were instructed that the scales presented were anchored from 0 to 10, with 0 representing low and 10 representing high intensity of an attribute. To familiarise the panel with the range of intensity represented by the scale, subjects were presented with beers of differing BU levels (13, 25 and 42 BU) and they discussed where they should be placed on the scale. To reinforce and evaluate panellist scale use, they were also provided with commercial beers assessed by High Performance Liquid Chromatography (Oladokun, Smart, & Cook, 2016) to be within a similar range of BU selected for this study. To re-familiarise the panel with the specific character attributes of ‘round’ and ‘harsh’ the subjects were given commercial beers, appraised to be of said bitterness characters in a previous study, as references (Oladokun, Tarrega, et al., 2016). The attribute ‘linger’ was assessed as the intensity of bitterness perceived after 10 s upon swallowing the sample. The panellists were trained to use a stopwatch to assess this.
2.5.4. Temporal profile of bitterness
scale (for rating intensities) and the TI data collection set-up. The panel had considerable previous experience with the TI technique. Beer samples at 13, 25 and 42 BU (with no hop aroma extract added) were re-introduced to the panellists as standards to practice intensity ratings on the scale.
2.5.5. Sample evaluation
In all cases samples were served at 4 ± 2 °C. Subjects cleansed their palates with water (Evian, Danone, France) and crackers (Rakusen's, UK) before evaluating each sample. Appropriate breaks (3 min between attribute) were built into the design of the evaluation sessions to ensure that bitterness carry-over and palate saturation was kept to a minimum. All data were collected with Compusense Cloud (Compusense, Canada). For rank-rating evaluations subjects were presented with sets of 3 samples representing different levels of hop aroma extract addition (L0, L1, and L2) at a BU level, although this relationship between the three samples was not disclosed to the subjects to avoid bias. Subjects were first asked to rank the samples for bitterness intensity. They were then asked to retaste the samples and rate them on the intensity scale. Subjects followed the same protocol to assess the bitterness character attributes ‘round’, ‘harsh’ and ‘linger’, at each of the 3 BU levels. Three replicate assessments were carried out at each BU level, and the experimental design was balanced to moderate inter-session variation.
The above evaluations were then repeated with the use of nose clips to isolate the impact of the oral stimulation by the hop aroma extract from its olfactory component for the low and high BU samples only. Subjects were only allowed to remove the nose clips during the break period (between attribute evaluations). A sample volume of 30 mL was used for all rank-rating evaluations.
performed with and without nose clips over three replicate assessment. 10 mL samples were used for all TI evaluations which lasted for a time period of 60 s. The following TI parameters were extracted from the TI curves: maximum intensity (IMax), time to maximum intensity (TMax), area under the curve (AUC) and increasing angle (IAngle) (Duizer, Bloom, & Findlay, 1997), using an Excel Macro provided by Compusense.
2.6. Statistical analysis
Statistical analyses were carried out with XLSTAT version 2015.6 and STATGRAPHICS Centurion XVI. I statistical software, significance was derived at α = 0.05. Rank data was analysed using Friedman's test followed by Nemenyi's pairwise comparison test. Attribute intensity rating scores were analysed using a three-factor (BU level, Hop aroma level and subjects) analysis of variance (ANOVA) to identify if differences existed between samples and if interactions between BU and Hop aroma levels were evident. Where significance was established, a Tukey's HSD post hoc test was used to identify which specific samples were discriminated from each other. STATGRAPHICS Centurion XVII was used to generate interaction plots between hop aroma and BU levels. The impact of hop aroma on TI parameters was analysed using a two factor (sample, subject) ANOVA and subsequent Tukey's post hoc tests.
3. Results
3.1. Sensory properties of hop aroma extract
4 of 15 people correctly identified the odd sample implying no significant difference was perceived (p = 0.74). However panellists who discriminated correctly between the hop aroma and water solution described it as ‘peppery’ and ‘soapy’, indicating the presence of trigeminal-type sensations for these panellists.
3.2. Effect of hop aroma addition on perceived bitterness intensity and character
The mean sample rank scores for bitterness intensity and bitterness character attributes, across the three BU levels, are presented in Table 2. The mean sample rating scores for bitterness intensity and bitterness character attributes, across the three BU levels, are presented in Table 3. In addition Figs. 1 and 2 depict the mean bitterness profile of the samples at each BU level, with and without nose clips respectively.
3.2.1. Overall bitterness intensity
According to the Friedman's test the addition of hop aroma significantly impacted on perception of overall bitterness intensity. In the absence of nose clips, at low and medium BU levels, samples with hop aroma addition at L2 were ranked to be significantly more bitter than L0. At high BU level, samples with hop aroma addition at L1 were ranked to be significantly more bitter than L0.
L0 and L1 at low BU, while at medium bitterness, samples L1 and L2 were rated to be significantly more bitter than L0. No significant difference in bitterness intensity ratings were observed at the high BU level but sample L1 was rated highest (6.41) for this attribute.
When nose clips were used at the low and high BU levels, there were no significant differences observed between samples based on rank or rating scores for bitterness intensity at low BU. However, at high BU, sample L2 was ranked as significantly more bitter than L0 and L1 (p b 0.05). This effect was not significant in the rating data indicating that this perceived increase in bitterness intensity was likely to be subtle, but nevertheless perceptible. There was no significant interaction between BU and hop aroma level for bitterness intensity with nose clips on (p = 0.96).
3.2.2. Bitterness character
The Friedman's test also revealed the effects of hop aroma addition on harsh, round and lingering bitterness characters (Tables 2 and 3). In the absence of nose clips both Friedman and ANOVA analyses revealed no significant difference in the scores of ‘harshness’ between the samples at low and high BU levels. However, at medium BU, both samples L1 and L2 were ranked and rated to be significantly harsher in bitterness character relative to L0. The differential effect at the medium BU level was highlighted as a significant BU*Hop aroma interaction in the ANOVA (p = 0.05) and is evident in the interaction plot shown in Fig. 3.
added (L0) were generally ranked and rated to have a rounder bitterness character relative to those with hop aroma added. This observation was significant at high BU level (p < 0.05) as can be seen in Fig. 1. The interaction between BU level and hop aroma levels in the rating data is apparent in Fig. 3, where unlike at medium and high BU levels the addition of hop aroma at L1 resulted in a much rounder bitterness rating at low BU level.
The mean rank sample scores revealed that the attribute ‘lingering’ was only affected by hop aroma addition at high BU levels, sample L2 was ranked to have a more lingering bitterness compared to L0 and L1. This was not picked up in the rating data, again indicating that the difference was subtle, but nevertheless perceptible.
With nose clips on at low BU, sample L2 was ranked as significantly harsher but no other differences in bitterness characters were evident (Fig. 2). At high BU, sample L2 was again ranked as significantly harsher than L0. By contrast L0 was ranked as significantly rounder in bitterness character than L1 and L2 (Table 2). When rating with nose clips on, very few differences in bitterness character were observed indicating that the differences in rankings above were fairly subtle (Table 3). No significant interactions between BU and Hop aroma level were evident. The only significant difference observed confirmed that, at low BU, L2 hop aroma addition resulted in a harsher bitterness character increasing from a score of 2.6 and 2.5 for L0 and L1 respectively, to 3.8 at L2.
3.3. Time-intensity results
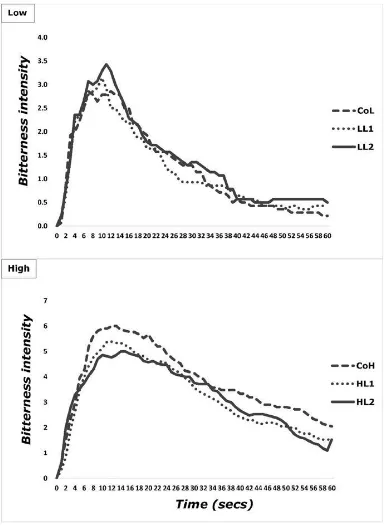
intensity perceived, was greater for L2, while TMax, the time it took to reach maximum intensity was shorter compared to L0. AUC, which represents an overall integration of bitterness intensity, was greater for L2 than L0. At high BU, IAngle, the parameter denoting the rate of onset of bitterness sensation was the only TI parameter dis-criminating the samples. This angle was smaller for L2, denoting a faster rate of bitterness onset. When nose clips were used no significant differences were revealed for any of the parameters, indicating no significant difference between the samples in terms of their temporal profiles.
4. Discussion
4.1. Taste and mouthfeel qualities of hop aroma extract solution
The descriptive terms used to characterise the hop aroma extract solution consisted mainly of terms derived as a result of orthonasal aroma perception, but the use of attributes such as ‘tingly’, ‘spicy’ and ‘peppery’ also suggests some element of trigeminal or tactile sensations being elicited by hop aroma compounds present within the hop aroma ex-tract. The results also suggest that at the levels used in this study, the hop aroma extract of the selected variety was not perceived as bitter it-self so any change to bitterness measures must be due to some form of perceptual interactions. Furthermore, these findings support previous reports of a ‘spicy’ character or impression commonly associated with this particular hop variety in the literature (Goiris et al., 2002; Van Opstaele et al., 2012a, 2012b), and further show that hop aroma extracts can elicit mouthfeel properties of a trigeminal nature e.g. peppery that are not associated with olfactory stimulation, as these was reported even when nose clips were worn.
increased bitterness intensity at this level cannot be due to olfaction. Taste–trigeminal interactions have been re-ported previously in beverages (Hewson et al., 2009).
4.3. Impact of hop aroma on perceived bitterness character
com-pounds can modulate harshness by reducing perceived trigeminal sensations. These observations, in combination with the greater perceived bitterness intensity in L2 samples at high BU (even in the absence of olfaction), further support the stimulation of trigeminal receptors by hop aroma extracts in the oral cavity. To further confirm this, the panellists were invited to an additional session to discuss what they perceived and how they evaluated the samples when nose clips where used. Panellists revealed that at low BU levels, they found it difficult to determine the most bitter sample of the three presented when nose clips were worn. This supports the importance of the olfactory component on bitterness perception at low BU. Furthermore, they described high BU samples as having a ‘drying sensation on the tongue as well as the back of the throat’ which contributed to their assessment of bitterness intensity and character at this BU level. Tactile and trigeminal sensations such as ‘astringency’ and ‘drying’, as well as information regarding nociception, irritation and consistency all influence the overall perception of flavour, they are sensed during food consumption and processed by the trigeminal system (Auvray & Spence, 2008; Delwiche, 2004).
form of hop aroma ex-tracts, with the effect on bitterness intensity being more prominent in beers of low and medium bitterness concentrations (BUs). While the levels of acidity (pH), sweetness or alcohol, known to affect bitterness, may also play a role these variables were kept constant in this experiment.
4.4. The impact of hop aroma on the temporal profile of bitterness
The dynamic nature of flavour perception means that its experience during food and drink consumption changes from time to time, in particular, the perception of bitterness in beer has been shown to exhibit a time course (Fritsch & Shellhammer, 2009; Pangborn, Lewis, & Yamashita, 1983). Here, although somewhat limited these results indicate that the temporal profile of bitterness is affected by retronasal perception of hop aroma. At low BU, a significantly higher IMax for sample L2 relative to L0 meant that the former was perceived to be more bitter than the latter not just overall (as shown by rank-rating results) but that this is constantly the case over time as shown in the TI curves. The observed shorter TMax for L2 relative to L0 suggests that in the presence of hop aroma maximum bitterness was also reached more quickly. The significantly greater AUC parameter also concurs with the overall rank and rating data that beers with added hop aroma had a significantly greater overall impression of bitterness in comparison to L0, despite the fact it was clear that the hop aroma extract itself is not bitter. The significant difference in only the IAngle at high BU suggests minimal impact of olfaction on bitterness time course at high bitterness concentrations.
selected panellists showed that they perceived sample L2 to be significantly more ‘bitter’ than L0 at low BU. These results, albeit with a limited number of panellists, suggests further research is war-ranted to investigate the impact of different hop aroma compounds on the temporal profile of bitterness and more importantly how this relates to consumer acceptance.
5. Conclusions
Acknowledgement
References
Auvray, M., & Spence, C. (2008). The multisensory perception of flavor. Consciousness andCognition, 17(3), 1016–1031.
Cullen, M. M., & Leopold, D. A. (1999). Disorders of smell and taste. Medical Clinics of NorthAmerica, 83(1), 57–74.
Dalton, P., Doolittle, N., Nagata, H., & Breslin, P. (2000). The merging of the senses: Inte-gration of subthreshold taste and smell. Nature Neuroscience, 3(5), 431–432. De Keukeleire, D. (2000). Fundamentals of beer and hop chemistry. Quimica Nova,
23(1),108–112.
Delwiche, & Heffelfinger, A. (2005). Cross-modal additivity of taste and smell. Journal of Sensory Studies, 20(6), 512–525.
Delwiche, J. (2004). The impact of perceptual interactions on perceived flavor. Food Quality and Preference, 15(2), 137–146.
Duizer, L., Bloom, K., & Findlay, C. (1997). Dual-attribute time-intensity sensory evalua-tion: A new method for temporal measurement of sensory perceptions. Food Quality and Preference, 8(4), 261–269.
Eyres, G., & Dufour, J. (2009). Hop essential oil: Analysis, chemical composition and odorcharacteristics. Beer in Health and Disease Prevention, 7, 239–254.
Eyres, G., Marriott, P., & Dufour, J. (2007). Comparison of odor-active compounds in the spicy fraction of hop (Humulus lupulus L.) essential oil from four different varieties. Journal of Agricultural and Food Chemistry, 55(15), 6252–6261.
Eyres, G., Marriott, P., Leus, M., & Lysaght, B. (2015). Characterisation of impact aroma compounds in hop essential oils. Weurman flavour research symposium (15 September 2015 to 19 September 2015).
Fritsch, A., & Shellhammer, T. H. (2009). The bitter qualities of reduced and nonreduced iso-α-acids. Journal of the American Society of Brewing Chemists, 67(1), 8–13.
Gawel, R., Oberholster, A., & Francis, I. L. (2000). A mouth-feel wheel: Terminology for communicating the mouth-feel characteristics of red wine. Australian Journal of Grape and Wine Research, 6(3), 203–207.
Goiris, K., Ridder, M., Rouck, G., Boeykens, A., Opstaele, F., Aerts, G., ... Keukeleire, D. (2002). The oxygenated sesquiterpenoid fraction of hops in relation to the spicy hop character of beer. Journal of the Institute of Brewing, 108(1), 86–93.
Hewson, L., Hollowood, T., Chandra, S., & Hort, J. (2009). Gustatory, olfactory and trigem-inal interactions in a model carbonated beverage. Chemosensory Perception, 2(2), 94–107.
ISO, B. 4120 (2004). Sensory analysis-methodology-triangle test (2012). http://www.iso.org/iso/catalogue_detail?csnumber=33495
Kim, K. O., & O'Mahony, M. (1998). A new approach to category scales of intensity I: Tra-ditional versus rank-rating. Journal of Sensory Studies, 13(3), 241–249.
Labbe, D., Damevin, L., Vaccher, C., Morgenegg, C., & Martin, N. (2006). Modulation of per-ceived taste by olfaction in familiar and unfamiliar beverages. Food Quality and Preference, 17(7), 582–589.
Lawless, H., Rozin, P., & Shenker, J. (1985). Effects of oral capsaicin on gustatory, olfactory and irritant sensations and flavor identification in humans who regularly or rarely consume chili pepper. Chemical Senses, 10(4), 579–589.
Lyman, B. J., & Green, B. G. (1990). Oral astringency: Effects of repeated exposure and in-teractions with sweeteners. Chemical Senses, 15(2), 151–164.
Meilgaard, M. (1960). Hop analysis, cohumulone factor and the bitterness of beer: Reviewand critical evaluation. Journal of the Institute of Brewing, 66(1), 35–50. Murphy, C., Cain, W. S., & Bartoshuk, L. M. (1977). Mutual action of taste and olfaction.
Sensory Processes, 1(3), 204–211.
Oladokun, O., Smart, K., & Cook, D. (2016b). An improved HPLC method for single-run analysis of the spectrum of hop bittering compounds usually encountered in beers. Journal of the Institute of Brewing, 122(1), 11–20.
Oladokun, O., Tarrega, A., James, S., Smart, K., Hort, J., & Cook, D. (2016a). The impact of hop bitter acid and polyphenol profiles on the perceived bitterness of beer. Food Chemistry, 205, 212–220.
Oliver, G., & Colicchio, T. (2011). The Oxford companion to beer. New York: Oxford Univer-sity Press, 490.
Pangborn, R., Lewis, M., & Yamashita, J. (1983). Comparison of time-intensity with catego-ry scaling of bitterness of iso-α-acids in model systems and in beer. Journal of the Institute of Brewing, 89(5), 349–355.
Peacock, V. E., Deinzer, M. L., Likens, S. T., Nickerson, G. B., & McGill, L. A. (1981). Floral hop aroma in beer. Journal of Agricultural and Food Chemistry, 29(6), 1265– 1269.
Pfeiffer, J. C., Hollowood, T. A., Hort, J., & Taylor, A. J. (2005). Temporal synchrony and in-tegration of sub-threshold taste and smell signals. Chemical Senses, 30(7), 539– 545.
Prescott, J., Allen, S., & Stephens, L. (1993). Interactions between oral chemical irritation,taste and temperature. Chemical Senses, 18(4), 389–404.
Schönberger, C., & Kostelecky, T. (2011). 125th Anniversary Review: The role of hops in brewing. Journal of the Institute of Brewing, 117(3), 259–267.
Small, D. M., & Prescott, J. (2005). Odor/taste integration and the perception offlavor. Experimental Brain Research, 166(3–4), 345–357.
Sørensen, L., Møller, P., Flint, A., Martens, M., & Raben, A. (2003). Effect of sensory percep-tion of foods on appetite and food intake: A review of studies on humans. International Journal of Obesity, 27(10), 1152–1166.
Steele, M. (2013). IPA: Brewing techniques, recipes and the evolution of India pale ale. UnitedStates of America: Brewers Publications.
Tressl, R., Engel, K. H., Kossa, M., & Koeppler, H. (1983). Characterization of tricyclic ses-quiterpenes in hop (Humulus lupulus var. Hersbrucker Spaet). Journal of Agricultural and Food Chemistry, 31(4), 892–897.
Van Opstaele, F., Goiris, K., De Rouck, G., Aerts, G., & De Cooman, L. (2012a). Production of novel varietal hop aromas by supercritical fluid extraction of hop pellets—Part 2: Preparation of single variety floral, citrus, and spicy hop oil essences by density pro-grammed supercritical fluid extraction. The Journal of Supercritical Fluids, 71, 147–161.
Van Opstaele, F., Goiris, K., De Rouck, G., Aerts, G., & De Cooman, L. (2012b). Production ofnovel varietal hop aromas by supercritical fluid extraction of hop pellets. Part 1: Prep-aration of single variety total hop essential oils and polar hop essences. Cerevisia, 37(4), 97–108.
Van Opstaele, F., Praet, T., Aerts, G., & De Cooman, L. (2013). Characterization of novel sin-gle-variety oxygenated sesquiterpenoid hop oil fractions via headspace solid-phase microextraction and gas chromatography–mass spectrometry/olfactometry. Journal of Agricultural and Food Chemistry, 61(44), 10555–10564.
Table 1
Odour and mouthfeel properties of hop aroma extract of Hersbrucker Spät. Odour descriptors Taste/Mouthfeel descriptors
Herbal Gingery
Lime Mouth coating
Orange peel Spicy
Piney/nutty Tingly
Hoppy Peppery
Table 2
Sum of ranks for beer samples and results of Nemenyi's multiple pairwise comparison test by BU level, with and without nose clips (L0, L1 and L2 correspond to 0, 245 and 490 mg/L addition of hop aroma extract).
Nose
clip OFF
Nose clip ON
Hop aroma extract level
BU Level
L0
L1
L2
L0
L1
L2
Low (13BU)
Bitterness intensity: 30a 35ab 52b 41a 40a 45a
Harsh: 36a 38a 46a 38ab 35a 53b
Round: 34a 50b 36a 44a 43a 39a
Lingering: 41a 38a 41a 39a 41a 46a
Medium (25BU)
Bitterness intensity: 28a 42b 44b - - -
Harsh: 30a 44b 40ab - - -
Round: 44b 38a 32a - - -
Lingering: 36a 37a 41a - - -
High (42BU)
Bitterness intensity: 32a 51b 43ab 33a 44ab 49b
Harsh: 41a 40a 45a 33a 44ab 49b
Round: 51b 39a 36a 49b 43ab 34a
Lingering: 34a 43ab 49b 37a 46a 43a
Table 3
Mean intensity rating scores for beer samples and results of Tukey post hoc test at each BU level for each attribute, with and without nose clips (L0, L1 and L2 correspond to 0, 245 and 490 mg/L addition of hop aroma extract).
Nose
clip OFF
Nose clip ON
Hop aroma extract level
Bitterness
L0
L1
L2
L0
L1
L2
Low (13BU)
Bitterness intensity: 3.48a 3.83a 5.707b 3.13a 3.53a 3.87a
Harsh: 3.38a 3.44a 3.99a 2.64ab 2.47a 3.79b
Round: 5.26ab 6.81b 4.90a 4.79a 5.21a 4.87a
Lingering: 3.85a 3.82a 4.09a 2.89a 2.96a 2.83a
Medium (25BU)
Bitterness intensity: 4.54a 6.35b 6.76b - - -
Harsh: 3.43a 6.57b 6.00b - - -
Round: 5.03a 4.09a 3.06a - - -
Lingering: 4.44a 5.30a 5.92a - - -
High (42BU)
Bitterness intensity: 4.79a 6.41a 5.99a 5.64a 6.34a 6.63a
Harsh: 4.46a 4.55a 5.60a 4.94a 5.36a 5.71a
Round: 5.93b 3.83a 3.68a 3.97a 3.92a 3.28a
Lingering: 4.53a 5.51a 5.71a 4.52a 5.51a 5.74a
Fig. 1. Spider plots of mean bitterness intensity and bitter character based on intensity ratings. Low: (13 BU) beer, Medium: (25 BU) beer and High: (42 BU) beer. L0, L1 and L2 at each BU level corresponds to hop aroma extract addition levels of 0, 245 and 490 mg/L. Significance denoted at *5% and **1% level.
Fig. 2. Spider plots of mean bitterness intensity and bitter character based on intensity ratings with nose clip on. Low: (13 BU) beer and High: (42 BU) beer. L0, L1 and L2 at each BU level corresponds to hop aroma extract addition levels of 0, 245 and 490 mg/L. Significance denoted at *5% and **1% level.
Fig. 4. Average time-intensity curves. Low: (13 BU) beer and High: (42 BU) beer. CoL and CoH, LL1 and HL1, LL2 and HL2 correspond to hop aroma extract addition levels of 0, 245 and 490 mg/L respectively. Significance at 5% level. (n = 21 based on 7 panellists × 3 replicate measurements).
0.0 0.5 1.0 1.5 2.0 2.5 3.0 3.5 4.0
0 2 4 6 8 10 12 14 16 18 20 22 24 26 28 30 32 34 36 38 40 42 44 46 48 50 52 54 56 58 60
Bit
terness
int
ens
it
y
CoL LL1 LL2 Low 0 1 2 3 4 5 6 7 80 2 4 6 8 10 12 14 16 18 20 22 24 26 28 30 32 34 36 38 40 42 44 46 48 50 52 54 56 58 60