Physical activity pre- and post-dementia: English
Longitudinal Study of Ageing
Short title: Physical activity pre- and post-dementia (ELSA Cohort)
Mira Soni1; Martin Orrell2; Stephan Bandelow1; Andrew Steptoe3; Snorri
Rafnsson3; Eleonora d’Orsi4; Andre Xavier5; & Eef Hogervorst1*
1School of Sport Exercise and Health Sciences, Loughborough University, UK (MS:
[email protected]; SB: [email protected]; EH: [email protected]).
2 Institute of Mental Health, University of Nottingham, UK (MO: [email protected]). 3 Department of Epidemiology and Public Health, University College London, UK (AS:
[email protected]; SR: [email protected]).
4 Department of Public Health, Federal University of Santa Catarina, Florianópolis, Brazil
(ED: [email protected]).
5 Health Academic Unit, Universidade do Sul de Santa Catarina, Florianopolis,
Florianópolis, Brazil (AX:[email protected]).
Corresponding Author:
Eef Hogervorst
School of Sport Exercise and Health Sciences, National Centre for Sports and Exercise
Medicine, Loughborough University, Loughborough, Leicestershire, LE11 3TU, UK
Email: [email protected]
Telephone: +44(0)1509 223020
ABSTRACT
Background: To inform public health interventions, further investigation is needed to
identify: (1) frequency/intensity of everyday physical activity (PA) needed to reduce
dementia risk; (2) whether post-diagnosis reduction in PA is associated with cognitive
outcomes. Methods: Data from 11,391 men and women (aged ≥50) were obtained in
the English Longitudinal Study of Ageing. Assessments were at baseline (2002-2003)
and biannual follow-ups (2004-2013). Results: Older adults who carried out moderate to
vigorous activity at least once per week had a 34%-50% lower risk for cognitive decline
and dementia over an 8-10 year follow-up period. From pre- to post-diagnosis, those
that decreased PA levels had a larger decrease in immediate recall score, compared to
those that maintained or increased PA levels (adjusted for changes in physical function).
Conclusion: These findings provide a guideline for everyday PA levels needed to
reduce risk for dementia. Reduction in PA after diagnosis was also associated with
accelerated cognitive decline.
KEYWORDS
Alzheimer’s Disease, Other Dementias, Epidemiology (Dementia), Physical Activity,
Cognitive Functioning
ABBREVIATIONS: Brain Derived Neurotrophic Factor (BDNF), Confidence Intervals (CI), Delta Change
(∆),Epidemiological Studies Depression Scale (CES-D), English Longitudinal Study of Ageing (ELSA),
European Prospective Investigation into Cancer (EPIC), Hazards Ratio (HR), Health Survey for England
(HSE), Informant Questionnaire on Cognitive Decline in the Elderly (IQCODE), Metabolic Equivalent
1. INTRODUCTION
Dementia is neurodegenerative condition characterised by progressive and marked
decline in memory and other cognitions. Based on UK data in 2013, dementia
prevalence was 1.3% in the total population and 7.1% in those over the age of 65 [1].
Without significant public health intervention, this was projected to increase by 40% over
the next 12 years, due to population ageing. Comparatively, current worldwide
prevalence is estimated at 5.2% in those above age 60 and expected to double within
20 years, making dementia one of the leading causes of disability and dependence
globally [2]. Present global economic cost of dementia including medical care (20%),
social care (40%) and unpaid care e.g. family/friends (40%) is estimated at US$818
billion [2]. Understanding modifiable lifestyle factors that could prevent or delay disease
onset will therefore have implications for these economic costs and quality of life for
those at risk for dementia.
Observational studies and randomized controlled trials provide evidence for the benefits
of regular physical activity (PA) as a behavioral approach to reduce dementia risk [3–5].
PA refers to any bodily movement produced by the skeletal muscles that requires
energy expenditure [6]. This can include everyday activities (e.g. walking, gardening,
recreational sports) or targeted exercise training (e.g. gym workout). Several
neurophysiological mechanisms may elucidate the benefits of physical activity on
cognitive health. These include increased cerebral blood flow [7], reduced age-related
loss of brain tissue [8] and increased levels of neurotrophins (particularly brain-derived
neurotrophic factor; BDNF) associated with synaptic plasticity and neuronal survival [9].
cardiovascular disease, stroke, diabetes mellitus and depression, which are also risk
factors for dementia [10]. However, limitations to interpret studies assessing the
association between PA and dementia have been consistently noted. A number of
studies do not adjust for relevant confounders of PA (e.g. alcohol consumption, smoking
status, depression and cardiovascular factors [4,10–12], potentially exaggerating effect
size and reducing reliability. Retrospective self-report measures often do not report
details of frequency and intensity of PA, limiting their clinical applicability[4,11]. Studies
offering a follow-up of at least 10 years are few, leading to issues with reverse causality,
where undiagnosed symptoms of dementia may lead to less physical activity rather than
the opposite [4]. Finally, the association between pre- to post-diagnosis changes in PA
and cognition has not been previously investigated, but would be valuable to inform
public health interventions.
The present study investigated the association between PA and dementia risk over a
10-year follow-up in the English Longitudinal Study of Ageing (ELSA).
2. METHOD
2.1. Participants
ELSA is an ongoing epidemiological study of men and women (≥50 years of age). The
sample was drawn from those who participated in the Health Survey for England (HSE)
between 1998-2000. The primary form data collection in ELSA is a computer assisted
personal interview (CAPI) carried out at the persons home or residence. Details of data
individuals (46% male, 54% female) who began at baseline (wave 1; 2002-2003) and
had biannual follow up-interviews (waves 2-6; 2004-2013). Participants with dementia in
wave 1 were excluded; therefore incident cases of dementia were recorded over waves
2-6. Participants were also excluded if they were diagnosed with Parkinson’s disease or
psychiatric ocnditions (e.g. hallucinations, schizophrenia, psychosis), which could
significantly affect physical or cognitive function. The final sample included 11,289
participants. All participants gave informed consent before taking part and the London
Multi-Centre Research Ethics Committee approved this study.
2.2. Physical Activity (PA) Definition
Self-reported PA data were collected using questionnaires administered at each wave.
Respondents were given examples of PA at mild intensity (e.g. laundry, home repairs),
moderate intensity (e.g. cleaning the car, walking at a moderate pace) and vigorous
intensity (e.g. digging with a spade, cycling, aerobics). They were then asked to indicate
their frequency of participation in mild, moderate and vigorous PA (hardly ever, one to
three times per month, once per week or more than once per week). Items on the ELSA
physical activity questionnaire were modified from the Whitehall II Health questionnaire
[14]. The chosen examples of PA at different intensities were selected as they were
most commonly reported in two UK-based population studies, carried out in a similar
age group, namely the Ely Diabetes study and the UK sample from the European
Prospective Investigation into Cancer (EPIC) cohort [15]. Different PA intensities were
categorised based the activity’s metabolic equivalent (MET) score [16]. MET scores
between 2 to 3.5 corresponded to mild PA, scores 3.5 to 6 defined moderate PA and a
Self-reported data were recorded at each wave (where available). For the purpose of
this study we further categorized PA into four groups coded with numerical values: (1)
PA less than once per week (<1x/wk); (2) mild PA once per week (1x/wk); (3) moderate
or vigorous PA once per week (1x/wk); (4) moderate or vigorous PA twice per week or
more (>1x/wk). For those without a dementia diagnosis, “average PA” was defined as
the mean level of PA across waves 1-6. For those with incident dementia, average PA
was defined as the mean level of PA using only the waves prior to diagnosis.
2.3. Dementia Assessment
Dementia was defined as a physician diagnosis of dementia or Alzheimer’s disease
reported by the participant in the CAPI. If the individual was unable to take part in the
CAPI for any reason, a family member or long-term carer was able to complete the
Informant Questionnaire on Cognitive Decline in the Elderly (IQCODE) [17]. The
IQCODE consists of 26 questions, which ask the informant to rate how their friend or
relative is in situations now compared to 10 years ago (e.g. “recognising faces of family
and friends”, “remembering things that have happened recently”). Scores range on a
5-point scale from “1=much improved” to “5=much worse”. Scores for each question are
summed and divided by 26 to give a final score between 1-5. Scores above 3.5 were a
cut-off for identifying dementia cases. The IQCODE has been shown to be a valid
predictor of dementia [18] performing as well as other commonly used screening
methods (e.g. Mini-Mental State Examination (MMSE) [19]).
Several baseline factors were accounted for as possible covariates that could affect
cognition, physical activity or health status [10,20]. Demographic factors included age
(years) and gender (male/female). Socioeconomic variables were derived for education
(degree level/below degree/no qualification) and wealth (3rd quintile or less [least
wealthy]//4th quintile or above [most wealthy]). Wealth was calculated as net of debt and
included the value of housing (excluding mortgage), financial assets (e.g. savings,
business assets) and physical wealth (e.g. artwork, jewelry). Presences of several
self-reported doctor diagnosed cardiovascular disease factors were accounted for, including
high blood pressure, diabetes, stroke and heart attack (binary yes/no). In sensitivity
analysis, binary variables for presence of any self-reported doctor-diagnosed heart
condition (including the latter cardiovascular factors plus any other reported) or chronic
disease (lung disease, asthma, osteoporosis, cancer, neurological or psychiatric
problems) were included. Depressive symptoms were assessed using an eight-tem
Epidemiological Studies Depression Scale (CES-D) validated for use in older adults [21].
Here, a CES-D score of 4 or higher identified elevated symptoms of major depression.
Other health related covariates included smoking status (non-smoker/previous
smoker/current smoker) and frequency of alcohol consumption (more than once daily/
daily/ one to two times per week/ less than once per week). Validated
neuropsychological measures of cognition [20] included immediate recall (of 10 words in
a list) and verbal fluency (naming category items in 1 minute i.e. animals). Finally,
physical function was measured using gait speed, defined as the time in seconds taken
2.5. Statistical Analysis
Descriptive analyses were performed on data stratified by incidence of dementia.
Chi-squared statistics were computed to assess baseline group differences for categorical
data and independent samples t-statistics were used for continuous data.
The association between PA and dementia risk was estimated using Cox proportional
hazards regression, calculating multivariate-adjusted hazards ratios (HR’s) with 95%
confidence intervals (CI’s). The timescale variable was the number of completed
assessment waves and the censor variable was whether a dementia diagnosis was
reported (yes/no). Separate models were used to predict dementia risk from (i) baseline
PA and (ii) average PA levels across the follow-up period. Covariates were adjusted in a
step-wise approach. In the first step, models contained variables for age, gender,
education, wealth, baseline cognitive function and physical function. The second step
adjusted for additional variables including alcohol consumption, smoking status,
depression, mood problems, cardiovascular factors and chronic disease. In sensitivity
analysis exclusion criteria were manipulated to assess the possibility of reverse
causality. Here, participants were excluded if they had a dementia diagnosis in waves
1-2 (i.e. up to two years since baseline). This examined robustness of findings and
reduced the likelihood that undiagnosed prodromal symptoms of dementia contributed to
decreased PA, rather than the opposite. Imputation methods were not performed on
missing data.
Subgroup analysis was carried out in those with dementia, who carried out an average
was used to investigate whether reduction in PA after diagnosis were associated with
cognitive outcomes (immediate recall and verbal fluency). Here, delta change (∆) scores
were calculated as post-diagnosis minus pre-diagnosis score. Age, gender, education,
and changes in physical function (pre- to post-diagnosis) were also controlled for.
In sensitivity analysis exclusion criteria were manipulated to assess the possibility of
reverse causality. In the first analysis, participants were excluded if they had a dementia
diagnosis in waves 1-2 (i.e. up to 2 years since baseline). This examined robustness of
findings and reduced the likelihood that undiagnosed prodromal symptoms of dementia
contributed to decreased PA, rather than the opposite. In the second analysis,
participants were excluded if they had any type of chronic disease at baseline that could
affect PA levels.
In all analyses, two-sided p values are reported and values ≤0.05 were considered
statistically significant. Analyses were performed using IBM SPSS Statistics (Version
22).
3. RESULTS
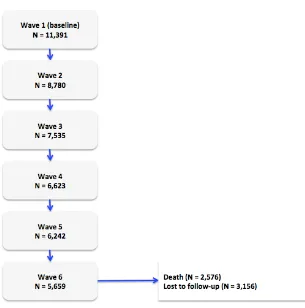
Of the core-interviewed participants (N=11,391), 2,576 participants died and 3,156 were
lost over the follow-up period (e.g. moved out of UK, became institutionalised and were
unproductive, were unable/unwilling to continue with study) (see Figure 1).
Compared to those who left the study, participants with data available in final wave
educational level and score higher on measures of cognitive and physical function at
baseline. They also consumed more alcohol, but were less likely to smoke or have
reported a psychiatric condition, cardiovascular condition or chronic disease at baseline.
3.1. Baseline PA and incident dementia
For the included sample (N=11,289), the cohort was divided into those that received a
dementia diagnosis (across waves 2-6) versus those that did not. Approximately 3.5% of
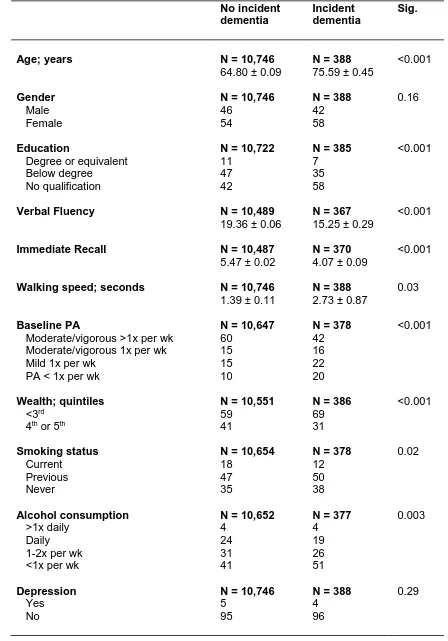
the sample received a dementia diagnosis. Baseline characteristics for the sample are
outlined in Table 1.
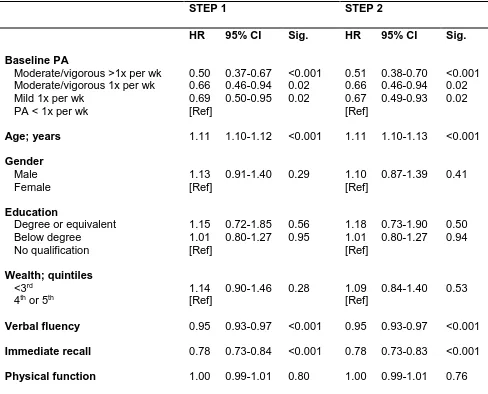
In cox proportional hazards regression (see Table 2), PA levels were independently
associated with dementia incidence in a dose-dependant manner. In the fully adjusted
model, mild PA 1x/wk (multivariate adjusted HR=0.69, 95%CI=0.50–0.95, p=0.02),
moderate/vigorous PA 1x/wk (multivariate adjusted HR=0.66, 95%CI=0.46–0.94,
p=0.02) and moderate/vigorous PA >1x/wk (multivariate adjusted HR=0.50,
95%CI=0.37–0.67, p<0.001) lowered the HR for dementia, compared to those that
reported doing PA<1x/wk.
3.2. Average PA levels (across follow-up) and incident dementia
Average PA levels before diagnosis in those with incident dementia (2.63 ± 0.05; i.e.
mild PA 1x/wk) were lower than the average PA levels of those with no diagnosis (3.17 ±
0.01; i.e. moderate/vigorous PA 1x/wk) (p<0.001). Trajectory of PA levels across all
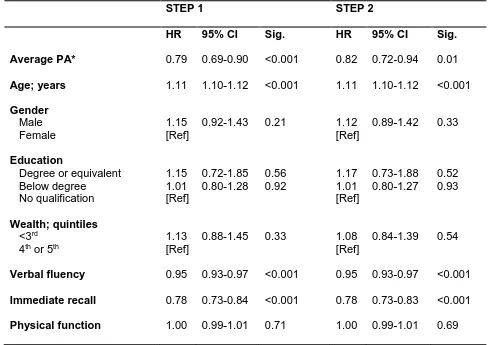
proportional hazards analyses, higher average PA levels across the follow-up period
lowered the HR for dementia (full multivariate adjusted HR=0.79, 95%CI=0.69–0.91,
p=0.001) (see Table 3).
3.3. Subgroup analysis
In those with dementia, mean PA levels, immediate recall score and verbal fluency score
dropped from pre- to post-diagnosis (p≤0.01) (see supplementary Table 1). This was the
case even though physical function appeared to increase (i.e. quicker walking speed).
Those who were active before diagnosis (i.e. averaged ≥ moderate/vigorous PA 1x/wk)
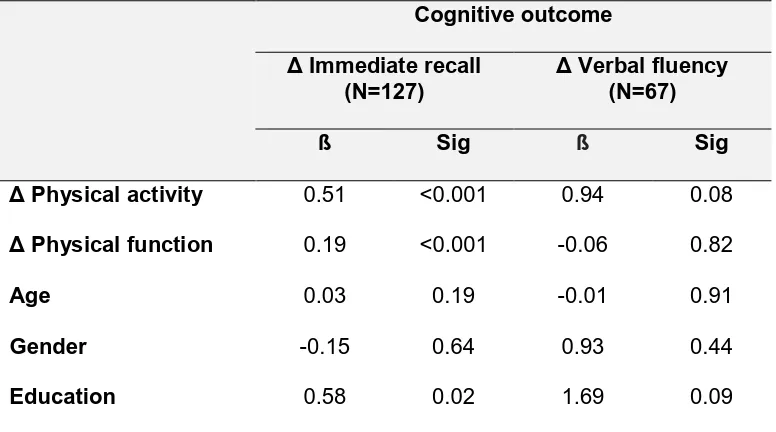
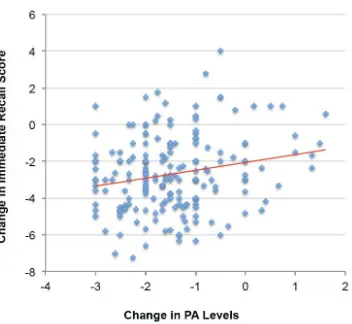
but reduced their PA levels after diagnosis (N=282), had a larger drop in immediate
recall score from pre- to post-diagnosis (ß=0.41, p<0.001), in comparison to those who
maintained or increased their PA levels (see Table 4 and Figure 2). The decrease in PA
was proportionate to decrease in cognitive score. This association was independent of
changes in physical function, age, gender and education. Although not statistically
significant, there was a similar trend between PA and verbal fluency.
3.4. Sensitivity analysis
Excluding anyone with a dementia diagnosis at waves 1-2 reduced the possibility of
reverse causality. After exclusion, there were 271 remaining dementia cases (total
sample N=8,564), which decreased the power to detect significant effects. In basic and
fully adjusted models, lower levels of PA independently increased the HR for dementia.
However, the effect of moderate/vigorous PA became marginally significant (multivariate
1x/wk (multivariate adjusted HR=0.66, 95%CI=0.45–0.96, p=0.03) and
moderate/vigorous PA>1x/wk (multivariate adjusted HR=0.51, 95%CI=0.35–0.72,
p<0.001) lowered the HR for dementia, compared to those that reported doing
PA<1x/wk. Higher average PA levels (across the follow-up) also reduced dementia risk
(full multivariate adjusted HR=0.80, 95%CI=0.68–0.94, p=0.01). Therefore, dementia
incidence up to two years after baseline assessment did not significantly affect the
association between PA and dementia risk.
4. DISCUSSION
Using prospective longitudinal data from the ELSA cohort, the present study examined
the association between self-reported PA and dementia over a 10-year follow-up period.
In the present study, PA was associated with a lowered the risk for dementia in a
dose-dependent manner. Here, moderate/vigorous PA>1x/wk appeared to be the most risk
reducing, followed by moderate/vigorous PA 1x/wk and then mild PA 1x/wk. These
findings were replicated in models adjusted for lifestyle and clinical covariates. Results
also remained consistent in sensitivity analysis that reduced the possibility of reverse
causality, although the effect of moderate/vigorous PA 1x/wk became marginally
significant, possibly due to the lower sample size and reduced power to detect effects.
The present results support previous analysis within this cohort, which found that higher
levels of PA predicted healthy ageing, including survival from major chronic disease,
depressive symptoms, physical or cognitive impairment [20]. This study also validates a
number of longitudinal studies, which have found an association between higher levels
A novel finding was observed in those who were active before dementia diagnosis (i.e.
carried out ≥ moderate/vigorous activity 1x/wk), but reduced their PA levels after
diagnosis. In this subgroup, those who reduced PA levels after diagnosis had a larger
drop in immediate recall score (pre- to post-diagnosis), compared to those who
maintained or increased their PA levels. Furthermore, those with larger decreases in PA
after diagnosis had a correspondingly larger decrease in recall score. This did not
appear to be explained by changes in physical function. It is possible that reduction in
PA levels after dementia diagnosis is due to loss of confidence or anxiety associated
with cognitive symptoms of dementia (i.e. confusion, memory loss, disorientation). On
the other hand, it could also be caused by the stigma of having dementia or perceived
dependency on carers for day-to-day activities [22]. Further research with a larger
sample size is needed to investigate the reasons why those who were active before
diagnosis may become less active after diagnosis, as this will provide insight into public
health intervention adherence. Even still, these results suggest that maintenance of PA
after dementia diagnosis may be beneficial for memory.
Neuroimaging studies and randomised controlled trials provide biological plausibility for
the neuroprotective effects of regular PA. Regular PA is associated with increased
hippocampal, prefrontal cortex and basal ganglia brain volumes, increased white matter
integrity, as well as increased brain function and connectivity between frontal and
hippocampal brain regions [23]. Additionally, both animal and human studies suggest
that exercise induced increases in BDNF may promote neurite outgrowth even in older
adults [24,25]. It is theorised that these neuroprotective factors may all contribute to an
individuals cognitive reserve; meaning that regular PA may increase a persons ability to
pathology [26]. Indeed, mechanisms contributing to neurodegeneration in dementia
include synaptic loss, neuronal death, inflammation and accumulation of toxic β-amyloid
plaques and intracellular neurofibrillary tangles. Regular PA has been shown to alleviate
or delay pathogenesis of dementia [27].
Limitations of the present study are acknowledged. Firstly, self-reported measures of PA
have been criticised, as adults may not adequately recall PA, particularly low-intensity
activities [28]. Therefore, despite our large effect sizes we may have underestimated the
strength of the effects of PA in this study due to regression dilution bias [4]. Secondly,
within the present sample, 3.5% of participants were classified as having dementia.
Given the average age of our sample at baseline (62 ± 0.1), dementia incidence is
slightly lower than reported national prevalence rates [1]. There is evidence that
approximately half of the cases of dementia in the UK remain undiagnosed [1] meaning
that physician diagnosis may underestimate dementia prevalence rates in our sample.
Physician diagnosis of dementia reported in the CAPI was not formally validated and so
results must be interpreted with this consideration in mind. Moreover, those with
dementia or experiencing symptoms of dementia may have chosen not to participate in
this study or may have been excluded in the baseline wave leading to further attrition
bias, which may have led to an underestimation of effect size.
Finally, in the present study, only complete cases were included in regression analyses.
Imputation methods were not used and missing data (due to death or loss to follow-up)
may have impacted the study findings. Those with available data throughout the study
follow-up period (waves 1 to 6) were more likely to be younger, female, more physically
cognitive and physical function at baseline; they also consumed more alcohol, but were
less likely to smoke or have reported a psychiatric condition, cardiovascular condition or
chronic disease at baseline. Therefore results of this study must be interpreted in the
context of this missing data. For instance, participants that had the lowest cognitive or
physical ability may have been less likely to be represented in the final sample.
Nevertheless, in clinical practice, PA lifestyle interventions would be designed to target
populations prior to disease onset or cases were disease activity is in its earliest stages
and disease progression is limited. Therefore, although the final sample may be biased
towards a healthier population, these participants would also be those who would be
most likely to carry out and benefit from a PA intervention designed to maintain cognitive
health in older age.
This study also has a number of important strengths, including the ability to utilise
longitudinal data from a large cohort. Sensitivity analysis in a recent meta-analysis [4],
found that only 7 of 26 reviewed cohort studies had a follow-up period of greater than
ten years and the majority of these investigated risk for cognitive decline rather than
dementia. Furthermore, studies tended to look at the relationship between baseline PA
and incident dementia (many years later) without consideration of intermediary
time-points. The present data is rare in that repeated measures of PA were taken at a
number of regular intervals across the follow-up period and in synchrony with recorded
dementia diagnosis. Furthermore, a definition of PA was used that outlined both intensity
and frequency of activity, and this is relevant for increasing the clinical applicability of
these findings. To inform intervention guidelines, the present study found that average
to vigorous PA 1x/wk. Moderate PA includes any type of activity with a MET score of
3.5-6 and vigorous PA includes activity with a MET score above 6.
Overall, maintaining higher levels of PA in older age was associated with decreased risk
for dementia. For those who were active before diagnosis, reducing PA levels after
diagnosis may be detrimental for dementia prognosis, however further research is
needed to investigate this possibility.
5. ACKOWLEDGEMENTS
The data were made available through the UK Data Archive. ELSA was developed by a
team of researchers based at the NatCen Social Research, University College London
and the Institute for Fiscal Studies. The data were collected by NatCen Social Research.
The English Longitudinal Study of Ageing is funded by the National Institute on Aging
(Grants 2RO1AG7644-01A1 and 2RO1AG017644) and by a consortium of UK
government departments coordinated by the ESRC. The developers and funders of
ELSA and the Archive do not bear any responsibility for the analyses or interpretations
presented here.This study was carried out as part of PRIDE (PRomoting Independence
in DEmentia). PRIDE was funded by the UK Economic and Social Research Council
(ESRC) (Grant ES/L001802/1). This research was also possible due to a PhD
6. REFERENCES
1. Prince M, Knapp M, Guerchet M, McCrone P, Prina M, Comas-Herrera A, et al.:
Dementia UK: Update (Second Edition). London, 2014.
2. Prince M, Wimo A, Guerchet M, Ali G-C, Wu Y-T, Prina M: The global impact of
dementia: an analysis of prevalence, incidence, cost and trends. London, 2015.
3. Clifford A, Bandelow S, Hogervorst E: The effects of physical exercise on cognitive
function in the elderly. Handbook of Cognitive Aging: Causes Processes and
Mechanisms. New York, Nova Sciences, 2010.
4. Blondell SJ, Hammersley-Mather R, Veerman J: Does physical activity prevent
cognitive decline and dementia?: A systematic review and meta-analysis of
longitudinal studies. BMC Public Health 2014 May 27;14:510.
5. Öhman H, Savikko N, Strandberg TE, Pitkälä KH: Effect of physical exercise on
cognitive performance in older adults with mild cognitive impairment or dementia:
a systematic review. Dement Geriatr Cogn Disord 2014 Jan;38:347–65.
6. Denkinger MD, Nikolaus T, Denkinger C, Lukas A: Physical activity for the
prevention of cognitive decline: current evidence from observational and controlled
studies. Zeitschrift für Gerontol und Geriatr 2012 Jan;45:11–6.
7. Rogers RL, Meyer JS, Mortel KF: After reaching retirement age physical activity
sustains cerebral perfusion and cognition. J Am Geriatr Soc 1990 Mar;38:123–8.
8. Colcombe SJ, Erickson KI, Scalf PE, Kim JS, Prakash R, McAuley E, et al.:
Aerobic exercise training increases brain volume in aging humans. J Gerontol A
Biol Sci Med Sci 2006 Nov;61:1166–70.
9. Kramer AF, Erickson KI: Capitalizing on cortical plasticity: influence of physical
10. Hogervorst E: Exercise to Prevent Cognitive Decline and Alzheimer’s disease: For
Whom, When, What, and (most importantly) How Much? J Alzheimer’s Dis Park
2012 Feb 2;02. DOI: 10.4172/2161-0460.1000e117
11. Miller DI, Taler V, Davidson PSR, Messier C: Measuring the impact of exercise on
cognitive aging: methodological issues. Neurobiol Aging 2012 Mar;33:622.e29–43.
12. Snowden M, Steinman L, Mochan K, Grodstein F, Prohaska TR, Thurman DJ, et
al.: Effect of exercise on cognitive performance in community-dwelling older
adults: review of intervention trials and recommendations for public health practice
and research. J Am Geriatr Soc 2011 Apr;59:704–16.
13. Steptoe A, Breeze E, Banks J, Nazroo J: Cohort Profile: The English Longitudinal
Study of Ageing. Int J Epidemiol 2013;42:1640–1648.
14. Marmot MG, Smith GD, Stansfeld S, Patel C, North F, Head J, et al.: Health
inequalities among British civil servants: the Whitehall II study. Lancet (London,
England) 1991 Jun 8;337:1387–93.
15. McMunn A, Hyde M, Janevic M, Kumari M: Health; in Marmot M, Banks J, Blundell
R, Lessof C, Nazroo J (eds): Health, wealth and lifestyles of the older population in
England: the 2002 English Longitudinal Study of Ageing. London, 2004, p 208.
16. Ainsworth BE, Haskell WL, Whitt MC, Irwin ML, Swartz AM, Strath SJ, et al.:
Compendium of physical activities: an update of activity codes and MET
intensities. Med Sci Sports Exerc 2000 Sep;32:S498–504.
17. Jorm AF, Jacomb PA: The Informant Questionnaire on Cognitive Decline in the
Elderly (IQCODE): socio-demographic correlates, reliability, validity and some
norms. Psychol Med 1989 Nov;19:1015–22.
18. Jorm AF: The Informant Questionnaire on cognitive decline in the elderly
19. Folstein MF, Folstein SE, McHugh PR: “Mini-mental state”. A practical method for
grading the cognitive state of patients for the clinician. J Psychiatr Res 1975
Nov;12:189–98.
20. Hamer M, Lavoie KL, Bacon SL: Taking up physical activity in later life and healthy
ageing: the English longitudinal study of ageing. Br J Sports Med 2014 Mar
1;48:239–43.
21. Karim J, Weisz R, Bibi Z, Rehman S: Validation of the eight-item centre for
epidemiologic studies depression scale (CES-D) among older adults. Curr Psychol
2014; DOI: 10.1007/s12144-014-9281-y
22. Whitehead PJ, Drummond AEE, Walker MF, Parry RH: Interventions to reduce
dependency in personal activities of daily living in community-dwelling adults who
use homecare services: protocol for a systematic review. Syst Rev 2013 Jan;2:49.
23. Erickson KI, Hillman CH, Kramer AF: Physical activity, brain, and cognition. Curr
Opin Behav Sci 2015 Aug;4:27–32.
24. Aguiar AS, Castro AA, Moreira EL, Glaser V, Santos ARS, Tasca CI, et al.: Short
bouts of mild-intensity physical exercise improve spatial learning and memory in
aging rats: involvement of hippocampal plasticity via AKT, CREB and BDNF
signaling. Mech Ageing Dev Jan;132:560–7.
25. Leckie RL, Oberlin LE, Voss MW, Prakash RS, Szabo-Reed A,
Chaddock-Heyman L, et al.: BDNF mediates improvements in executive function following a
1-year exercise intervention. Front Hum Neurosci 2014 Jan;8:985.
26. Stern Y: Cognitive reserve in ageing and Alzheimer’s disease. Lancet Neurol 2012
Nov;11:1006–12.
27. Phillips C, Baktir MA, Das D, Lin B, Salehi A: The Link Between Physical Activity
28. Middleton LE, Manini TM, Simonsick EM, Harris TB, Barnes DE, Tylavsky F, et al.:
Activity energy expenditure and incident cognitive impairment in older adults. Arch
TABLES
Table 1. Characteristics of the population at baseline
No incident dementia
Incident dementia
Sig.
Age; years N = 10,746
64.80 ± 0.09
N = 388
75.59 ± 0.45
<0.001
Gender
Male Female
N = 10,746
46 54
N = 388
42 58
0.16
Education
Degree or equivalent Below degree
No qualification
N = 10,722
11 47 42
N = 385
7 35 58
<0.001
Verbal Fluency N = 10,489
19.36 ± 0.06
N = 367
15.25 ± 0.29
<0.001
Immediate Recall N = 10,487
5.47 ± 0.02
N = 370
4.07 ± 0.09
<0.001
Walking speed; seconds N = 10,746
1.39 ± 0.11
N = 388
2.73 ± 0.87
0.03
Baseline PA
Moderate/vigorous >1x per wk Moderate/vigorous 1x per wk Mild 1x per wk
PA < 1x per wk
N = 10,647
60 15 15 10
N = 378
42 16 22 20 <0.001 Wealth; quintiles <3rd 4th or 5th
N = 10,551
59 41
N = 386
69 31 <0.001 Smoking status Current Previous Never
N = 10,654
18 47 35
N = 378
12 50 38 0.02 Alcohol consumption >1x daily Daily 1-2x per wk <1x per wk
N = 10,652
4 24 31 41
N = 377
4 19 26 51 0.003 Depression Yes No
N = 10,746
5 95
N = 388
4 96
Mood problem
Yes No
N = 10,746
5 95
N = 388
3 97
0.23
Cardiovascular condition
Yes
No
N = 10,744
50 50
N = 388
71 29
<0.001
Chronic disease
Yes
No
N = 10,746
50 50
N = 388
58 42
0.003
Table 2. Cox proportional hazards regression to predict dementia risk from baseline PA
(N=10,663)
STEP 1 STEP 2
HR 95% CI Sig. HR 95% CI Sig.
Baseline PA
Moderate/vigorous >1x per wk Moderate/vigorous 1x per wk Mild 1x per wk
PA < 1x per wk
0.50 0.66 0.69 [Ref] 0.37-0.67 0.46-0.94 0.50-0.95 <0.001 0.02 0.02 0.51 0.66 0.67 [Ref] 0.38-0.70 0.46-0.94 0.49-0.93 <0.001 0.02 0.02
Age; years 1.11 1.10-1.12 <0.001 1.11 1.10-1.13 <0.001
Gender
Male Female
1.13 [Ref]
0.91-1.40 0.29 1.10
[Ref]
0.87-1.39 0.41
Education
Degree or equivalent Below degree No qualification 1.15 1.01 [Ref] 0.72-1.85 0.80-1.27 0.56 0.95 1.18 1.01 [Ref] 0.73-1.90 0.80-1.27 0.50 0.94 Wealth; quintiles <3rd 4th or 5th
1.14 [Ref]
0.90-1.46 0.28 1.09
[Ref]
0.84-1.40 0.53
Verbal fluency 0.95 0.93-0.97 <0.001 0.95 0.93-0.97 <0.001
Immediate recall 0.78 0.73-0.84 <0.001 0.78 0.73-0.83 <0.001
Physical function 1.00 0.99-1.01 0.80 1.00 0.99-1.01 0.76
STEP 1: Adjusted for baseline PA, age, gender, education, wealth, cognitive function, physical function
STEP 2: Adjusted for baseline PA, age, gender, education, wealth, cognitive function, physical function, smoking
Table 3. Cox proportional hazards regression to predict dementia risk from average PA levels across the follow-up (N=10,667)
STEP 1 STEP 2
HR 95% CI Sig. HR 95% CI Sig.
Average PA* 0.79 0.69-0.90 <0.001 0.82 0.72-0.94 0.01
Age; years 1.11 1.10-1.12 <0.001 1.11 1.10-1.12 <0.001
Gender
Male Female
1.15 [Ref]
0.92-1.43 0.21 1.12
[Ref]
0.89-1.42 0.33
Education
Degree or equivalent Below degree No qualification 1.15 1.01 [Ref] 0.72-1.85 0.80-1.28 0.56 0.92 1.17 1.01 [Ref] 0.73-1.88 0.80-1.27 0.52 0.93 Wealth; quintiles <3rd 4th or 5th
1.13 [Ref]
0.88-1.45 0.33 1.08
[Ref]
0.84-1.39 0.54
Verbal fluency 0.95 0.93-0.97 <0.001 0.95 0.93-0.97 <0.001
Immediate recall 0.78 0.73-0.84 <0.001 0.78 0.73-0.83 <0.001
Physical function 1.00 0.99-1.01 0.71 1.00 0.99-1.01 0.69
* In those with dementia diagnosis, average PA is calculated using only waves prior to diagnosis
STEP 1: Adjusted for average PA, age, gender, education, wealth, cognitive function, physical function
STEP 2: Adjusted for average PA, age, gender, education, wealth, cognitive function, physical function, smoking
Table 4. Multiple regression to predict scores on immediate recall and verbal fluency measures. Coefficients (ß) and significance values (sig.) are reported
Cognitive outcome
Δ Immediate recall (N=127)
Δ Verbal fluency (N=67)
ß Sig ß Sig
Δ Physical activity 0.51 <0.001 0.94 0.08
Δ Physical function
0.19 <0.001 -0.06 0.82
Age 0.03 0.19 -0.01 0.91
Gender -0.15 0.64 0.93 0.44
Education 0.58 0.02 1.69 0.09
FIGURE 1
FIGURE 2
Figure 2. Changes inimmediate recall score and PA levels from pre- to post-diagnosis. Negative values show a decrease, whereas positive values indicate an increase.
Supplementary Figure 1. Mean category response for self-reported PA (± SEM) stratified by dementia diagnosis, at waves 1-6.PA categories: 1 = no PA at least once per week; 2 = mild PA once per week; 3 = moderate or vigorous PA once per week; 4 = moderate or vigorous PA two times per week or more.
Supplementary Table 1. Mean (±SEM) values for cognitive function, physical function and physical activity levels pre-diagnosis and post-diagnosis. These participants carried out moderate/vigorous PA at least 1x/wk prior to diagnosis (N=282)
Dementia diagnosis
Pre Post Sig.
Verbal fluency 15.50 ± 0.49 10.13 ± 0.57 <0.001
Immediate recall 4.05 ± 0.11 1.79 ± 0.15 0.001
Physical function 4.64 ± 0.24 3.55 ± 0.32 0.001
Physical activity 2.64 ± 0.06 1.56 ± 0.05 <0.001
1 2 3 4
Wave 1 Wave 2 Wave 3 Wave 4 Wave 5 Wave 6
Se
lf
-r
e
p
o
rte
d
P
A
No Dementia Dementia Highest PA
levels