Development and characterization of a stable adhesive bond between a
poly(dimethylsiloxane) catheter material and a bacterial biofilm resistant acrylate
polymer coating
Bonnie J Tyler, Andrew L Hook, Andreas Pelster, Heinrich F Arlinghaus, Paul Williams and Morgan R Alexander
Abstract:
Catheter associated urinary tract infections (CA-UTIs) are the most common health related infections world wide, contributing significantly to patient morbidity and mortality and increased health care costs. To reduce the incidence of these infections, new materials that resist bacterial biofilm formation are needed. A composite catheter material, consisting of bulk PDMS coated with a novel bacterial biofilm resistant polyacrylate (EGDPEA–co-DEGMA) has been proposed. The coated material shows excellent bacterial resistance when compared to commercial catheter materials but delamination of the coatings under mechanical stress presents a challenge. In this work, the use of oxygen plasma treatment to improve the wettability and reactivity of the PDMS catheter material and improve adhesion with the EGDPEA–co-DEGMA coating has been
investigated. Argon Cluster 3D-imaging Time-of-Flight Secondary Ion Mass Spectrometry (ToF-SIMS) has been used to probe the buried adhesive interface between the EGDPEA–co-DEGMA coating and the treated PDMS. ToF-SIMS analysis was performed in both dry and frozen-hydrated states and results were compared to mechanical tests. From the ToF-SIMS data we have been able to observe the presence of PDMS, silicates, salt particles, cracks and water at the adhesive
interface. In the dry catheters, low molecular weight PDMS oligomers at the interface were associated with poor adhesion. When hydrated, the hydrophilic silicates attracted water to the interface and led to easy delamination of the coating. The best adhesion results, under hydrated conditions, were obtained using a combination of 5 min O2 plasma treatment and silane primers.
Cryo-ToF-SIMS analysis of the hydrated catheter material showed that the bond between the primed PDMS catheter and the EGDPEA–co-DEGMA coating was stable in the presence of water. The resulting catheter material was resisted Escherichia coli and Proteus mirabilis biofilm
colonization by up to 95 % compared with uncoated PDMS after 10 days of continuous bacterial exposure and had the mechanical properties necessary for use as a urinary catheter.
1. Introduction
Catheter associated urinary tract infections (CA-UTIs) are the most common health care related infections worldwide1 with an estimated 100,000 symptomatic infections annually in the USA
alone2-3. These CA-UTIs result in increased length of hospital stays with associated costs4, contribute
to development of drug resistant bacterial strains3, and lead to increased mortality5-6. Bacterial
biofilm formation on the interior and exterior surfaces of the catheter has been identified as the most important cause of CA-UTIs7-8. To reduce the incidence of these infections, there is a critical
need for new catheter materials that prevent bacterial biofilm formation. Using a combinatorial polymer library, Hook et al have identified a bacterial biofilm resistant polyacrylate a copolymer of ethylene glycol dicyclopentenyl ether acrylate (EGDPEA) and di(ethyleneglycol) methyl ether methacrylate (DEGMA), that is resistant to bacterial attachment in both in vitro and in vivo assays 9-10. This copolymer has mechanical properties compatible with a flexible coating on PDMS necessary
Poly (dimethylsiloxane) has the flexibility, inertness and durability required for urinary catheters as well as a range of other biomedical applications such as breast prosthesis, hydrocephalus shunts, cardiac pacemakers, cochlear implants, artificial skins, temporomandibular joints, drug delivery systems, drainage implants in glaucoma, maxillofacial reconstruction, oesophagus replacements, finger joints, and denture liners. Despite its excellent bulk properties, the surface properties of PDMS frequently lead to an adverse biological response such as fibrotic encapsulation, thrombosis or bacterial biofilm formation12-14. For this reason, there have been many efforts to modify the
surface of PDMS in order to improve the induced biological response. In this work we have investigated coating PDMS catheter tubing with the EGDPEA–co-DEGMA coating to create a catheter material that would be resistant to bacterial biofilm formation.
Creating a strong adhesive bond between PDMS and any coating is difficult because of the inertness and hydrophobicity of PDMS. A number of strategies have been employed to modify the surface of PDMS, such as blending, copolymerization, interpenetrating polymer networks and functionalization15-16. In this work, we have used O
2 plasma treatment of PDMS to improve the
hydrophilicity and reactivity of the surface. Plasma treatment has been previously used to reduce the hydrophobicity of PDMS and hence make it more favorable for cell attachment. In particular, O2
plasma has been extensively investigated for producing a thin silica sheet on PDMS, providing a hydrophilic layer that can prevent solvent swelling, improve wetting and inhibit the migration of PDMS oligomers to the surface. In addition to producing a silica layer, plasma treatment is well known for its ability to produce long-lived, highly reactive radicals within treated species 17. These
groups can be advantageous for establishing covalent links between a coating and the PDMS or for inducing subsequent grafting-to polymerisation 18. In this study we explore the influence of O
2
plasma treatment on PDMS at improving the interaction of an antibacterial coating 9,10 with PDMS
catheter tubing.
Historically, studying adhesion between polymer layers has been extremely challenging because of a lack of suitable analytical techniques for probing the buried interface. Recent advances in cluster ion beam technology have made sputter depth profiling a practical alternative for depth profiling and 3D imaging of organic materials 19-23. In this work we have used dual-beam 3D imaging Time of
Flight secondary ion mass spectrometry (ToF-SIMS) 24, using an argon cluster sputter source, to
probe the adhesive layer between the EGDPEA–co-DEGMA coating and a PDMS catheter in order to better understand and thereby improve the adhesion.
2. Methods
A. Polymer preparation
To form the polymer, Bis[(difluoroboryl)diphenylglyoximato]cobalt(II) (CoPhBF, 1000ppm) and 2,2’-azobis(4-methoxy-2,4-dimethylvaleronitrile) (0.5%, w/v) were added to monomer (ethylene glycol dicyclopentenyl ether acrylate (EGDEA) and di(ethyleneglycol) methyl ether methacrylate (DEGMA) EGDEA:DEGMA = 3:1 in toluene. The chemical structure of the monomers is shown in figure S1 in the supplemental material. The ratio between monomers and toluene was 1:4. The solution was degassed using at least two freeze-pump-thaw cycles, until no more bubble formation was observed in the thaw step. The polymerisation was conducted at 80 °C for 24 h under N2. The polymerization
was terminated by exposure to air and cooling the reaction flask. 1H and 13C nuclear magnetic
a fitted IR detector. Polymer samples (7 mg/ml) dissolved in tetrahydrofuran were flowed (1 ml/min) through a PLgel 5 mm guard column (Polymer Laboratories) and two PLgel 5mm MIXED-C columns (Polymer Laboratories) at 40 °C. Polymer was precipitated by dropwise addition to cold hexane. The polymer was dried under vacuum (<50 mbar) overnight before use.
B. Sample preparation
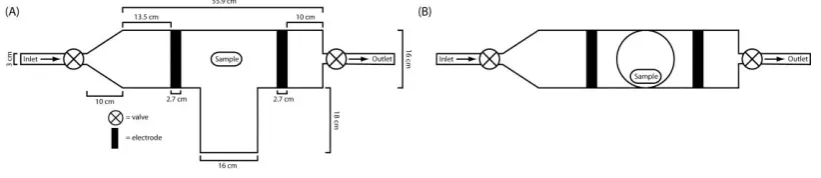
PDMS tubing (Sterilin) of 100% was cut into approximately 10 mm lengths, washed in acetone for 10 minutes with sonication, dried and then O2 plasma treated using a custom built reactor as shown
in figure 1. The reactor pressure was initially reduced to below 0.02 mbar and flushed twice with O2
before plasma treatment. For plasma treatment O2 initial pressure was 0.4 mbar and typically
running pressure was 0.49-0.58 mbar. Plasma treatment times were 10 s, 1 min., 5 min., 10 min. and 30 min. Plasma power was 100 W. After plasma treatment was completed the chamber was evacuated to below 0.08 mbar before exposure to atmosphere. The treated samples were then immersed for 10 min. into 7.5% (w/v) polymer solution in dichloromethane within 2 min. from the end of the plasma cycle. Samples were then withdrawn at approximately 5 mm/s, blotted and dried overnight at ambient conditions and then dried in vacuum (<50 mbar) at 75 ºC for 3 days.
Silane primed samples were prepared by immersing PDMS tubing (Sterilin) into a 20% (v/v) mixture of tetrabutyl-titanate, tetrapropylsilicate and tetra (2-methoxyethoxy) silane in naphtha solvent (Nusil MED1-161). Samples were withdrawn at approximately 1 mm/s and allowed to dry for 5 mins before dipping into 7.5% (w/v) polymer solution in dichloromethane. Samples were then withdrawn at approximately 5 mm/s, blotted and dried overnight at ambient conditions and then dried in vacuum (<50 mbar) at 75 ºC for 3 days.
C. Sample analysis
Samples were assessed gravimetrically before and after coating. For measurements of water contact angle (WCA) a CAM200 instrument (KSV Instruments, Ltd) was used to dispense 10 µL volume sessile water droplets onto plasma treated PDMS samples. Three measurements were taken per sample. Ultrapure water was used for all CA measurements (18.2 MΩ resistivity at 25 °C). WCA measurements after O2 plasma treatment were taken within 2-4 min. of the completion of the
[image:3.595.74.485.323.412.2]plasma treatment cycle. Light microscopy images were acquired using an Olympus IX51 microscope and a Smart Imaging System (IMSTAR S.A.) with a 10 × objective lens. Scanning electron microscopy images were acquired using a JSM 6400 Scanning Microscope (Jeol Winsem). Samples were fixed onto conductive carbon tape and pre-coated with an approximately 10 nm Pt layer prior to imaging. For cross-sectional images samples were immersed into liquid nitrogen and then fractured using a scalpel blade.
D. Revolutions-to-delamination assay
To assess the strength of the interface between the polymer coating and PDMS substrate, coated samples were subjected to a rolling tube compression test which put very stringent interfacial stresses upon the interfaces. The output from this was the number of revolutions to delamination (RTD) which could be compared as a measure of interfacial stability. The test was performed by placing the samples between two glass slides and a 1 kg weight was placed on top of the sample (see supplemental material, fig. S2). The bottom glass slide was fixed whilst the top slide was moved back and forth to cause the sample to roll along the two glass surfaces. The sample was rolled until a complete revolution was completed and then the movement direction was reversed. This was continued until a delamination event was observed or 1000 rotations were completed. Between samples both glass surfaces were thoroughly cleaned with isopropanol. For analysis of hydration effects, samples were placed into ultrapure water (18.2 MΩ resistivity at 25 °C) for 1 h. Samples were then blotted onto paper towel to remove excess water from the lumen of the sample and then rolled once to remove excess water from the exterior of the sample.
E. Bacterial attachment assay
Uropathogenic Escherichia coli (UPEC) (E. coli 536)25 and Proteus mirabilis (DSMZ226637, clinical
isolate, Queens Medical Centre, UK) were routinely grown on either LB (Luria-Bertani, Oxoid, UK) agar plates at 37 °C or in broth at 37 °C with 200 rpm shaking. RPMI-1640 chemically defined medium (Sigma, UK) was used in the biofilm experiments. Prior to incubation with the bacteria, the coated samples were UV sterilised and washed in phosphate buffer saline (PBS, Oxoid) for 10 min. Bacteria were grown on polymer samples under similar conditions to those previously described12.
Briefly, samples were incubated in 10 ml medium inoculated with diluted (OD600 = 0.01) bacteria
from overnight cultures and grown at 37 °C with 60 rpm shaking for 3-10 days. After 3 days of growth the media was decanted and replaced with 10 ml of fresh, pre-warmed media. As growth medium controls, coated samples were also incubated without bacteria. At the desired time points, the samples were removed, washed three times with 15 ml PBS at room temperature for 5 min.at 60 rpm, rinsed with distilled H2O and stained with 20 µM SYTO17 dye (Invitrogen, UK) at room
temperature for 30 min. After air drying, the samples were examined using a Carl Zeiss LSM 700 Laser Scanning Microscope with ZEN 2009 imaging software (Carl Zeiss, Germany). The coverage of bacteria on the surface was analysed using open source Image J 1.44 software (National Institute of Health, USA).
F. ToF-SIMS Analysis
ToF-SIMS measurements were performed on a custom built ToF-SIMS instrument which is largely comparable to the IONTOF V. The instrument is equipped with a novel cryo-preparation chamber to allow easy handling of frozen hydrated samples. The 3D images of the catheters were obtained in dual beam mode using an approximately 0.05 pA (pulsed mode) 30 keV Bi3+ primary ion beam for
analysis and 2.1 nA, 10 keV Ar2000+ for sputtering. Non-interlaced sputtering, with a 50 s analysis
cycle, 20 s sputter cycle, and 1 s pause, was used to minimize sample charging.
transferred to the instrument, the samples were maintained at -130 °C throughout the analysis process.
3. Results and Discussion
A. Plasma treatment of PDMS
PDMS samples were initially exposed to O2 plasma treatment at a power of 100 W from 10 s – 30
mins. After treatment samples were assessed by light microscopy and WCA. Figure 2 shows the light micrographs of untreated PDMS (fig. 2A) and samples treated with O2 plasma for 5 min.(fig. 2B), 10
min.(fig. 2C) and 30 min.(fig. 2D). No change in the appearance of samples was observed after plasma treatment for 10 s or 1 min. compared with untreated PDMS. After 5 minutes treatment, cracks were observed on the PDMS surface (fig. 2B). The number of cracks increased with further increases in treatment (fig. 2 C-D). Crack formation has previously been observed after plasma treatment of PDMS due to the formation of a brittle silica layer, which becomes thicker with longer treatment times 14, 26-28.
(A) (B)
[image:5.595.96.528.293.606.2](C) (D)
Figure 2. Bright field light microscopy images of PDMS after oxygen plasma treatment. Treatment times were (A) as received, (B) 5 min, (C) 10 min, and (D) 30 min.
previously observed in many studies and has been attributed to migration of lower molecular weight PDMS oligomers from the bulk to the surface.
B. Substrate coating
After plasma treatment, the catheter tubing was dip-coated with EGDPEA–co-DEGMA. Once dried, all coatings on plasma treated PDMS appeared smooth and homogeneous. In contrast, coatings on untreated PDMS dewetted on the surface. The shortest treatment time (10 s) was thus sufficient to avoid dewetting of the coating. The coating thickness was determined by gravimetric analysis and SEM measurements and is shown in figure 4, representative SEM image shown in the supplemental material fig S3. A maximum thickness of 7 ± 1 µm was observed for the 5 minute treatment time. Coating thickness decreased with an increase in treatment time to a minimum thickness of 2 ± 0.5 µm for the 30 minute treatment (fig. 4A). SEM measurements of the coating thickness (fig. 4B), however, show large variability (std > ± 4 µm) in the coating thickness for all treatment times. It should be noted that the gravimetric analysis measures an average thickness across the whole sample whereas the SEM measurements are associated with localised regions of the sample.
50 70 90 110
0 10 20 30
W
C
A
(
o)
[image:6.595.83.255.120.262.2]Treatment time (min) (A)
Figure 3. Change in WCA of the oxygen plasma treated time immediately after plasma treatment. The unfilled symbol indicates untreated PDMS.
0 2 4 6 8
0 10 20 30
Gr av im etr ic co atin g th ick n ess ( m m)
Treatment time (min)
0 2 4 6 8 10 12 14
0 10 20 30 40
T h ick n ess ( m m)
Treatment time (min)
(A)
(B)
[image:6.595.85.492.542.672.2]C. Mechanical testing
Figure 5 shows the result of the loaded roll test for dry and hydrated samples. Examples of delamination events are shown in the supplemental material (fig. S4). For dry samples, the RTD increased from less than 10 for treatment times under 5 minutes to >1000 for treatment times over 10 minutes (fig. 5A). Note that the test was stopped after 1000 revolutions if no delamination occurred so the apparent plateau in figure 5 is artificial. A dramatic reduction in adhesion was observed after hydration, with the maximum RTD of 12 ± 7 occurring for a treatment time of 5 mins. This suggests that this treatment time produced sufficient reactivity at the PDMS surface to ensure adhesion between the coating and the catheter without excessive production of a silica layer. Further increasing the treatment time to 10 min. decreased the RTD to 2 revolutions, and a further increase to 0.5 revolutions was observed for a treatment time of 30 mins.
Figure 5: RTD observed for various O2 plasma treatment times for dry (A) and hydrated (B)
EGDPEA-co-DEGMA coated PDMS catheter samples. Error bars equal ± 1 standard deviation unit, n = 5.
D. Bacterial attachment assay
A treatment time of 5 min. was selected for bacterial attachment studies because it showed the best resistance to delamination under hydrated conditions. These coatings were subjected to bacterial attachment assays using UPEC and P. mirabilis for 3-10 days. These two bacterial strains are highly relevant in catheter associated urinary tract infections 29-30. Results of the bacterial
[image:7.595.73.544.254.443.2]summary, the EGDPEA–co-DEGMA coating achieved between 86-95% reduction in bacteria coverage (P. mirabilis and UPEC) compared with untreated PDMS and between 66-93% compared with the silver hydrogel after 10 days of continuous bacterial exposure.
Figure 6. Summary of bacterial attachment onto uncoated PDMS (blue square), silver hydrogel (red square), and poly(EGDPEA-co-DEGMA) coated PDMS (green square). Analysis was performed after (a) 3, (b) 6, or (c) 10 days of culturing of samples with P. mirabilis (PM) and UPEC. Bacterial coverage (top) was calculated on SYTO64 stained samples. Three images were acquired from each sample, and three repeated samples were assessed for each time point/same type. Error bars equal ± 1 standard deviation unit, n = 9. The representative maximum z-projection images for each substrate and bacterial species are shown. Images are 640640 mm2.
E. ToF-SIMS Analysis
Replicate ToF-SIMS 3D-images were collected on 100 µm x 100 µm areas on the 5, 10 and 30 min. 100 W O2 treated samples. The sputter time required to reach the interface varied significantly
within each sampled region indicating non-uniformity in either the coating thickness or sputter yield. This non-uniform layer thickness led to poor resolution of the interface. To improve resolution of the interface, all 3D images were corrected to align the layers at the base of the polymer layer 31-32. Alignment was done using an autocorrelation function rather than a threshold as this proved less
sensitive to noise. Note that this pixel level realignment of the ToF-SIMS profiles was intended to improve resolution of the interface rather than produce realistic 3D images. The images were processed using principal components analysis and multivariate curve resolution to identify all major components. Three major components, EGDPEA–co-DEGMA, SiOn, and PDMS were identified
in all of the sampled regions. Additionally, dust particles rich in Na+, K+ and NH
4+ were observed at
for these components are in the supplemental material (fig. S5). Salt rich particles are a common component of ambient aerosol33-34 and their presence at the interface suggest they were most likely
present on the catheter surfaces prior to plasma treatment and EGDPEA–co-DEGMA coating.
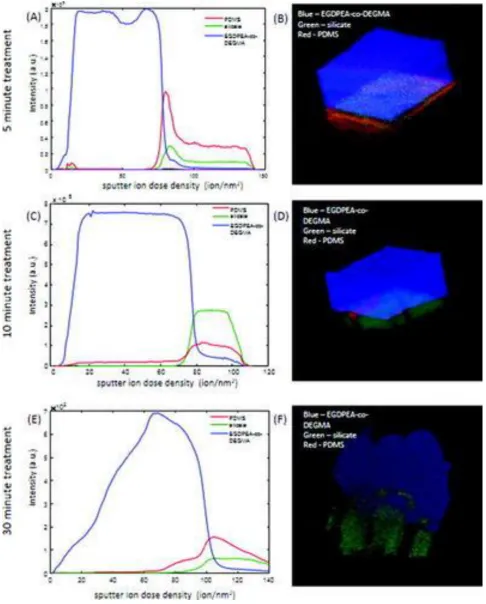
Representative depth profiles and 3D images of samples treated for 5, 10, and 30 min are shown in Fig. 7. The signals shown are the sum of characteristic peaks determined from the multivariate analysis. A table summarizing these peaks is provided in the supplementary material (Table S1). The unusual drop in the EGDPEA-co-DEGMA signal in the depth profiles, at the outermost surface of the samples, is an artefact of the topographic correction of the data. For all the images, the EGDPEA-co-DEGMA layer is shown in blue, silicate is shown in green, and PDMS is shown in red. All the samples show traces of PDMS contamination at the outermost surface on top of the EGDPEA-co-DEGMA coating.
In the samples treated for 10 and 30 minutes [figs. 7(c)-7(f)], the bulk PDMS catheter is never reached during the depth profiling, indicative of a thicker and/or harder silicate layer that is difficult to sputter. In the 10 min. samples, only two layers are observed, the EGDPEA–co-DEGMA film and a mixed silicate/PDMS layer. The PDMS signal rises only after the silicate signal appears (fig. 8A) and is observed along well defined cracks in the silicate layer (fig. 8B).
[image:11.595.71.542.512.663.2]In contrast to the 10 min. sample, the PDMS signal in the 30 min. sample begins to increase well before the silicate signal appears [fig 7(e)], indicating the presence of an intermediate layer of mixed PDMS/EGDPEA–co-DEGMA. The 3D image [fig 7(f)] shows that this PDMS/EGDPEA–co-DEGMA layer is not uniform across the surface but is localized to particular areas. In the regions, where the PDMS extends up into the EGDPEA–co-DEGMA film, EGDPEA–co-DEGMA and PDMS are both present, indicating the two polymers are mixed at the resolution of the SIMS measurement (2-3 µm). Note that these mixed layers could be protruding down into cracks in the silicate layer rather than upward into the EGDPEA–co-DEGMA. It is impossible to distinguish these two possibilities from the SIMS measurement alone. The presence of PDMS between the polymer and the silicate layer is consistent with the higher water contact angle measured on this sample. For the 3D image [fig 7(f)], it is evident that the EGDPEA–co-DEGMA layer in this sample has more variation in thickness than for the previous samples. In general, the film is thinner in areas where there is more PDMS at the interface. This is consistent with the thinner average thickness determined by gravimetric analysis.
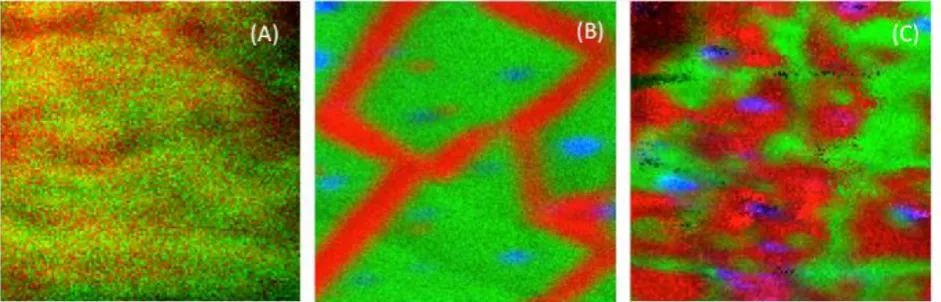
Figure 8 shows side-by-side comparison of the interface region (100 µm x 100 µm) for the same 5, 10 and 30 min. plasma treated samples shown in figure 7. In all three images, PDMS is shown in red, silicate is shown in green and salt-rich dust particles are shown in blue. The morphology of the interface in the 5 min. sample (fig. 8A) differs distinctly from the longer treatments. Not only is the silicate layer thinner and more easily sputtered, it is patchy and PDMS is visible across most of the interface. For the 10 min. treatment (fig. 8B), the PDMS appears only along distinct lines with nearly uniform width of ~10 µm. In the 30 min. treatment (fig. 8C), more of the interface is covered with PDMS and the features are much more irregular in size. Although this set of images shows an increasing number of particles at the interface with increasing plasma exposure time, replicate measurements showed significant region-to-region variability in the particle numbers.
ToF-SIMS images collected following the depth profiles, after the argon cluster sputtering was stopped, showed rapid migration of the PDMS across the sputter cleaned surface. Figure 9 shows higher spatial resolution (~500 nm) ToF-SIMS images of the PDMS (m/z =73 + m/z = 147) signal of the interface of a second 10 min. treated area. The image on the left (fig. 9A) was completed within 1 minute of Ar cluster sputtering. The image on the right (fig. 9B) was taken 5 minutes later. As is evident from the images, PDMS migration across the sputter cleaned surface is very rapid with ~85% surface coverage occurring in 5 minutes. These results suggest that the uniform width of the PDMS lines in the 10 min. samples (fig. 8B) were the result of PDMS migration from cracks in the silicate during image acquisition between sputter cycles. To confirm this hypothesis, an additional ToF-SIMS depth profile was performed on the 10 min. catheter, while maintaining the sample at -130°C to prevent PDMS migration. In this depth-profile (data not shown) PDMS was still observed on the outermost surface but no PDMS was observed at the EGDPEA–co-DEGMA-silicate interface until the sample was allowed to warm up to ambient temperature and migration ensued.
Figure 9. High spatial resolution 100 100 mm ToF-SIMS images of PDMS (m/z = 73) + (m/z = 147) at the coating/catheter interface taken immediately after 10 keV Ar sputtering (a) and 5 min after sputtering (b) for the sample that had been treated for 10 min with the O2 plasma.
Figure 10: ToF-SIMS depth profile (A) and 3D image (B) and interface image (C) of 100 100 mm region of the hydrate 10 minute treatment DEGMA coated PDMS catheter. EGDPEA-co-DEGMA is shown in red, silicate in green and water in blue.
Because the mechanical strength of the EGDPEA–CO-DEGMA/PDMS bond was found to be insufficient using only O2 plasma treatment we utilised silanization as a methodology for improving
Figure 11: ToF-SIMS depth profile (A) and 3D image (B) of 100 100 mm region of EGDPEA-co-DEGMA coated PDMS catheter with Nusil primer. EGDPEA-co-EGDPEA-co-DEGMA is shown in blue, silicate in green and primer in red. The depth scale is uncalibrated.
Figure 12 summarizes the cryo-ToF-SIMS results for the hydrated primed sample. Note that EGDPEA–co-DEGMA is shown in red in the 3D image (fig. 12 B) while primer is shown in red in the interface image (fig. 12 C). Although the primed sample showed significantly improved adhesion hydrated, trace amounts of water were observed at the interface between the EGDPEA–co-DEGMA and silicate. This trace amount of water was localized in a few discrete spots. Detailed analysis of spectra from these water containing regions showed salt and organic impurities that were not observed in the hydrated material without primer. This suggests that the traces of water were associated with hydrophilic salt particles that were seen at most of the interfaces.
[image:14.595.82.532.85.300.2] [image:14.595.77.545.522.674.2]
Clear differences in the levels of PDMS at the interface as well as the thickness and morphology of the silicate layer were detected for samples treated with the O2 plasma for 5, 10, and 30 min. The sample treated for 5min showed higher levels of hydrophobic PDMS at the interface, which could explain both the lower dry RTD values and the lower susceptibility of the adhesive bond to hydration.
The 10 min treated sample showed no PDMS at the interface although PDMS was able to migrate from the bulk to cover the bare silicate surface within a few min, once the EGDPEA-co-DEGMA film was removed. Although hydrophobic recovery of plasma-treated PDMS has been widely reported in the literature, it has generally been reported over periods of days not minutes.27-28, 35-36 In this
study, hydrophobic recovery on the uncoated plasma treated samples was observed after 1 week, but not in the measurements taken within 5 min of the treatment, in contrast to the SIMS results on sputter cleaned surfaces. This suggests that the rate of hydrophobic recovery is initially determined by the rate of crack propagation through the silicate layer. However, once cracks are formed, low molecular weight PDMS is able to rapidly migrate across the bare silicate surface in only a few min. The application of the EGDPEA-co-DEGMA coating immediately after plasma treatment, before the cracks are fully formed, can preserve the hydrophilic surface, but removing the EGDPEA-co-DEGMA coating after the cracks are formed leads rapidly to the PDMS coverage of the surface. This has important implications for the process development as well as forensic investigation of delaminated coatings.
The ToF-SIMS measurement of the 30 min treated sample showed increased PDMS, which is consistent with the high WCA measured on these samples. This film also showed a greater variation in the thickness of the polymer coating, associated with the surface cracks and holes. This suggests that the thinner coating, observed using gravimetric analysis, was the result of incomplete wetting of the surface at a microscale.
Cryo-ToF-SIMS analysis of the hydrated 10 min treated catheter revealed water disrupting contacts between the silicate and the EGDPEA-co-DEGMA layer over large portions of the surface. This suggests that the strong adhesion when dry was due primarily to easily hydrolyzed polar and hydrogen bonding interactions rather than covalent bonds.
In contrast, the sample treated with the primer showed only traces of water at the interface, which were likely associated with hydrophilic particulate contaminants, such as salt. Detection of water at the interface using cryo-ToF-SIMS proves that water is able to permeate the EGDPEA-co-DEGMA layer and access the interface but does not disrupt the adhesive bonds. This suggests that covalent bonding may be involved although no direct evidence for covalent bonding was found in the ToF-SIMS data. Evidence that hydrophilic dust particles may attract water to the interface suggests that future improvements in adhesion may be possible by reducing particulate contamination.
4. Conclusions
Dual-beam 3D imaging ToF-SIMS, using a 10 keV Ar2000+ cluster sputter source and a 30 keV Bi3+
Oxygen plasma treatment of the PDMS catheter for 5–10 min resulted in efficient wetting of the catheter by the EGDPEA-co-DEGMA coating and good adhesion between the layers under dry conditions. Unfortunately, hydration, which is unavoidable in a urinary catheter, dramatically reduced the strength of the adhesive bond between the layers. Inclusion of a primer layer resulted in a more resilient adhesive bond between the EGDPEA-co-DEGMA and the PDMS catheter that was resistant to hydration. Although cryo-ToF-SIMS measurements could not directly confirm covalent bonding between the primed catheter and the coating, the ToF-SIMS measurements verified that adhesion persisted despite the presence of water at the interface. The resulting catheter material is resistant to bacterial biofilm colonization and has the mechanical properties necessary for use as a urinary catheter. Biofilm formation was reduced by between 86% and 95% in bacterial coverage for both P. mirabilis and UPEC compared to untreated PDMS and between 66% and 93% compared to the silver hydrogel after 10 days of continuous bacterial exposure. This study demonstrates the importance of Ar cluster depth profiling for the better understanding of adhesion between the polymeric layers and the development of improved biomaterials.
5. Acknowledgements
Funding from EMRP (IND56) is kindly acknowledged. Provision of the Proteus mirabilis strain from Roger Bayston is kindly acknowledged.
6. References
1. Hooton, T. M.; Bradley, S. F.; Cardenas, D. D.; Colgan, R.; Geerlings, S. E.; Rice, J. C.; Saint, S.; Schaeffer, A. J.; Tambayh, P. A.; Tenke, P.; Nicolle, L. E., Diagnosis, Prevention, and Treatment of Catheter-Associated Urinary Tract Infection in Adults: 2009 International Clinical Practice Guidelines from the Infectious Diseases Society of America. Clinical Infectious Diseases 2010,50 (5), 625-663.
2. Nicolle, L. E., Urinary catheter associated infections. Infect Dis Clin North Am 2012,26.
3. Zarb, P.; Coignard, B.; Griskevicienne, J.; Muller, A.; Vankerckho ven Weist, K.; Goossens, M. M.; Vaerenberg, S.; Hopkins, S.; Catry, B.; Monnet, D. L.; Goosens, H.; Suetens, C., The European Centre for Disease Prevention and Control (ECDC) pilot point prevalence survey of healthcare-associated infections and antimicrobial use. Euro Surveill 2012,17.
4. Chant, C.; Smith, D. M.; Marshall, J. C.; Friedrich, J. O., Relationship of catheter associated urinary tract infection to mortality and length of stay in critically ill patients: a systematic review and meta-analysis of observational studies. Crit Care Med 2011,39.
5. Kunin, C. M.; Chin, Q. F.; Chambers, S., Morbidity and mortality associated with indwelling urinary catheters in elderly patients in a nursing home – confounding due to the presence of associated diseases. J Am Geriatr Soc 1987,35.
6. Clec'h, C.; Schwebel, C.; Français, A.; Toledano, D.; Fosse, J.-P.; Garrouste-Orgeas, M.; Azoulay, E.; Adrie, C.; Jamali, S.; Descorps-Declere, A.; Nakache, D.; Timsit, J.-F.; Cohen, Y., Does Catheter-Associated Urinary Tract Infection Increase Mortality in Critically Ill Patients? Infection Control & Hospital Epidemiology 2007, 28 (12), 1367-1373.
7. Stickler, D. J.; Zimakoff, J., Complications of urinary tract infections associated with devices used for long-term bladder management. J Hosp Infect 1994,28.
8. Tenke, P.; Kovacs, B.; Bjerklund Johansen, T. E.; Matsumoto, T.; Tambyah, P. A.; Naber, K. G., European and Asian guidelines on management and prevention of catheter-associated urinary tract infections. International Journal of Antimicrobial Agents 2008,31, Supplement 1, 68-78.
9. Hook, A. L.; Chang, C. Y.; Yang, J.; Atkinson, S.; Langer, R.; Anderson, D. G.; Davies, M. C.; Williams, P.; Alexander, M. R., Discovery of novel materials with broad resistance to bacterial attachment using combinatorial polymer microarrays. Adv Mater 2013,25 (18), 2542-2547.
10. Hook, A. L.; Chang, C.-Y.; Yang, J.; Luckett, J.; Cockayne, A.; Atkinson, S.; Mei, Y.; Bayston, R.; Irvine, D. J.; Langer, R.; Anderson, D. G.; Williams, P.; Davies, M. C.; Alexander, M. R., Combinatorial discovery of polymers resistant to bacterial attachment. Nat Biotech 2012,30 (9), 868-875.
Targeted Molecular and Material Property Optimization to Bacterial Attachment-Resistant (Meth)acrylate Polymers. Biomacromolecules 2016,17 (9), 2830-2838.
12. Hook, A. L.; Chang, C.; Yang, J.; Luckett, J.; Cockrayne, A.; Atkinson, S.; Mei, Y.; Bayston, R.; Irvine, D. J.; Langer, R.; Anderson, D. G.; Williams, P.; Davies, M. C.; Alexander, M. R., Combinatorial discovery of polymers resistant to bacterial attachment. Nature Biotechnology 2012,30 (9), 868-875.
13. Leung, J. M.; Berry, L. R.; Chan, A. K. C.; Brash, J. L., Surface modification of polydimethylsiloxane with a covalent antithrombin-heparin complex to prevent thrombosis. Journal of Biomaterials Science-Polymer Edition 2014,25 (8), 786-801.
14. Williams, R. L.; Wilson, D. J.; Rhodes, N. P., Stability of plasma-treated silicone rubber and its influence on the interfacial aspects of blood compatibility. Biomaterials 2004,25 (19), 4659-4673.
15. Abbasi, F.; Mirzadeh, H.; Katbab, A.-A., Modification of polysiloxane polymers for biomedical applications: a review. Polymer International 2001,50 (12), 1279-1287.
16. Ratner, B. D.; Hoffman, A.; Whiffen, J., The thrombogenicity of radiation grafted polymers as measured by the vena cava ring test. Journal of bioengineering 1978,2 (3-4), 313-323.
17. Gengenbach, T. R.; Chatelier, R. C.; Griesser, H. J., Characterization of the ageing of plasma-deposited polymer films: Global analysis of X-ray photoelectron spectroscopy data. Surface and Interface Analysis 1996,24 (4), 271-281.
18. Parvin, A.; Mirzadeh, H.; Khorasani, M. T., Physicochemical and biological evaluation of plasma-induced graft polymerization of acrylamide onto polydimethylsiloxane. Journal of Applied Polymer Science 2008, 107 (4), 2343-2349.
19. Seah, M.; Spencer, S.; Havelund, R.; Gilmore, I.; Shard, A., Depth resolution at organic interfaces sputtered by argon gas cluster ions: the effect of energy, angle and cluster size. Analyst 2015,140 (19), 6508-6516.
20. Angerer, T. B.; Blenkinsopp, P.; Fletcher, J. S., High energy gas cluster ions for organic and biological analysis by time-of-flight secondary ion mass spectrometry. Int J Mass Spectrom 2015,377, 591-598.
21. Mahoney, C. M.; Wucher, A., Molecular Depth Profiling with Cluster Ion Beams. Cluster Secondary Ion Mass Spectrometry: Principles and Applications 2013, 117-205.
22. Körsgen, M.; Pelster, A.; Dreisewerd, K.; Arlinghaus, H. F., 3D ToF-SIMS Analysis of Peptide Incorporation into MALDI Matrix Crystals with Sub-micrometer Resolution. Journal of The American Society for Mass Spectrometry 2016,27 (2), 277-284.
23. Pelster, A.; Tyler, B. J.; Stover, M.; Unger, W. E. S.; Arlinghaus, H. F., Improved 3D-imaging of a sirolimus/probucol eluting stent coating using laser postionization secondary neutral mass spectrometry and time-of-flight secondary ion mass spectrometry. Biointerphases 2016,11 (4), 041001.
24. Rading, D.; Moellers, R.; Cramer, H. G.; Niehuis, E., Dual beam depth profiling of polymer materials: Comparison of C60 and Ar cluster ion beams for sputtering. Surface and Interface Analysis 2013,45 (1), 171-174.
25. Berger, H.; Hacker, J.; Juarez, A.; Hughes, C.; Goebel, W., Cloning of the chromosomal determinants encoding hemolysin production and mannose-resistant hemagglutination in Escherichia-coli. J Bacteriol. 1982, 152 (3), 1241-1247.
26. Fritz, J. L.; Owen, M. J., Hydrophobic recovery of plasma-treated polydimethylsiloxane. Journal of Adhesion 1995,54 (1-2), 33-45.
27. Hillborg, H.; Ankner, J. F.; Gedde, U. W.; Smith, G. D.; Yasuda, H. K.; Wikstrom, K., Crosslinked polydimethylsiloxane exposed to oxygen plasma studied by neutron reflectometry and other surface specific techniques. Polymer 2000,41 (18), 6851-6863.
28. Karkhaneh, A.; Mirzadeh, H.; Ghaffariyeh, A. R., Simultaneous graft copolymerization of 2-hydroxyethyl methacrylate and acrylic acid onto polydimethylsiloxane surfaces using a two-step plasma treatment. Journal of Applied Polymer Science 2007,105 (4), 2208-2217.
29. Hidron, A. I.; Edwards, J. R.; Patel, J.; Horan, T. C.; Sievert, D. M.; Pollock, D. A.; Fridkin, S. K.; Natl Healthcare Safety Network, T.; Participating Natl Healthcare, S., Antimicrobial-Resistant Pathogens Associated With Healthcare-Associated Infections: Annual Summary of Data Reported to the National Healthcare Safety Network at the Centers for Disease Control and Prevention, 2006-2007. Infection Control and Hospital Epidemiology 2008, 29 (11), 996-1011.
30. Schumm, K.; Lam, T. B., Types of urethral catheters for management of short-term voiding problems in hospitalised adults. Cochrane Database Systematic Reviews 2008,16 (2), CD004013.
31. Robinson, M. A.; Graham, D. J.; Castner, D. G., ToF-SIMS Depth Profiling of Cells: z-Correction, 3D Imaging, and Sputter Rate of Individual NIH/3T3 Fibroblasts. Analytical Chemistry 2012,84 (11), 4880-4885.
32. Breitenstein, D.; Rommel, C. E.; Mollers, R.; Wegener, J.; Hagenhoff, B., The chemical composition of animal cells and their intracellular compartments reconstructed from 3D mass spectrometry. Angew Chem Int Ed Engl 2007,46 (28), 5332-5.
34. Peterson, R. E.; Tyler, B. J., Analysis of organic and inorganic species on the surface of atmospheric aerosol using time-of-flight secondary ion mass spectrometry (TOF-SIMS). Atmospheric Environment 2002,36 (39-40), 6041-6049.
35. Roth, J.; Albrecht, V.; Nitschke, M.; Bellmann, C.; Simon, F.; Zschoche, S.; Michel, S.; Luhmann, C.; Grundke, K.; Voit, B., Surface Functionalization of Silicone Rubber for Permanent Adhesion Improvement. Langmuir 2008, 24 (21), 12603-12611.
36. Rangel, E. C.; Gadioli, G. Z.; Cruz, N. C., Investigations on the stability of plasma modified silicone surfaces.
O
O
O
O
O
O
O
[image:19.595.161.467.76.165.2]EGDPEA DEGMA
Figure S1: Chemical structures of the ethylene glycol dicyclopentenyl ether acrylate (EGDPEA) and di(ethyleneglycol) methyl ether methacrylate (DEGMA), which were copolymerized to make the bacterial resistant biofilm polymer.
[image:19.595.214.410.385.544.2]Figure S3: Representative SEM image of the EGDPEA-co-DEGMA film on the treated PDMS catheter tubing. PDMS, coating and air regions are indicated on the image.
Figure S4: Examples of delamination of the EGDPEA-co-DEGMA film from the treated PDMS catheter tubing
Table S1: Characteristic Ions
Component m/z Formula
EGDPEA–co-DEGMA 41.04 C3H5+
59.05 C3H7O+
67.05 C5H7+
79.05 C6H7+
99.04 C5H7O2+
113.06 C6H9O2+
PDMS 73.05 SiC3H9+
147 Si2OC5H15+
207.07 Si3O2C6H19+
221.08 Si3O2C7H21+
silicate 27.98 Si+
44.98 SiOH+
Salts 18.03 NH4+
22.99 Na+
38.96 K+
39.96 Ca+
40.96 41K+
80.95 Na2Cl+
97.92 KNaCl+
water
37.03 H5O2+
Ti 47.95 Ti+